Atmospheric Stability
Worksheet Example
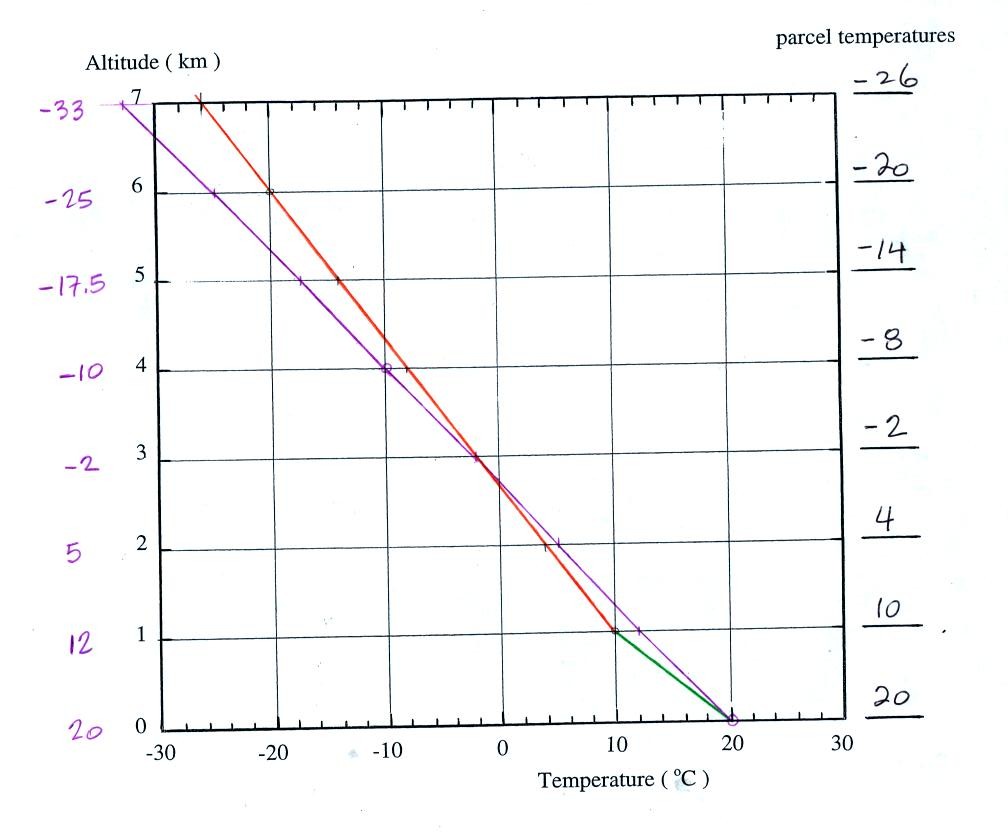
1. The following environmental temperatures were used in this
example. These data have been plotted in purple on the graph below
0 km 20o
C
4 km -10o C
1 km 12o
C
5 km -17.5o C
2 km 5o
C
6 km -25o
C
3 km -2o
C
7 km -33o
C
2. The average lapse rate between 0 and 7 km is 7.6o
C/km (note a positive value for the lapse rate means that temperature
is decreasing with increasing altitude).
3. In this sample problem we assume that moist unsaturated
air at the ground becomes saturated when it cools to 10o
C. The
temperatures in the rising parcel at 1 km intervals are shown to the
right of the graph and plotted on the graph. The green portion of
the line on the graph indicates unsaturated air, the orange portion is
saturated air.
4. The condensation level is 1 km.
5. The level of free convection is 3 km.