We'll start with a relatively easy
to understand conceptual test
that can be used to determine whether the atmosphere is stable or
unstable.
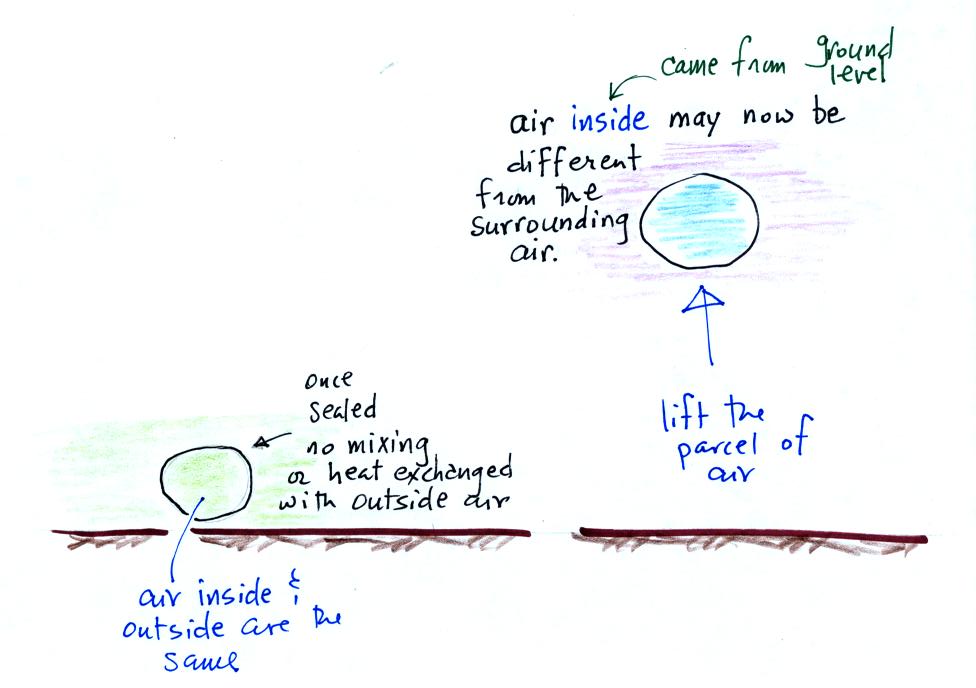
You simply take some air and
isolate
it in a parcel. At this point the air inside the parcel is
exactly the same as the air outside (same temperature, density, and
pressure). We'll assume that once the air is sealed in the parcel
it can't mix
or exchange heat with the surrounding air.
Next you imagine lifting the air. The air parcel will expand and the air in the parcel will cool somewhat. After being lifted, the air inside the parcel may have a different temperature than the surrounding air outside the parcel. This is because the air inside the parcel is "insulated" from the surrounding air.

In some ways this is like getting inside an automobile, rolling up the windows, and driving up to the top of a mountain. You might have the heater or maybe the air conditioner running in the car. In either event, once you arrive at the summit the air inside the car would probably have a different temperature than the air outside.
Once we have lifted the air we let go of the parcel and watch to see what happens next. If the air comes back to where it started, the atmosphere is stable. If the air continues to rise the atmosphere is unstable.
Next you imagine lifting the air. The air parcel will expand and the air in the parcel will cool somewhat. After being lifted, the air inside the parcel may have a different temperature than the surrounding air outside the parcel. This is because the air inside the parcel is "insulated" from the surrounding air.
In some ways this is like getting inside an automobile, rolling up the windows, and driving up to the top of a mountain. You might have the heater or maybe the air conditioner running in the car. In either event, once you arrive at the summit the air inside the car would probably have a different temperature than the air outside.
Once we have lifted the air we let go of the parcel and watch to see what happens next. If the air comes back to where it started, the atmosphere is stable. If the air continues to rise the atmosphere is unstable.
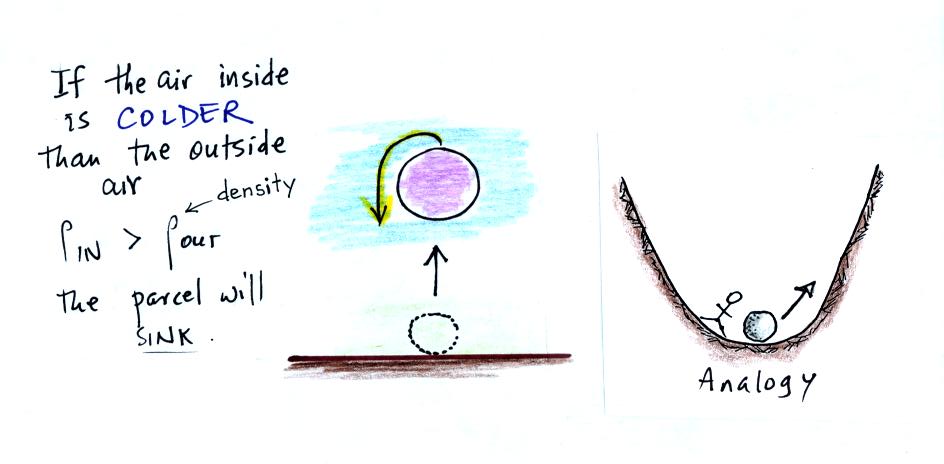
In the figure above the air in the
parcel has ended up colder and denser than the surrounding air.
In this case the parcel would sink back to the ground.
In the analogy shown above at right you can imagine giving the rock in the picture a shove then watching to see what happens. In the situation shown above the rock would roll part way up the slope but then stop, turn around, and come back down to where it started.

In the analogy shown above at right you can imagine giving the rock in the picture a shove then watching to see what happens. In the situation shown above the rock would roll part way up the slope but then stop, turn around, and come back down to where it started.
Now the lifted air parcel has found
itself warmer and less dense than the surrounding air. It will
continue to float upward on its own. This indicates an unstable
situation. If you give the rock in the picture at right a push it
will move away from where it started (and not come back).
We need a little more information to be able to perform the test described above. First we need to know how quickly a rising parcel of air will cool.
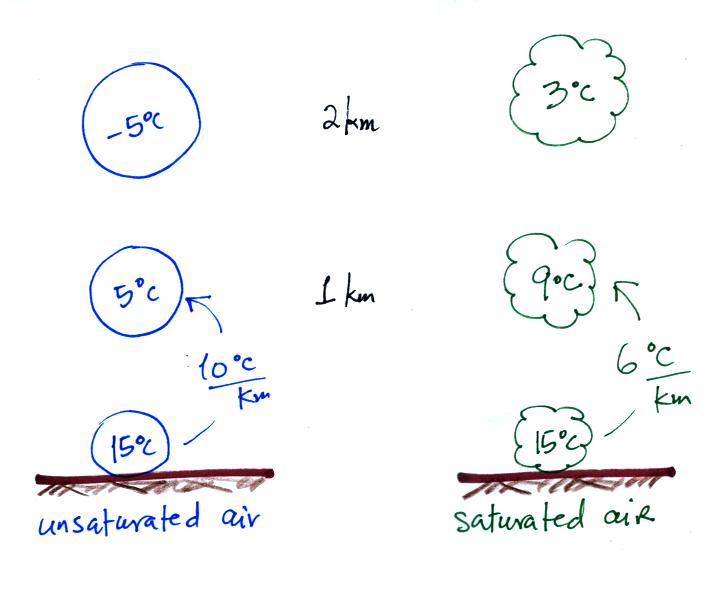
Unsaturated air (relative humidity less than 100%) always cools at
a
rate of 10o C/km. This is
known as the dry adiabatic lapse
rate. The term lapse rate just means rate of decrease with
increasing altitude, adiabatic means that heat is not being exchanged
between the air inside and outside the parcel.
Saturated air cools a little more slowly, we will use an average rate of 6o C/km (the moist adiabatic lapse rate). As saturated air rises, expands, and cools, condensation releases latent heat inside the parcel. The latent heat energy offsets and reduces the cooling due to expansion. There isn't enough latent heat energy to cause the rising parcel to warm.
We also need to know the temperature of the atmosphere at different altitudes above the ground.
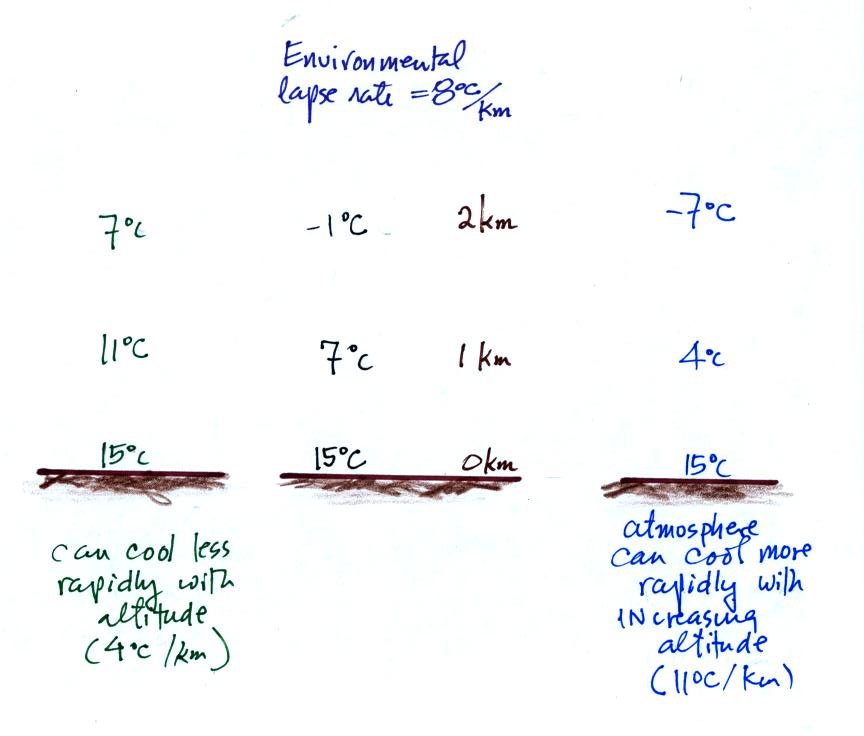
The atmosphere can do just about anything. The middle figure
shows temperature decreasing at a rate of 8o C/km (the environmental
lapse rate). The left and right examples show the air cooling
more slowly and more rapidly, respectively, with increasing altitude.
Usually atmospheric temperature doesn't decrease at a uniform rate as shown above. A more realistic example is shown below.
We need a little more information to be able to perform the test described above. First we need to know how quickly a rising parcel of air will cool.
Saturated air cools a little more slowly, we will use an average rate of 6o C/km (the moist adiabatic lapse rate). As saturated air rises, expands, and cools, condensation releases latent heat inside the parcel. The latent heat energy offsets and reduces the cooling due to expansion. There isn't enough latent heat energy to cause the rising parcel to warm.
We also need to know the temperature of the atmosphere at different altitudes above the ground.
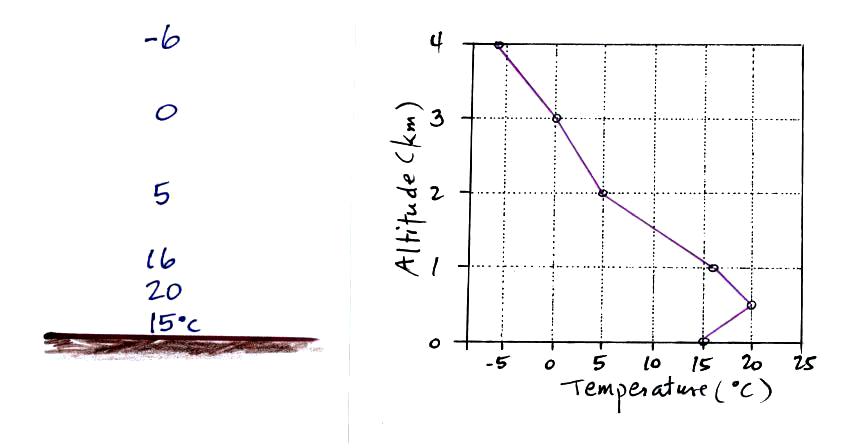
Usually atmospheric temperature doesn't decrease at a uniform rate as shown above. A more realistic example is shown below.
A plot of temperature versus
altitude is called a sounding.
We now have all the tools we need.
We now have all the tools we need.
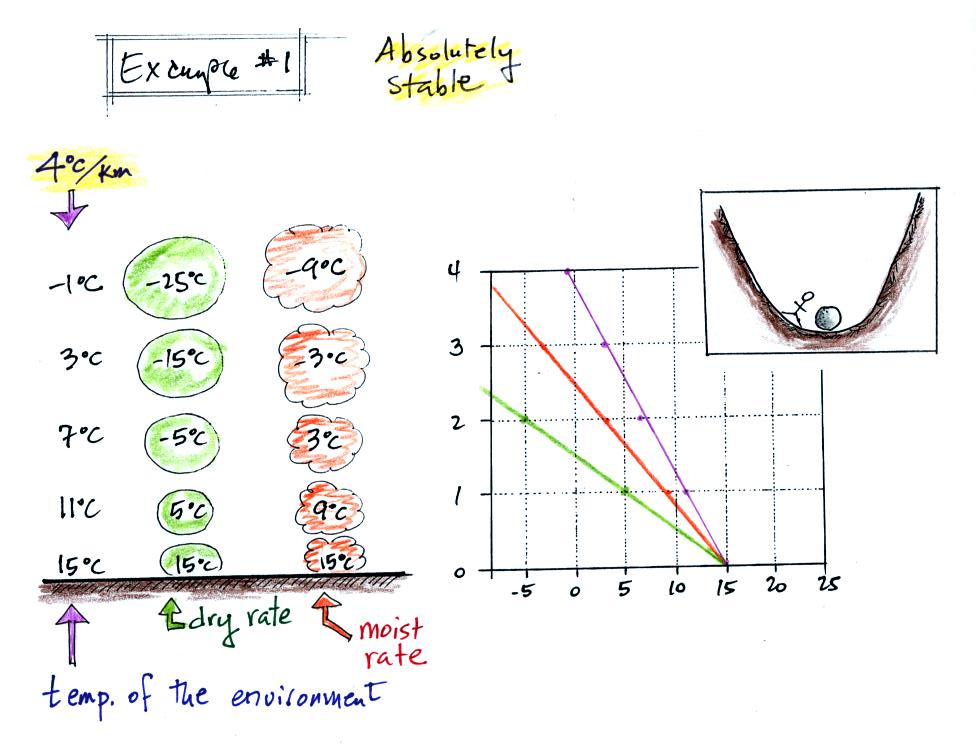
In this first example we assume the
environmental lapse rate is 4o C/km. This is the
left
column of figures in the figure above. The next two columns show
the temperature inside rising parcels of unsaturated (green) and
saturated (orange) air (they cool at 10o C/km and 6o C/km, respectively). The
environmental temperatures and the parcel temperatures are also plotted
on a graph on the right side of the figure.
The parcel curves (green and red) lie to the left of and below the purple, environment, curve. Rising parcels of unsaturated or saturated air will both end up colder and denser than the surrounding environmental air. If they are lifted and released, they will sink back to the ground. The atmosphere is absolutely stable in this situation.
We'll change the environmental lapse rate to 11o C/km in Example #2.

Now, because the atmosphere is cooling so quickly with increasing
altitude, lifted parcels of both unsaturated and saturated air
end up warmer and less dense than the surrounding air. Both the
orange and green curve lie above and to the right of the purple curve
on the graph. When released these parcels will continue to rise
on their own. The atmosphere is absolutely unstable in this case.
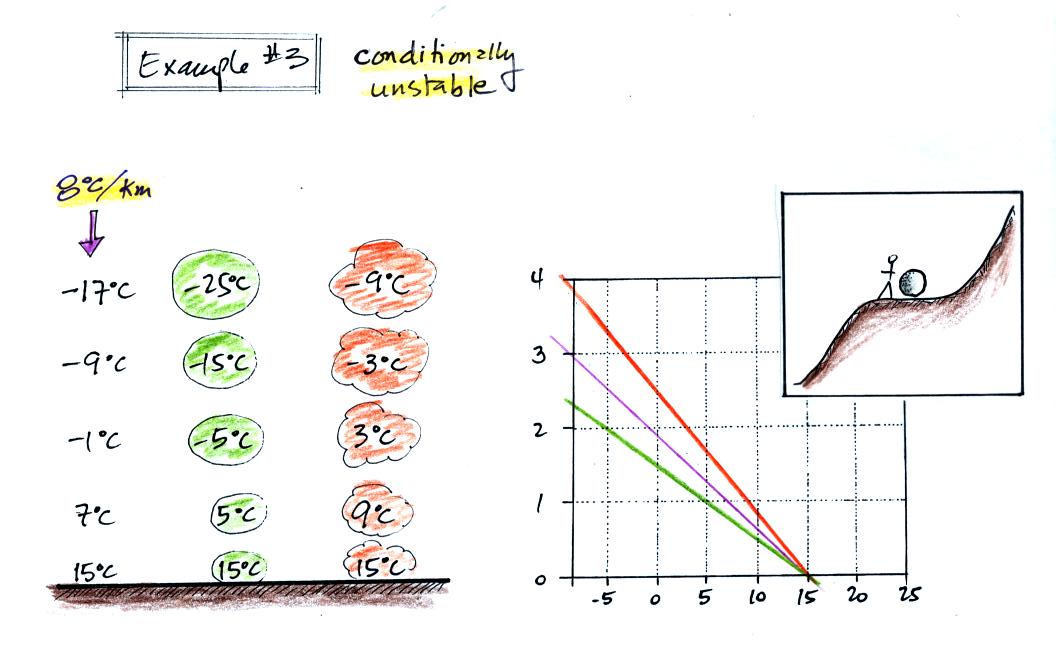
We'll pick an intermediate value, 8o C/km, for the environmental lapse rate in the next example.
The parcel curves (green and red) lie to the left of and below the purple, environment, curve. Rising parcels of unsaturated or saturated air will both end up colder and denser than the surrounding environmental air. If they are lifted and released, they will sink back to the ground. The atmosphere is absolutely stable in this situation.
We'll change the environmental lapse rate to 11o C/km in Example #2.
We'll pick an intermediate value, 8o C/km, for the environmental lapse rate in the next example.
The atmosphere is conditionally
unstable. A rising parcel of unsaturated air ends up cooler and
denser than the surroundings. A parcel of saturated air, which
cools at a slower rate, ends up warmer than the air around it.
The condition for instability is that the air must be saturated.
It was a little harder coming up with a rock/hill analogy in this
case. The rock is in either a stable or unstable position
depending on which direction you push it.
We'll won't change the environmental lapse rate the same for the last and most instructive example.
We'll won't change the environmental lapse rate the same for the last and most instructive example.
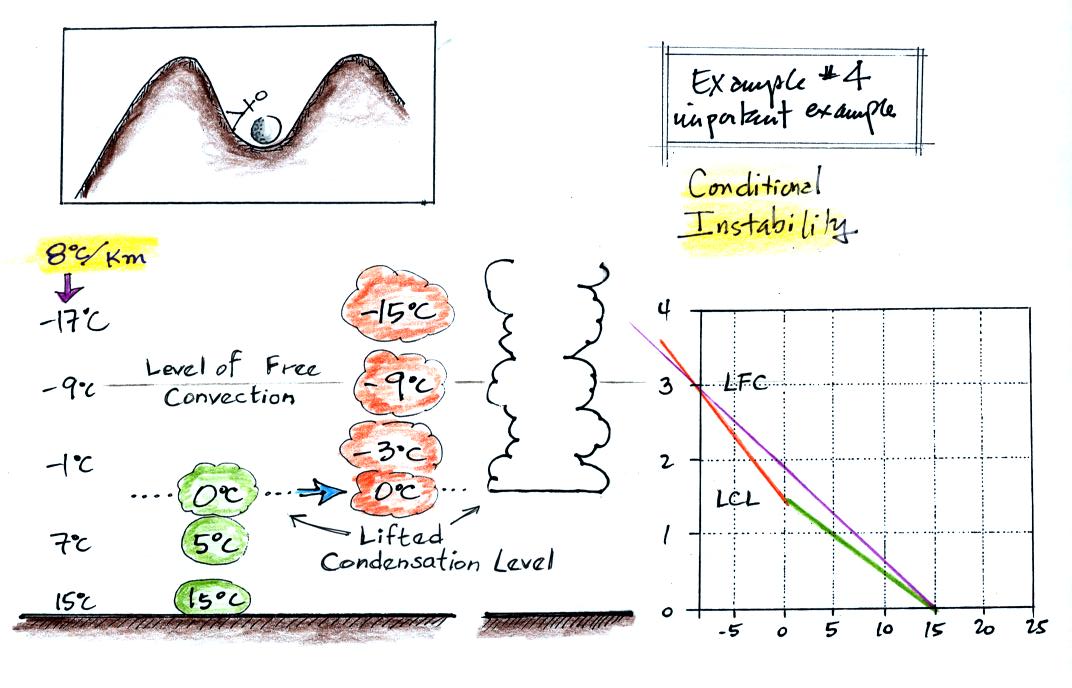
In this case the parcel of air
starts out unsaturated. It becomes saturated when lifted to 1.5
km altitude, once it has cooled to a temperature of 0o C. This is
called the Lifted Condensation Level (LCL) and you would see cloud
begin to form at this point. From that point on
upward the rising parcel will cool at the moist adiabatic rate.
Initially the rising parcel is colder and denser than the surrounding air. If the parcel is lifted to 3 km it has the same temperature as the air around it. If lifted above 3 km the parcel air finds itself warmer and less than the air outside. If lifted just a little bit beyond 3 km altitude the parcel will be able to continue to rise on its own. This dividing line between stable and unstable is called the Level of Free Convection (LFC).
The atmosphere is conditionally unstable in this case. A rising parcel must first of all become saturated. Then it must be lifted to and just above the level of free convection. The LFC can be higher or lower than 3 km. It depends on how quickly the atmosphere is cooling with increasing altitude and at what altitude the rising parcel becomes saturated.
The value of the environmental lapse rate is one of the main factors that determines whether the atmosphere will be stable or unstable.
| environmental
lapse
rate |
atmospheric
stability |
| less than
the MALR (eg. 4o C/km) |
absolutely
stable |
| between the
DALR & the MALR (eg. 8o C/km) |
conditionally
unstable |
| greater than
the DALR (eg. 11o C/km) |
absolutely
unstable |
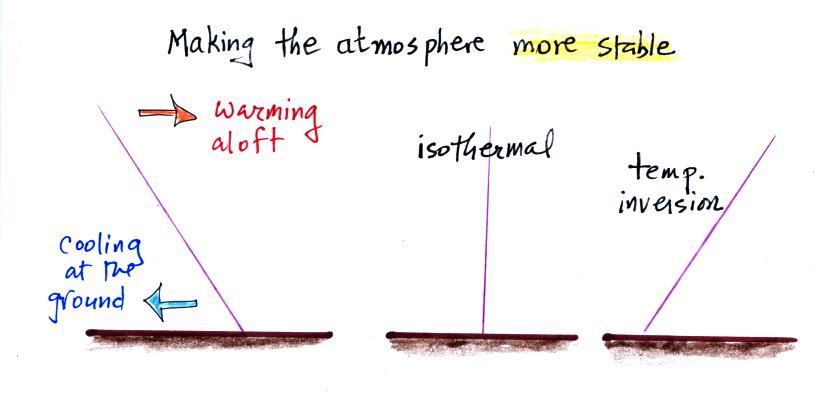
Warming the air above the ground
and/or cooling the air next to the ground will make the atmosphere more
stable. The ground and the air above it cool during the
night. The atmosphere is usually most stable early in the
morning.
A temperature inversion represents an extremely stable situation. Rising parcels always cool with increasing altitude (at either the dry or moist rate). In an inversion the surrounding air gets warmer and warmer with altitude. The difference between the cold parcel air and the warmer surroudings gets larger and larger with increasing altitude.
A temperature inversion represents an extremely stable situation. Rising parcels always cool with increasing altitude (at either the dry or moist rate). In an inversion the surrounding air gets warmer and warmer with altitude. The difference between the cold parcel air and the warmer surroudings gets larger and larger with increasing altitude.
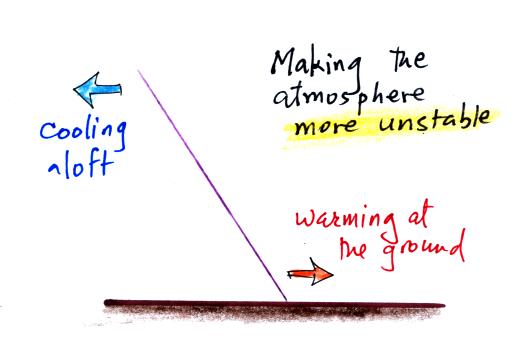
Sunlight warms the ground and the
air next to it during the day. This steepens the environmental
lapse rate and makes the atmosphere more unstable. Cooling air
above the ground has the same effect.
One last figure before we leave this topic. The figure shows the different types of clouds that form in stable and conditionally unstable conditions.
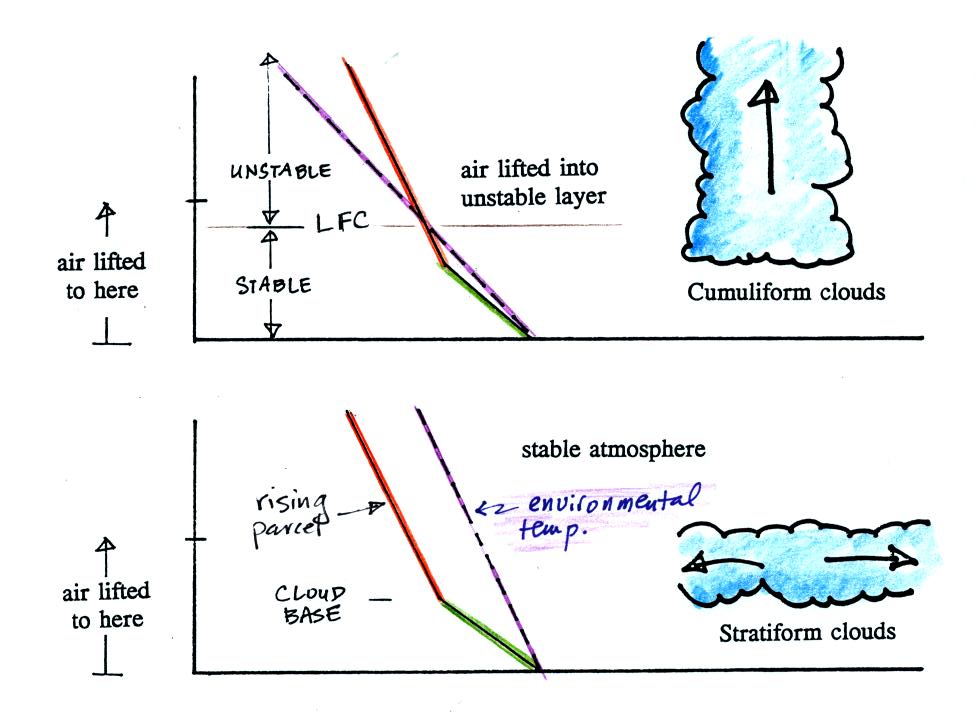
The violet curve shows the environmental temperatures as a function of altitude. The other curve shows the temperature of a rising parcel of moist air. The rising parcel starts out unsaturated and follows the green portion of the curve. Once it becomes saturated it begins cooling at the moist rate and follows the orange line.
The top figure shows a conditionally unstable situation. Because the parcel is lifted above the Level of Free Convection (LFC) it is able to continue rising on its own and develops into cumuliform cloud (perhaps a thunderstorm).
The air in the lifted parcel does become saturated but never becomes warmer than the surrounding air. The parcel won't go any higher than it is lifted. There isn't any Level of Free Convection in this case; stratiform clouds tend to form under these conditions.
One last figure before we leave this topic. The figure shows the different types of clouds that form in stable and conditionally unstable conditions.
The violet curve shows the environmental temperatures as a function of altitude. The other curve shows the temperature of a rising parcel of moist air. The rising parcel starts out unsaturated and follows the green portion of the curve. Once it becomes saturated it begins cooling at the moist rate and follows the orange line.
The top figure shows a conditionally unstable situation. Because the parcel is lifted above the Level of Free Convection (LFC) it is able to continue rising on its own and develops into cumuliform cloud (perhaps a thunderstorm).
The air in the lifted parcel does become saturated but never becomes warmer than the surrounding air. The parcel won't go any higher than it is lifted. There isn't any Level of Free Convection in this case; stratiform clouds tend to form under these conditions.