Carbon dioxide the greenhouse gas and its possible role in climate change.

This is the 1st of what will probably be a 4 part series on global warming and climate change.  Here we'll mostly just be concerned with carbon dioxide (CO2), the 5th most abundant gas in the atmosphere. 
CO2 and water vapor are probably the best known of the greenhouse gases.


Most everyone agrees that human activities are causing the atmospheric concentration of carbon dioxide to slowly increase.   We'll look at some of the experimental evidence in a moment.


Not everyone agrees however about the effect(s) that increasing amounts of CO2  will have on the earth's energy budget and climate.  The chief concern is that increasing greenhouse gas concentrations will strengthen the greenhouse effect and will cause the earth's surface to warm.

It is important to remember that the greenhouse effect isn't all bad, it has a beneficial side.   You might refer to this as the natural greenhouse effect (i.e. one that has not been affected or influenced by human activities)


If the earth's atmosphere did not contain any greenhouse gases, the global annual average surface temperature would be about 0o F.  That's pretty cold and that's the average, there would be many locations on the earth much colder than that.  The presence of greenhouse gases raises this average temperature to about 60o F and makes the earth a much more habitable place.  So some warming is a good thing.


Increasing atmospheric greenhouse gas concentrations might cause some additional warming (and we rely on computer models to predict or estimate how much warming there will be).  This might not sound like a bad thing.  However even a small change in average temperature might melt polar ice and cause a rise in sea level which, at the very least,  would pose an environmental threat to coastal areas.  Warming might change weather patterns and bring more precipitation to some areas and prolonged drought to other places (like Arizona).  Serious tropical diseases (such as malaria and dengue fever) might spread into areas where they're not currently found.  Plant and animal species might be forced to migrate in order to find a suitable environment; some might not be able to adapt quickly enough and could go extinct.

We will save much of that discussion of the effects of global warming for later in the semester, here we will just concentrate on carbon dioxide.


Let's first look at some of the experimental data that show atmospheric carbon dioxide concentration is increasing.

This is a sketch of the "Keeling" curve.  It shows measurements of CO2 that were begun (by a graduate student named Charles Keeling) in 1958 on top of the Mauna Loa volcano in Hawaii (the air there is "clean" and not affected by nearby cities and other sources of pollutants).  Carbon dioxide concentration was about 315 ppm when the measurements began and just reached 400 ppm earlier this year (the figure above is a little out of date).  The small wiggles (one wiggle per year) show that CO2 concentration changes slightly during the course of a year (it also changes slightly during the course of a day). 

You can find the latest measured
atmospheric CO2 concentration at Mauna Loa Observatory at an interesting, interactive site maintained by the Scripps Institution of Oceanography (click on the "full record" box at the bottom of the graph to see the complete Keeling record). 


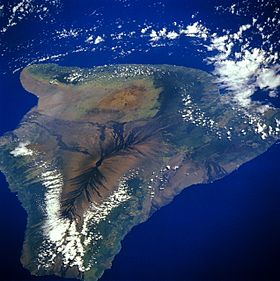
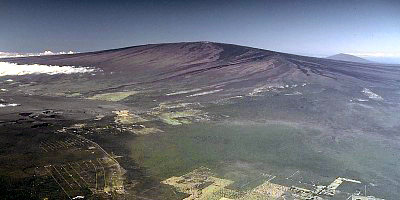
The summit of Mauna Loa is the dark area
to the left of center
on this image of the "big island" of Hawaii.

(source of this image)


A sideview of the Mauna Loa volcano
(source of this image)


Once scientists saw Keeling's data they began to wonder about how CO2 concentrations might have been changing prior to 1958.  But how could you now, in 2014 say, go back and measure the amount of CO2 in the atmosphere in the past?  Scientists have found a very clever way of doing just that.  It involves coring (drilling) down into ice sheets that have been building up in Antarctica and Greenland for hundreds of thousands of years.


As layers of snow are piled on top of each other year after year, the snow at the bottom is compressed and eventually turns into a thin layer of solid ice.  The ice contains small bubbles of air trapped in the snow, samples of the atmosphere at the time the snow originally fell.  Scientists are able to date the ice layers and then take the air out of these bubbles and measure the carbon dioxide concentration.  This can't be very easy, the layers are very thin, the bubbles are small and it is hard to avoid contamination.


(source of this image)

Using the ice core measurements scientists have determined that atmospheric CO2 concentration was fairly constant at about 280 ppm between 0 AD and the mid-1700s when it started to increase.  The start of rising CO2 coincides with the beginning of the "Industrial Revolution."  Combustion of fossil fuels needed to power factories began to add significant amounts of CO2 to the atmosphere. 


You can see a more accurately drawn version of this graph by going back to the Scripps Institute of Oceanography site and clicking on the "1700 - present" box.  You can see an 800,000 year long record of atmospheric CO2 concentration (from Antarctic ice cores) by clicking on the "800,000 years" box.  The increase, underway since the mid 1700s, is the largest and most rapid change in the ice core record.


This figure with data from Climate Change 2007, IPCC 4th Assessment Report, shows that concentrations of two other greenhouse gases, methane and nitrous oxide, have been increasing in much the same way that CO2 has.

In order to better understand why atmospheric carbon dioxide concentration is increasing, and before we look at what the earth's temperature has been doing during this period, we need to know how carbon dioxide is added to and removed from the atmosphere.


Carbon dioxide is added to the atmosphere naturally by respiration (animals breathe in oxygen and exhale carbon dioxide), decay, and volcanoes. 

Combustion of fossil fuels, a human activity also adds CO2 to the atmosphere.  Cutting down and killing a tree, deforestation, will keep it from removing CO2 from the air by photosynthesis.  The dead tree will also decay and release CO2 to the air.

CO2 is removed from the atmosphere by photosynthesis (the equation is shown above).  CO2 also dissolves in the oceans.

The ? means I'm not not aware of an anthropogenic process that removes significant amounts of carbon dioxide from the air.
  Carbon sequestration (the capture/removal of
CO2 from the air and storage) is something that is being considered to lessen or prevent global warming.

We are now able to better understand the yearly variation in atmospheric CO2 concentration (the "wiggles" on the Keeling Curve) and can figure out when the highest and lowest CO2 concentrations should occur.


We will assume that the release of CO2 to the air remains constant throughout the year (the straight brown line below).  The rate that CO2 is removed from the air by photosynthesis (the green curve) will change.  Photosynthesis is highest in the summer when plants are growing actively.  It is lowest in the winter when many plants are dead or dormant. 


Atmospheric
CO2  concentration will decrease as long as the rate of removal (photosynthesis) is greater than the rate of release (blue shaded portion above).  The minimum occurs at the right end of the blue shaded portion where the removal and release curves cross.

Once the curves cross and the green photosynthesis curve drops below the brown curve (rate of release), more
CO2  is being released than removed and the CO2  concentration will start to increase.  The highest CO2 concentration occurs once winter is over and the rate of photosynthesis increases and again becomes equal to the rate of release.  A bank account behaves in the same kind of way.   Assume you are depositing money into the account at a steady rate but spending varies during the year.  The account balance will rise and fall depending on whether spending is greater or less than the amount being deposited.


We need to take this a step further and look at the actual amounts of CO2 being added to and being removed from the atmosphere.  A simplified version of the carbon cycle is shown below. 


This figure shows the movement of carbon into and out of the atmosphere.

Here are the main points to take from this figure:

1.   
The underlined numbers show the amount of carbon stored in "reservoirs."  For example 760 units* of carbon are stored in the atmosphere (predominantly in the form of CO2, but also in small amounts of CH4 (methane), CFCs and other gases; anything that contains carbon).  Note that the atmosphere is a fairly small reservoir.

    The other numbers show "fluxes," the amount of carbon moving into or out of the atmosphere.  Over land, respiration and decay add 120 units* of carbon to the atmosphere every year.  Photosynthesis (primarily) removes 120 units every year.

2.    Note the natural processes (color coded blue and green) are pretty much in balance (over land: 120 units added to the atmosphere and 120 units removed, over the oceans: 90 units added balanced by 90 units of carbon removed from the atmosphere every year). If these were the only processes present, the atmospheric concentration (760 units) wouldn't change.

3.   
Anthropogenic (man caused) emissions of carbon into the air are small compared to natural processes (orange in the figure).  About 6.4 units are added during combustion of fossil fuels (and during the manufacture of cement) and 1.6 units are added every year because of deforestation.

The rate at which carbon is added to the atmosphere by man is not balanced by an equal rate of removal: about half (4.6 of the 8) units added every year are removed (highlighted in yellow in the figure). 

This small imbalance (8 - 4.6 = 3.6 units of carbon are added to the atmosphere every year) explains why atmospheric carbon dioxide concentrations are increasing with time.
  Note also that more carbon dioxide is added to the oceans every year than is removed.  Addition of CO2 to the oceans might increase the acidity of the ocean water which might might make it more difficult for coral and sea shells to form (shells and coral are made of calcium carbonate CaCO3).

4.   
In the next 100 years or so, the 7500 units or so of carbon stored in the fossil fuels reservoir (lower left hand corner of the figure) might be dug up or pumped out of the ground and burned.  That would add 7500 units of carbon to the air.  The big question is how will the atmospheric concentration change and what effects will that have on climate?  Carbon dioxide can move into and out of the atmosphere fairly quickly, movement into and out of some of the other reservoirs is slow.  Thus it is difficult to say precisely how and how quickly the picture will change when it is perturbed.

*Here are the units just in case you are interested:
  Reservoirs - Gtons
  Fluxes - Gtons/year
  A Gton = 1 giga ton = 1012 metric tons. (1 metric ton is 1000 kilograms or about 2200 pounds)


So here's where we're at.
Atmospheric CO2 concentration was fairly constant between 0 AD and the mid 1700s.
CO2 concentration has been increasing since the mid 1700s.
The obvious question is what has the temperature of the earth been doing during this period? In particular has there been any warming associated with the increases in greenhouse gases that have occurred since the mid 1700s?  The answer to that question will be the subject of the next part in this series.


CO2 poisoning. Is CO2 a pollutant?
Before we leave this topic a little more information about carbon dioxide.  Up to this point we've been interested in CO2 because of its role in the atmospheric greenhouse effect.  I generally don't consider CO2 to be an air pollutant because the atmospheric concentration is small and it's not a toxic gas.  Under certain circumstances however CO2 can build to unhealthy even deadly levels (it kills mainly because your body is starved of oxygen).

Here is a brief summary of the physiological conditions that can occur because of exposure to elevated CO2 levels (adapted from
http://en.wikipedia.org/wiki/Carbon_dioxide).  For comparison, keep in mind the atmospheric concentration of carbon dioxide is about 400 ppm (0.04%).

 concentration
physiological symptoms
1% (10,000 ppm)
some people start to experience drowsiness.
2%
mildly narcotic, increases blood pressure and pulse rate, and decreases hearing
5%
shortness of breath, dizziness, confusion, anxiety, headache
8%
dimmed sight, sweating, muscular tremors, loss of consciousness after 5 to 10 minutes exposure

The Occupational Health and Safety Administration (OSHA) has set a permissible 8 hour working day exposure limit of 5000 ppm (0.5 %).  CO2 concentration is sometimes measured/monitored in work areas to insure that ventilation systems are adequate and working properly.

Submarines (and spacecraft) are one place where carbon dioxide levels could potentially build to dangerous levels and scrubbers are used to remove CO2 from the air and keep CO2 levels within acceptable levels (generally less than 8000 ppm) You may remember that one of the problems faced by the Apollo 13 crew was jury rigging a scrubber to keep the carbon dioxide inside their spacecraft within acceptable levels.

Carbon dioxide poisoning ("blackdamp") is one of several hazards that miners face when working underground.  And this is, as best I can tell, the reason miners used to carry a caged canary into the mine with them. Birds are more sensitive to carbon dioxide than humans and the canary would stop singing and fall off its perch if CO2 levels were too high. Carbon dioxide is involved in a rare type of natural disaster called a lake overturn or limnic eruption.  What happens here is that cold water at the bottom of a lake containing dissolved CO2 is suddenly forced to the lake surface and releases its CO2.  Carbon dioxide is heavier than air and is odorless. People and animals near the lake maybe unaware of the release and buildup of CO2 and can suffocate.  According the Wikipedia article cited above, events like this have apparently only been observed twice: in Cameroon at Lake Monoun in 1984 (causing the death of 37 people living nearby) and in 1986 at nearby Lake Nyos where around 1200 people were killed.

Finally brief mention of a recent archaeological discovery: Pluto's Gate to Hell (the god of the underworld was named Pluto by the Romans and Hades by the Greeks).  Pluto's Gate was considered in classical times to be the entrance to the underworld (one of many perhaps) and was discovered in 2013 by Italian archaeologists at the ancient city of Hierapolis in southwestern Turkey. 


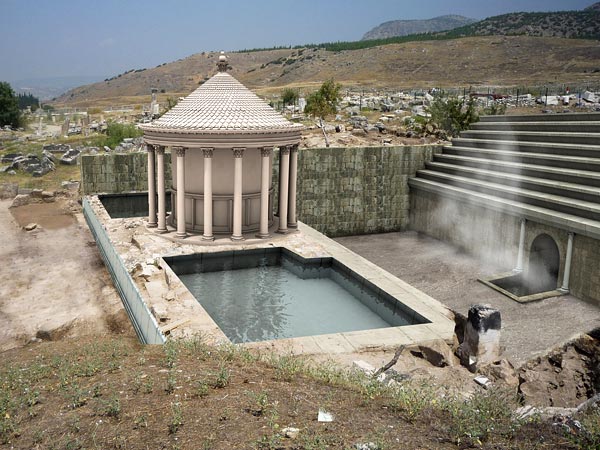
The site as it appears now (source of this photograph)
The site as it might have appeared in ancient times.  This photograph, credited to Francesco D'Andria, the Italian archaeologist that announced the discovery in March, 2013, is found in a news report from the National Geographic Society.

The "gate" was built on top of a cavern and, in ancient times, a mist of deadly vapors could be seen coming from the cave.  Here's a quote from the Slate article where I first read about the discovery: "Two millennia ago, visitors to Pluto's Gate could buy small birds or other animals (the sale of which supported the temple) and test out the toxic air that blew out of the mysterious cavern.  Only the priests, high and hallucinating on the fumes, could stand on the steps by the opening to hell.  They would sometimes lead sacrificial bulls inside, later pulling out their dead bodies in front of an awed crowd.

As the Greek geographer, philosopher, and prolific traveler Strabo, who lived from 64/63 B.C. to 24 A.D., so enticingly described it: 'This space is full of a vapor so misty and dense that one can scarcely see the ground.  Any animal that passes inside meets instant death.  I threw in sparrows and they immediately breathed their last and fell.'  Can you guess what deadly gas might be escaping from Pluto's Gate (scroll down a little ways and you'll find the answer).


Carbon dioxide.