Friday August 30, 2019
We'll be using use page 7, page 105, page 106, page 11, and page 12 from the ClassNotes today.
You might also want to download and print out a Environmental
and Physiological Causes of Death handout that is not in the
Class Notes.
Air Pollution
Air Pollution is a serious health hazard in the US and around
the globe (click here
to download a copy of the information below including references).
The lists below try to give you some idea of how serious a
threat it is.
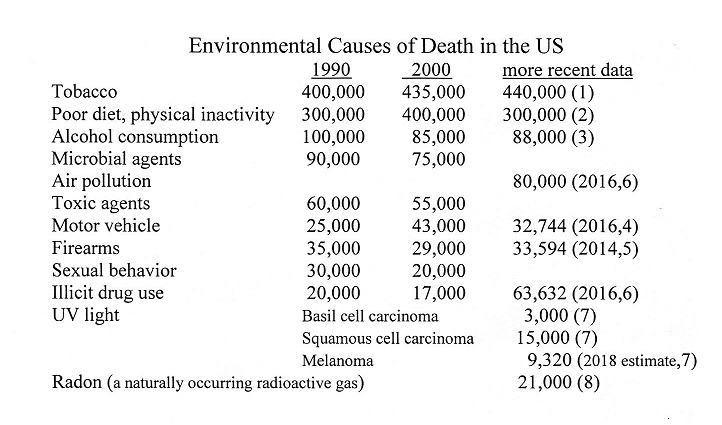
The list above shows the external or
environmental agent that causes death. Of interest are
the 80,000 deaths thought to be due to air pollution.
More than half are probably due to exposure to particulate
matter, something we will examine soon. This year I
added an estimate of deaths due to skin cancer caused by
exposure to ultraviolet (UV) light and deaths due to lung
cancer caused by long term exposure to radioactive radon gas.
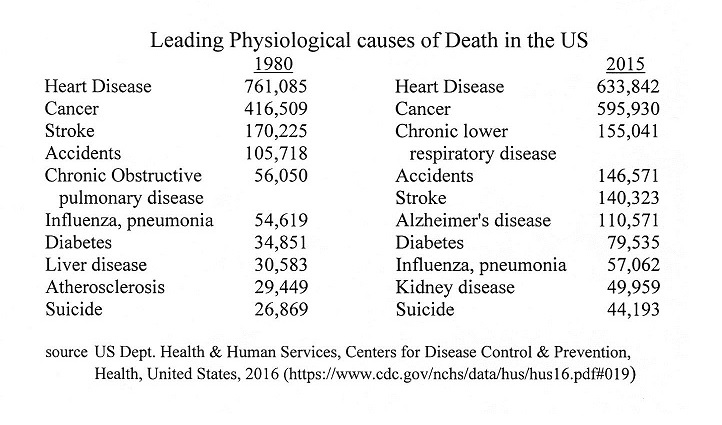
The second list, below, is the physiological or internal
bodily function that ultimately leads to your demise.
Keep in mind that many of these numbers are difficult to
measure and some may contain a great deal of uncertainty.
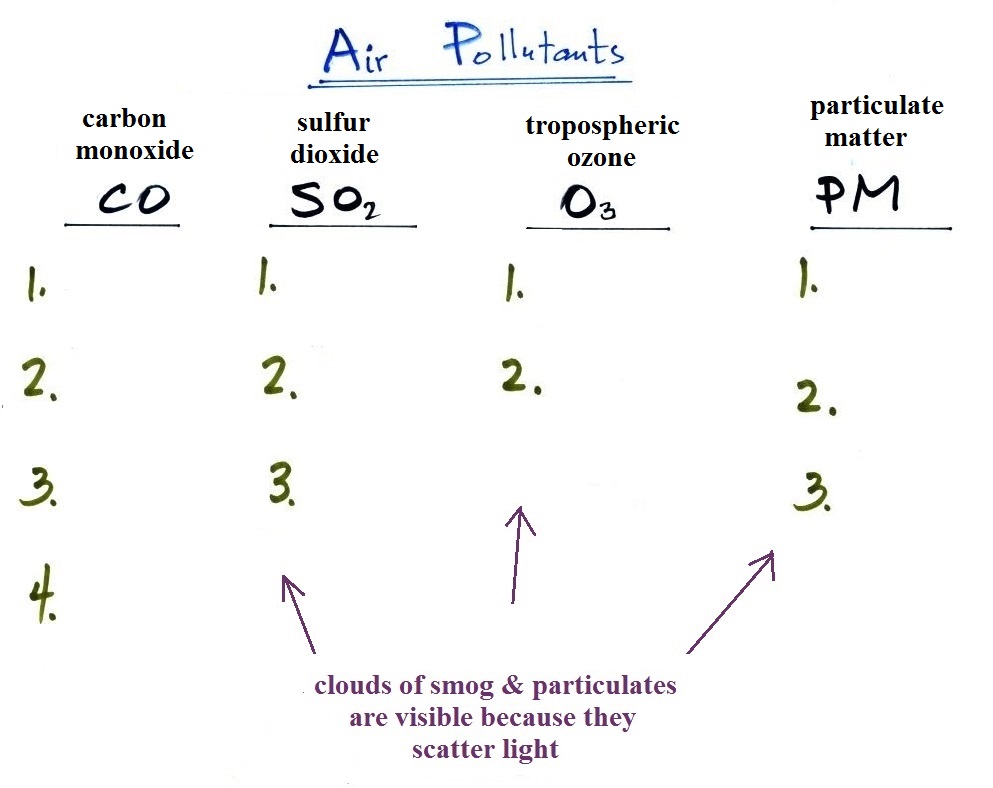
We will be looking at four air pollutants this week
and next. They're listed below together with an idea of the
number of main points you should try to remember and understand
about each.
Today's class will feature a light scattering
demonstration. It's a fairly simple concept and explains
how/why we are able to see things like smog, clouds, and
particulate matter in the air.
Carbon Monoxide (CO)
We'll start our section on air
pollutants with carbon monoxide. You'll find
additional information on carbon monoxide and other air
pollutants at the Pima
County Department of Environmental Quality website
and also at the US
Environmental Protection Agency website.
The material above is from page
7 in the ClassNotes. We will mostly be talking about
carbon monoxide found outdoors, where it would only rarely reach
fatal concentrations. CO is a serious hazard indoors also
where it can (and does) build up to deadly concentrations (several
people
were
almost
killed
in
Tucson
in
December 2010 for example).
Carbon
monoxide from a malfunctioning heating system is also suspected
to have caused the deaths of four people spending the recent
holidays in a cabin near Flagstaff (more
information). Between 1999 and 2010 an average
of 430 people were killed per year in the US from unintentional,
non-fire-related carbon monoxide poisoning according to the
Centers for Disease Control and Prevention (ref).
Carbon monoxide is insidious, you can't smell it or see it
and it can kill you (Point 1).
Once
inhaled,
carbon
monoxide
molecules
bond
strongly
to
the
hemoglobin
molecules
in
blood
and
interfere
with
the
transport
of
oxygen
throughout
your
body.
The
article about carbon monoxide poisoning in Tucson mentions that
the victims were put inside a hyperbaric (high pressure) chamber
filled with pure oxygen. This must force oxygen into the
blood and displace the carbon monoxide molecules.
CO is a primary pollutant. That means it goes directly
from a source into the air, CO is emitted
directly from an automobile tailpipe into the atmosphere for
example. The difference
between primary and secondary pollutants is probably
explained best in a series of pictures.
The distinction between primary and
secondary pollutants is a relatively minor point.
In addition to carbon monoxide, nitric oxide (NO) and sulfur
dioxide (SO2), are also
primary pollutants. They all travel directly from a source
(automobile tailpipe or factory chimney) into the
atmosphere. Ozone is a secondary pollutant (and here we mean
tropospheric ozone, not stratospheric ozone). It wouldn't be
present in the exhaust coming out of a car's tailpipe. It
shows up in the atmosphere only after a primary pollutant has
undergone a series of reactions with other chemical compounds in
the air.
Point 2 explains that CO is produced by incomplete
combustion of fossil fuel. Basically there isn't enough
oxygen. More oxygen and complete combustion would produce
carbon dioxide, CO2.
Because cars and trucks produce much of the
CO in the atmosphere in Tucson, special
formulations of gasoline (oxygenated fuels) are used during the
winter months in Tucson to try to reduce CO emissions. The
added ingredient, ethanol, has the effect of adding more oxygen to
the combustion process.
Vehicles are also fitted with a catalytic converter that
will change CO into CO2 (and
also NO into N2 and O2 and hydrocarbons into H2O and CO2).
In Pima County, vehicles must also pass an emissions test every
year to insure that the car is burning fuel as cleanly as possible
(a stressful time for me and my older automobile).
Flames resulting from the combustion of natural gas (methane)
in a Bunsen burner are shown below. The air intake is
completely closed in the picture at left. There
isn't enough oxygen in this case and the flame is yellow.
This is incomplete combustion and will produce more carbon
monoxide and also a lot of black soot (carbon). The intake
is partially opened in Picture 2, opened a little more in Picture
3 and completely open in Picture 4. The blue flame in
Picture 4 results from complete combustion. The flames on a
gas stove or the pilot light in a hot water heat or a furnace
should have this blue color. (source of the photo: https://commons.wikimedia.org/wiki/File:Bunsen_burner_flame_types.jpg)
Dirty (incomplete) at left and clean
(complete) combustion of natural gas at right.
In the atmosphere CO concentrations peak on winter mornings (Point 3). The reason for
this is surface radiation inversion layers. They are most
likely to form on cold winter mornings.
When we say inversion layer (Point 4), we mean a temperature inversion, a
situation where air temperature increases with increasing
altitude. That's just the opposite of what we are used to
(you would expect it to be colder at the summit of Mt. Lemmon than
here in the Tucson valley). This produces stable atmospheric
conditions which means there is little up or down air motion.
The lack of vertical air motions means there is very
little vertical mixing in a stable air layer.
In the left figure above, notice how temperature increases
from 40 F to 50 F in the thin air layer next to the ground.
That's the inversion layer. Temperature then begins to
decrease as you move further up. That's what we normally
see. When CO is emitted into the thin stable layer during
the morning rush hour, the CO remains in the layer and doesn't mix
with cleaner air above. CO concentrations build.
Later in the day the ground and air in contact with the ground
warms. The inversion disappears and air at the ground mixes
with cleaner air above. The evening rush hour adds CO to the
air but it is mixed in a larger volume of air and the
concentration doesn't get as high.
Thunderstorms like you have been seeing this time of year
contain strong up and down air motions. Thunderstorms are an
indication of unstable atmospheric conditions.
Scattering (splattering) of light
You are able to see a lot of things in the atmosphere (clouds,
fog, haze, even the blue sky) because of scattering of
light. We'll try to make a cloud of smog in class later this
week. The individual droplets making up the smog cloud are
too small to be seen by the naked eye. But you will be able
to see that they're there because the droplets scatter
light. That's true also of the little water droplets that
make up a cloud. So we need to take some time for a
demonstration that will hopefully explain what light scattering
is.
In the first part of the demonstration a narrow beam of intense
red laser light was directed from one side of the classroom to the
other.
The following 3 figures are on
page 105 in the ClassNotes.
The red laser
that I used to use quit working last fall. The
demonstration now uses violet, green, and red laser pointers.
We're looking down from
above in the the figure above. Neither the
students or the instructor could see the beam of light.
To see the laser light some of it would need to be traveling
toward you rather than from one side of the room to the other.

The instructor would have been able to see
the beam if he had stood at the end of the beam of laser light
where it hit the wall and looked back along the beam of light
toward the laser. The insert at upper right shows what
the instructor would see, a bright spot of light originating
at the end of the laser tube itself. That wouldn't have
been a smart thing to do, though, because the beam was strong
enough to possibly damage his eyes (there's a
warning on the side of the laser).
Most everyone was able to see a bright red spot where the laser
beam struck the wall.
This is because when the intense beam
of laser light hits the wall it is scattered (I think
splattered is a more descriptive term). The
original beam is broken up into a multitude of weaker
rays of light that are sent out in all directions.
There is a ray of light sent in the direction of every
student in the class. They see the red spot of
light because they are looking back in the direction the
ray came from. It is safe to look at this
light because the original intense beam is split up into
many much weaker beams.
Next we clapped two erasers together so that some
small particles of chalk dust fell into the laser
beam.
The next 2 figures are on page
106 in the ClassNotes.

Now instead of a single spot on the wall, students saws lots of
points of light coming from different positions along a straight
segment of the laser beam. Each of these points of light was
a particle of chalk, and each piece of chalk dust was intercepting
laser light and sending light out in all directions. Each
student saw a ray of light coming from each of the chalk
particles. With a cloud of chalk dust you are able to see
segments of the laser beam.
We use chalk because it is white, it will scatter rather than
absorb visible light. What would you have seen if black
particles of soot had been dropped into the laser beam?
In the last part of the demonstration we made a cloud by pouring
some liquid nitrogen into a cup of water. The cloud droplets
are much smaller than the chalk particles but are much more
numerous. They make very good scatterers.

The beam of laser light was very bright as
it passed through the small patches of cloud. The cloud
droplets did a very good job of scattering laser light.
So much light was scattered that the spot on the wall
fluctuated in intensity (the spot dimmed when lots of light
was being scattered, and brightened when not as much light was
scattered). Again the insert shows what you would see if
you stood at the wall and looked back toward the laser.
Some of the light passes through the cloud so you would still
be a spot of red light, but it would be weaker and more
diffuse. Then you would see red scattered light coming
from the cloud surrounding the beam of laser light.
Here's a side view photo that I took back in my office.
The laser beam is visible in the left 2/3 rds of the picture
because it is passing through cloud and light is being scattered
toward the camera. There wasn't any cloud on the right 1/3rd
of the picture so you can't see the laser beam in that part of the
photograph.
The air molecules in the room are actually scattering laser light
but it's much too weak for us to be able to see it. When a
stronger light source (sunlight) shines through much more air (the
entire atmosphere) we are able to see the scattered light.
The blue light that you see when you look at sky is sunlight being
scattered by air molecules. This will probably be the topic
of another 1S1P assignment.
A quick summary of the key points concerning carbon
monoxide. We'll cover sulfur dioxide and tropospheric ozone
today.
The yellow star next to temperature inversions means it's a
pretty important concept and well worth trying to remember.
Sulfur dioxide (SO2
)
We'll turn now to another of the air
pollutants, sulfur
dioxide
(SO2 ).
See page 11
in the ClassNotes.
Sulfur dioxide is produced by the combustion of sulfur
containing fuels such as coal. Combustion of fuel also
produces carbon dioxide and carbon monoxide. People probably
first became aware of sulfur dioxide because it has an unpleasant
smell (one of the smells in a freshly struck match). Carbon
dioxide and carbon monoxide are odorless. That is most
likely why sulfur dioxide was the first pollutant people became
aware of.
Volcanoes are a natural source of sulfur dioxide.
US NAAQS in the figure above stands for United States National
Ambient Air Quality Standards. Air with a
pollutant concentration that exceeds the NAAQS is considered
unhealthy. This is discussed further in an online Supplementary Reading
section.
London-type smog

The inversion layer in this case lasted for several days and was
produced in a different way than the surface radiation
inversions we heard about when covering carbon monoxide.
Surface radiation inversions usually only last for a few hours.
The term smog, a contraction of smoke + fog, was invented to
describe a mixture of smoke and fog, something that was fairly
common in the winter in London. The 1952 event was an
extreme case. Now we distinguish between "London-type
smog" which contains sulfur dioxide and photochemical or "Los
Angeles-type smog" which contains ozone.
Most of the photographs below come
from
articles published in 2002 and 2012, the
50th
and 60th anniversaries of the event.
The dramatic drops in visibility are mostly being caused by
fog. Later in the semester we will learn that fog clouds
that form in "dirty" containing certain types of smoke particles
can be thicker than fog that forms in cleaner air.
The caption to this
photo
from The Guardian reads
"Arsenal goalkeeper Jack Kelsey peers into the
fog.
The 'smog' was so thick the game was eventually
stopped."
|

The smog in this photo is the thickest I was able to
find. Visibility here is perhaps 10 or 20 feet.
(source
of this image)
|
|
|
|
Smog masks from this
reference
The masks would filter out the smoke but not the
sulfur dioxide gas
|
Even though it is a little off topic, here are
some interesting photographs
of
early and mid 20th century London.
The sulfur dioxide didn't
kill people directly. Rather it
would aggravate an existing condition of some
kind. The SO2 probably also
made people susceptible to bacterial infections
such as pneumonia. Here's a link
to
a Power Point presentation that
discusses
the event and its health effects in more detail.
The Clean
Air
Act of 1956 in England reduced smoke pollution
and emissions of sulfur dioxide.
Air
pollution
disasters involving sulfur dioxide have also occurred in the
US. One of the deadliest events was in 1948 in Donora,
Pennsylvania.
The reference
material that contained this photographed stated
"This eerie photograph was taken at noon on
Oct. 29, 1948 in Donora, PA as deadly smog enveloped the
town. 20 people were asphyxiated and more than 7,000
became seriously ill during this horrible event."
The photograph below shows some of the mills that were operating
in Donora at the time. Not only where the factories adding
pollutants to the air they were undoubtedly adding hazardous
chemicals to the water in the nearby river.
source
of this photo
The Cuyahoga River that runs through
Cleveland was so polluted that it used to frequently catch
fire (see https://time.com/3921976/cuyahoga-fire/).
It
has been 50 years since the last fire and the river has
been cleaned up and restored (see https://www.nytimes.com/2019/06/07/travel/cleveland-cuyahoga-river-pollution.html).
The US passed its own
Clean Air Act in 1963. There have been several
major revisions since then. The EPA began
in late 1970 (following an executive order signed by President
Nixon)
"When
Smoke
Ran Like Water" a book about air pollution
is one of the books that you can check out,
read, and report on to replace the Experiment
Report writing requirement in this class (though
I would encourage you to do an experiment
instead). The author, Devra Davis, lived
in Donora Pennsylvania at the time of the 1948
air pollution episode.
Acid rain
Sulfur
dioxide
is one of the pollutants that can react with water
in clouds to form acid rain (some of the oxides of
nitrogen can also react with water to form nitric
acid). The formation and effects of acid rain
are discussed on page
12 in the photocopied Class Notes.
Acid rain is often a problem in regions that
are 100s even 1000s of miles from the source of the sulfur
dioxide. Acid rain in Canada could come from sources in
the US, acid rain in Scandinavia came from industrialized areas
in other parts of Europe.
Note at the bottom of the figure above that natural
"pristine" rain is slightly acidic with pH 5.6. This is
because the rain contains dissolved carbon dioxide gas.
Acid rain has a pH less than 5.6.
Some of the problems associated with acid rain
are listed above.

|

|
Trees in the Jizera Mountains
(Czech Republic) killed by the effects of acid rain
(source: https://en.wikipedia.org/wiki/Acid_rain)
|
Acid rain damage to the
Ulysses S. Grant Memorial in Washington, D.C. The
sculpture is made of bronze, a mixture of copper and
tin. Copper is dissolved by acid rain and produces
the green stains on the marble base.
(source: https://www.nps.gov/nama/blogs/acid-rains-slow-dissolve.htm)
|

|

|
A chimera
(left, photo source)
and a strix
(right, photo credit: Jawed Karim, photo source)
on Notre Dame Cathedral in Paris. The rounded edges,
grainy texture, and pitting are all characteristic of
damage caused by acid rain. You'll find many more
photographs of Notre Dame gargoyles here.
|
We can fill in another column in our air pollutants chart: