Thursday Oct. 10, 2019
Imad Fares "Gipsy Kings
Cover" (5:30), Lindsay El "Shut Me Up"
(6:10), Tash Sultana "Jungle"
(~7:15)
We'll be using page 61
(again), page 63, page 64, page 65, page 66 and page 67 today. It's
possible that we may also use page
70a.
There are several students that signed up for Experiment #2 that never picked up
materials (because we ran out). I now have about 12 sets
of materials available. If you pick up materials today
(or next week), you can have until Tue., Oct. 29 to turn in a
report.
The In-class Optional Assignment from Tuesday this week has
been graded and was returned in class today. Answers
to questions on that assignment are now available.
A new
In-class Optional Assignment was handed out in class
today. If you weren't in class and want to download the
assignment and turn in your answers at the start of lcass next
Tuesday you will receive at least partial credit.
A preliminary version of the Quiz #2 Study Guide is now
available. Quiz #2 is Thursday next week (Oct. 17)
We'll quickly review a couple of figures
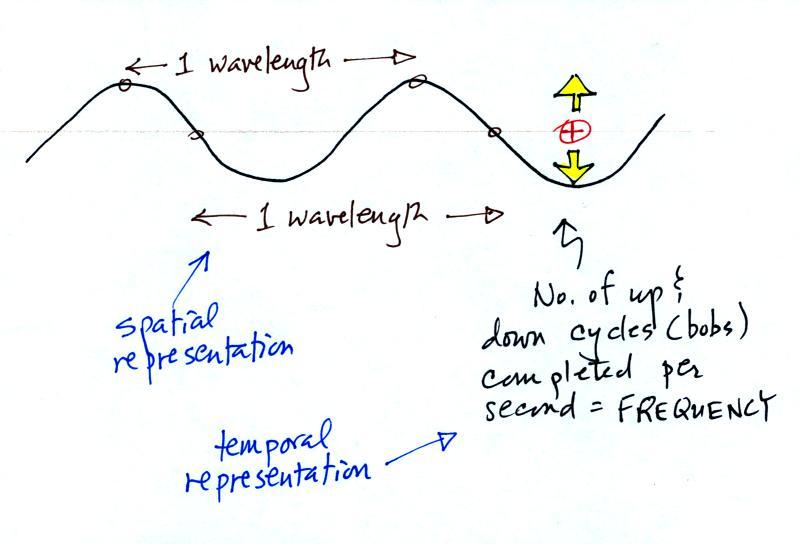
2 ways of describing or differentiating between
different types of EM radiation: wavelength & frequency
You can describe the radiation spatially using
the wavelength. In this case you're looking at the
EM radiation at different locations at one particular time.
Or you can describe the EM radiation temporally using the
frequency. Frequency is the number of up and down
cycles a charge would complete per second.
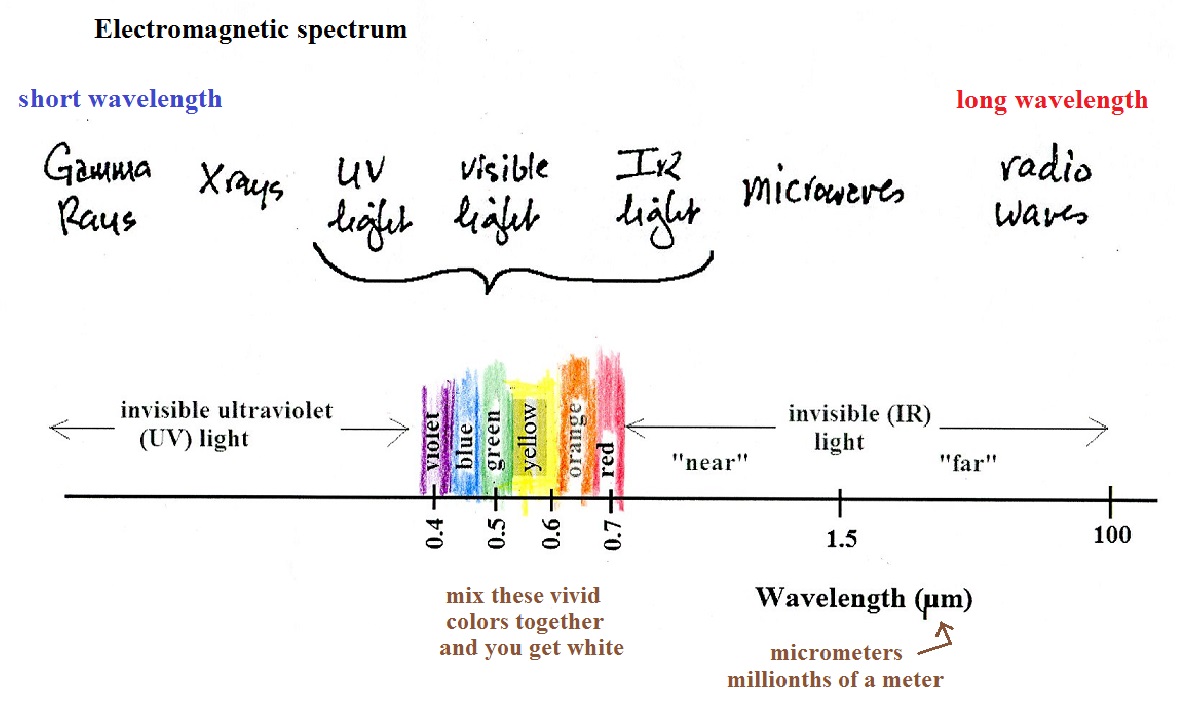
The electromagnetic spectrum
The EM spectrum is just a list of the different kinds of EM
radiation. A partial list is shown below.
In the top list, shortwave wavelength/high energy forms of EM
radiation are on the left (gamma rays and X-rays for
example). Microwaves and radiowaves are longer
wavelength/lower energy forms of EM radiation.
We will mostly be concerned with just ultraviolet light (UV),
visible light (VIS), and infrared light (IR). These are
shown on an expanded scale below. Note the micrometer
(millionths of a meter) units used for wavelength for these kinds
of light. The
visible portion of the spectrum falls between 0.4 and 0.7
micrometers. UV and IR light are both
invisible. All of the vivid colors shown above are just EM
radiation with slightly different wavelengths. When you see
all of these colors mixed together, you see white light.
I've tried to demonstrate colors mixing together to make white
light using laser pointers.
But it's too hard to get them adjusted so that the small spots
of colored light all fall on top of each other on the screen at
the front of the room. And even if you do the small spot of
light is so small that it's hard to see clearly in a large
classroom (you need to do the experiment on a piece of paper a few
feet away).
Here's the basic idea, you mix red green and blue light
together. You see white light were the three colors overlap
and mix in the center of the picture above. Doesn't it seem
odd that green and red mix to produce yellow?
Rules governing the emission of EM radiation
We'll spend a big part of the
class learning about and trying to understand a couple of rules
governing the emission of electromagnetic radiation. Here
they are:
1.
Everything
warmer than 0 K will emit EM radiation. Everything in the
classroom: the people, the furniture, the walls and the floor,
even the air, are emitting EM radiation. Often
this radiation will be invisible so that we can't see it and
weak enough that we can't feel it (or perhaps because it is
always there we've grown accustomed to it and ignore it).
Both the amount and kind (wavelength) of the emitted radiation
depend on the object's temperature. In the classroom most
everything has a temperature of around 300 K and we will see
that means everything is emitting far-infrared (FIR) radiation
with a wavelength of about 10µm.
2.
The second rule allows you to determine the
amount of EM radiation (radiant energy) an object will
emit. Don't worry about the units (though they're given in
the figure below), you can think of this as amount, or rate, or
intensity. Don't worry about σ
(the Greek character rho) either, it is just a constant.
The amount depends on temperature to the fourth power. If
the temperature of an object doubles the amount of energy
emitted will increase by a factor of 2 to the 4th power (that's
2 x 2 x 2 x 2 = 16). A hot object just doesn't emit a
little more energy than a cold object it emits a lot more energy
than a cold object. This is illustrated in the following
figure (found on page
64 in the ClassNotes):

The cool object is emitting 2 arrows worth of energy.
This could be the earth at 300 K. The warmer object is 2
times warmer, the earth heated to 600 K. The earth then
would emit 32 arrows (16 times more energy).
The earth has a temperature of 300 K. The sun is 20
times hotter (6000 K). Every square foot of the sun's
surface will emit 204 (160,000)
times more energy per second than a square foot of the
earth's surface.
3.
The third rule tells you something about the kind of
radiation emitted by an object. We will see that objects
usually emit radiation at many different wavelengths but not in
equal amounts. Objects emit more of one particular
wavelength than any of the others. This is called λmax
("lambda max", lambda is the Greek character used to represent
wavelength) and is the wavelength of maximum emission. The
third rule allows you to calculate λmax.
The tendency for warm objects to emit radiation at shorter
wavelengths is shown below.

Here's another way of understanding Stefan Boltzmann's law and
Wien's Law (the graph
below is on the bottom of page
63 in the ClassNotes).

1.
Notice
first that both and warm and the cold objects emit radiation
over a range of wavelengths (the curves above are like quiz
scores, not everyone gets the same score, there is a
distribution of grades). The warm object emits all the
wavelengths the cooler object does plus lots of additional
shorter wavelengths.
2.
The peak of
each curve is λmax
the wavelength of peak emission (the
object emits more of that particular wavelength than any other
wavelength). Note that λmax
has shifted toward shorter wavelengths for the warmer
object. That is Wien's law in action. The warmer
object is emitting lots of types of short wavelength radiation
that the colder object doesn't emit.
3.
The area under the curve is the total radiant
energy emitted by the object. The area
under the warm object curve is much bigger than the area
under the cold object curve. This
illustrates the fact that the warmer object emits a lot more
radiant energy than the colder object.
It is relatively easy to see Stefan-Boltzmann's law and Wien's
Law in action. The class demonstration consisted of an
"ordinary" 200 W tungsten bulb is connected to a dimmer switch
(see p. 65 in the photocopied ClassNotes and note that setting 0
is not included in the figure in the ClassNotes). We'll be
looking at the EM radiation emitted by the bulb filament.
The graph at the bottom of p. 65 has been split up into 3 parts
and redrawn for improved clarity.
We start with the bulb turned off (Setting 0). The
filament will be at room temperature which we will assume is
around 300 K (remember that is a reasonable and easy to remember
value for the average temperature of the earth's surface).
The bulb will be emitting radiation, it's shown on the top graph
above. The radiation is very weak so we can't feel it.
We can use Wien's Law to calculate the wavelength of peak
emission, λmax
. The wavelength of peak emission is
10 micrometers which is long wavelength, far IR radiation so we can't see
it.
Next we use the dimmer switch to just barely turn the bulb on
(the temperature of the filament is now about 900 K). The
bulb wasn't very bright at all and had an orange color. This
is curve 1, the middle figure. Note the far left end of the
emission curve has moved left of the 0.7 micrometer mark - into
the visible portion of the spectrum. That is what you were
able to see, just the small fraction of the radiation emitted by
the bulb that is visible light (but just long wavelength red and
orange light). The Draper point is the
approximate temperature above which almost all solid materials
begin to visibly glow (798 K , 525˚ C , 977˚ F see https://www.quora.com/At-what-temperature-do-all-objects-start-emitting-visible-light).
Most of the radiation emitted by the bulb at setting 1 is to the
right of the 0.7 micrometer mark and is invisible IR radiation (it
is strong enough now that you could feel it if you put your hand
next to the bulb).
Finally we turn on the bulb completely (it is a 200 Watt bulb
so it got pretty bright). The filament temperature is now
about 3000K. The bulb is emitting a lot more visible light,
all the colors, though not all in equal amounts. The mixture
of the colors produces a "warm white" light. It is warm
because it is a mixture that contains a lot more red, orange, and
yellow than blue, green, and violet light. It is interesting
that most of the radiation emitted by the bulb is still in the IR
portion of the spectrum (lambda max is 1 micrometer). This
is invisible light. A tungsten bulb like this is not
especially efficient, at least not as a source of visible
light.
If we have time we'll look at alternatives to inefficient, energy
wasting, tungsten bulbs at the end of class today.

This is a picture of Pahoehoe lava. The molten rock is
hot enough to be emitting visible light. If fact the color
can be used to estimate the temperature of the lava, yellow
indicates a temperature of about 1000 to 1200 °C (1,830 to
2,190 °F). (source of this photograph: https://en.wikipedia.org/wiki/Black-body_radiation,
a good article on blackbody radiation that contains a figure
showing the color you would see from objects of different
temperatures)
Light emitted by the earth and sun
The figure compares the light emitted by the sun and
the earth.
The curve on the left is for the sun. The surface of the
sun has a temperature of 6000 K so we can use Wien's law to
calculate λmax
. It turns out to be 0.5 micrometers. This is green
light; the sun emits more
green light than any other kind of light. The
sun doesn't appear green because it is also emitting lesser
amounts of violet, blue, yellow, orange, and red - together this
mix of colors appears white (it's a cooler white than
emitted by a tungsten bulb). 44% of the radiation emitted by
the sun is visible light, Very nearly half of sunlight (49%)
is IR light (37% near IR + 12% far IR). 7% of sunlight is
ultraviolet light. More than half of the light emitted by
the sun (the IR and UV light) is invisible.
100% of the light emitted by the earth (temperature = 300 K) is
invisible far IR light. The wavelength of peak emission for
the earth is 10 micrometers.
Because the sun (surface of the sun) is 20 times hotter
than the earth the sun's surface emits energy at a much higher
rate than the earth (160,000 times higher). Note
the vertical scale on the earth curve is different than on the sun
graph. If both the earth and sun were plotted with the same
vertical scale, the earth curve would be much too small to be
seen.
Radiative equilibrium on the
earth without an atmosphere
This is really just energy balance between radiant energy reaching
the earth from the sun and EM radiation emitted by the earth that
goes back out into space.
We will first look at the simplest kind of situation, the earth
without an atmosphere (or at least an atmosphere without
greenhouse gases). The next figure is on page
67 in the ClassNotes. Radiative equilibrium is really
just balance between incoming and outgoing radiant energy.

You might first wonder how it is possible for the relatively small
and cool earth (with a temperature of around 300 K) to be in
energy balance with the much larger and hotter sun (6000 K).
Because it is much hotter, every square foot of the sun emits
160,000 times as much energy as a square foot on the earth. In the
figure above, however, you can see that because the earth is
located about 90 million miles from the sun and only absorbs a
very tiny fraction of the total energy emitted by the sun.
The earth only needs to balance the energy it absorbs from the
sun.
To understand how energy balance occurs we start first by
imagining that the earth is out very cold (0 K) and is not
emitting any EM radiation at all. It is absorbing sunlight
however (4 of the 5 arrows of incoming sunlight in the
first picture are absorbed, 1 of the arrows is being reflected) so
it will begin to warm This is like opening a bank account,
the balance will start out at zero. But then you start
making deposits and the balance starts to grow.
Once the earth starts to warm it will also begin to emit EM
radiation, though not as much as it is getting from the sun (the
slightly warmer earth in the middle picture is now colored
blue). Only the four arrows of incoming sunlight that are
absorbed are shown in the middle figure. The arrow of
reflected sunlight has been left off because it doesn't really
play a role in energy balance (reflected sunlight is
like a check that bounces - it really doesn't affect your bank
account balance). The earth is emitting 3 arrows
of IR light (in red). Because the earth is still
gaining more energy (4 arrows) than it is losing (3 arrows) the
earth will warm some more. Once you find money in
your bank account you start to spend it. But as long as
deposits are greater than the withdrawals the balance will grow.
Eventually the earth will warm enough that it (now shaded
green) will emit the same amount of energy as it absorbs from the
sun. This is radiative equilibrium, energy balance (4 arrows
of absorbed energy are balanced by 4 arrows of emitted
energy). That is called the temperature of radiative
equilibrium (it's about 0 F for the earth).
Note that it is the amounts of energy, not the kinds of energy
that are important. Emitted radiation may have a different
wavelength than the absorbed energy. That doesn't
matter. As long as the amounts are the same the earth will
be in energy balance. Someone might deposit money into your
bank account in Euros while you spend dollars.
The figure below adds a figure showing radiative equilibrium,
energy balance, viewed from the earth's surface.
 |
 |
Energy balance viewed from
outer space
|
Radiative equilibrium viewed
from the ground on the without any atmosphere
|
Don't let the fact that there
are 4 arrows are being absorbed and emitted in the
left figure and only 2 arrows absorbed and emitted in the right
one. The important thing is that there are
equal amounts being absorbed and emitted in both cases.The
reason for only using two arrows in this picture is to keep the
picture as simple as possible. It will get complicated
enough when we add the atmosphere.
"Warm" and "cool" white; tungsten bulbs, compact
fluorescent, and LED bulbs
Ordinary tungsten bulbs (incandescent bulbs)
produce a lot of wasted energy. This is because they
emit a lot of invisible infrared light that doesn't light up a
room (it will warm up a room but there are better ways of
doing that). The light that they do produce is a warm
white color (tungsten bulbs emit lots of orange, red, and
yellow light and not much blue, green or violet).
Energy efficient compact fluorescent lamps (CFLs) are being
touted as an ecological alternative to tungsten bulbs because
they use substantially less electricity, don't emit a
lot of wasted infrared light, and are supposed to last
longer. CFLs come with different color temperature
ratings. What that is really referring to is the mix of
different colors that they use to produce white light.

The bulb with the hottest temperature rating (5500 K ) in the
figure above is meant to mimic or simulate sunlight
(daylight). The temperature of the sun is 6000 K and lambda
max is 0.5 micrometers. The spectrum of the 5500 K bulb is
similar. Even though the color temperature is
high this is referred to as cool white because it contains more
blue, green, and violet light.
The tungsten bulb (3000 K) and the CFLs with temperature
ratings of 3500 K and 2700 K produce a warmer white.
Three CFLs with the temperature ratings above were set up in
class so that you actually could see the difference between warm
and cool white light. Personally I find the 2700 K bulb "too
warm," it makes a room seem gloomy and depressing (a student in
class once said the light resembles Tucson at night). The
5500 K bulb is "too cool" and creates a stark sterile atmosphere
like you might see in a hospital corridor. I prefer the 3500
K bulb in the middle.
The photograph below (from this
source) showing the difference between warm white and cooler
white is one of the best I've seen.
The bulb on the far right has a tungsten filament and a color
temperature of 3000K. Then moving from left to right are CFL
bulbs with color temperatures of 6500 K, 5500 K, 4100 K, 3500 K,
and 2700 K.
There is one downside to these energy efficient CFLs. The
bulbs shouldn't just be discarded in your ordinary household trash
because they contain mercury. They should be disposed of
properly (at a hazardous materials collection site or perhaps at
the store where they were purchased). I suspect
a lot of people don't do that.
It probably won't be long before LED bulbs begin
to replace tungsten and CFL bulbs. The price has dropped
dramatically in the last year.
LED stands for light emitting diode. We
won't be looking at them in detail except to say that a single LED
can produce only a single color, it can't produce white
light.
What is done instead is to put three small LEDS, producing red, green
and blue light, in close
proximity. When they are illuminated the three colors mix
together to produce white light like in an earlier figure in
today's notes (reproduced above with some additional comments, see
also "RGB
color model" in Wikipedia ). By
varying the intensity of the individual LEDs you can produce a
wide variety of colors. CFLs sometimes take 30 seconds or a
minute to come to full brightness. LED bulbs turn on
instantaneously. Another important advantage is
that LED bulbs do not contain mercury.
Just as with CFLs you can buy LED bulbs with different color
temperatures, i.e. bulbs that produce warm white light that
resembles what is produced by a tungsten bulb and bulbs that
produce a cooler white that is more similar to sunlight.
You'll often see the bulbs grouped as soft white (warm white),
bright white, and daylight. I'll show some examples in
class.