
|
|
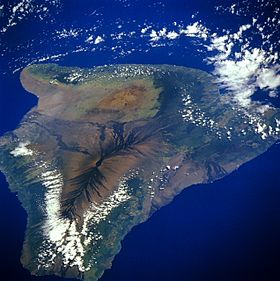 The summit of Mauna Loa is the dark area to the left of center on this image of the "big island" of Hawaii. (source of this image) |
 |
 |
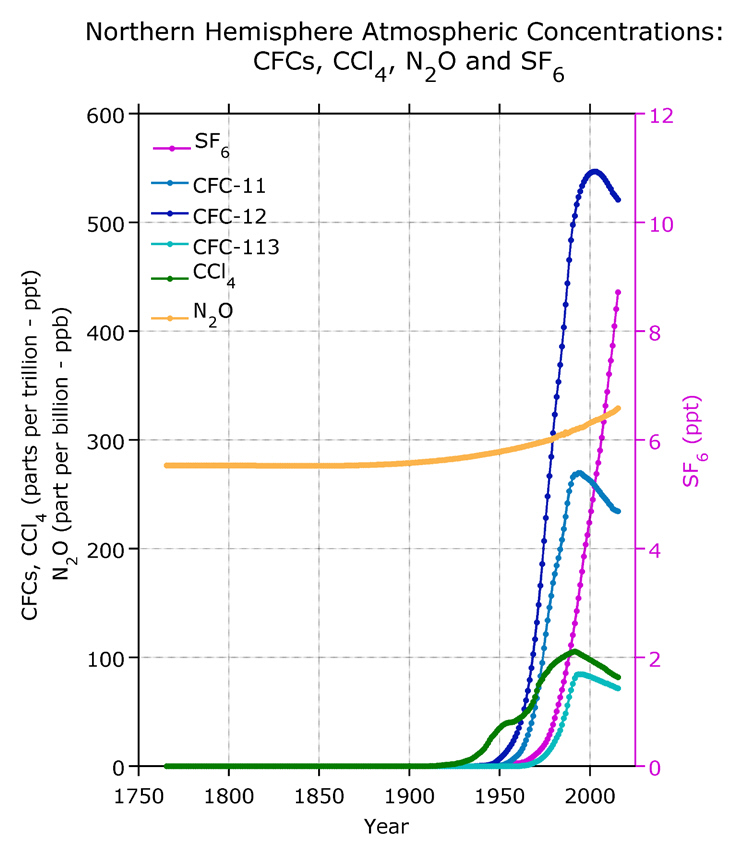 |
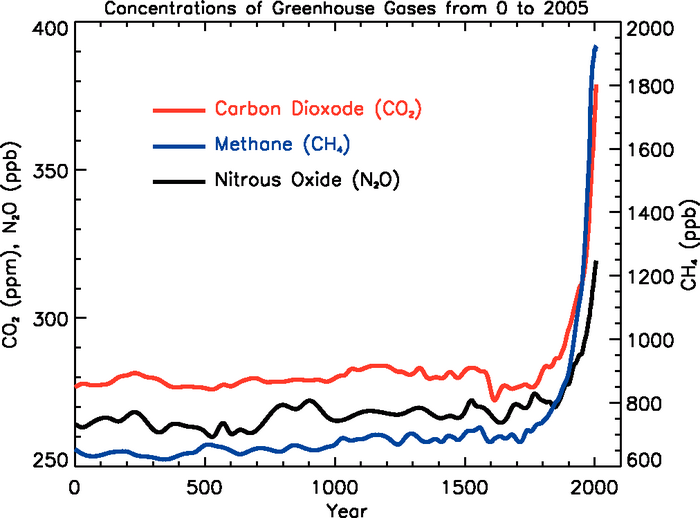
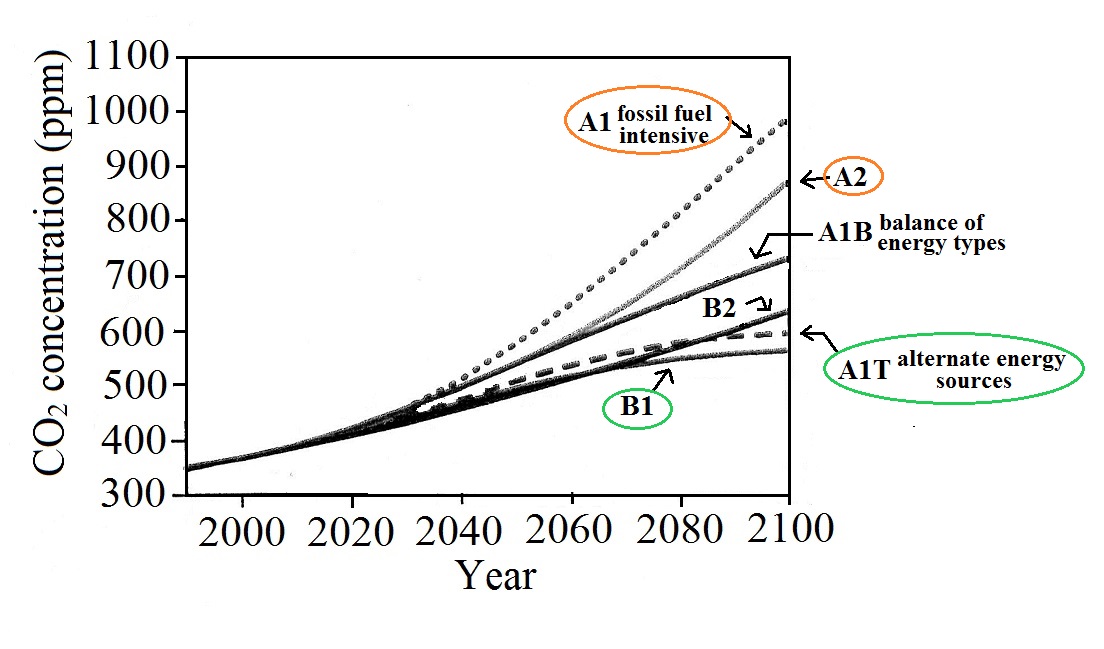
| This figure is from Climate Change 2007, IPCC 4th Assessment Report. | Source of this figure: Bullister,
J.L. 2015. Atmospheric
Histories (1765-2015) for CFC-11, CFC-12, CFC-113, CCl4,
SF6 and N2O. Carbon
Dioxide Information Analysis Center, Oak Ridge National
Laboratory, US Department of Energy, Oak Ridge, Tennessee. |
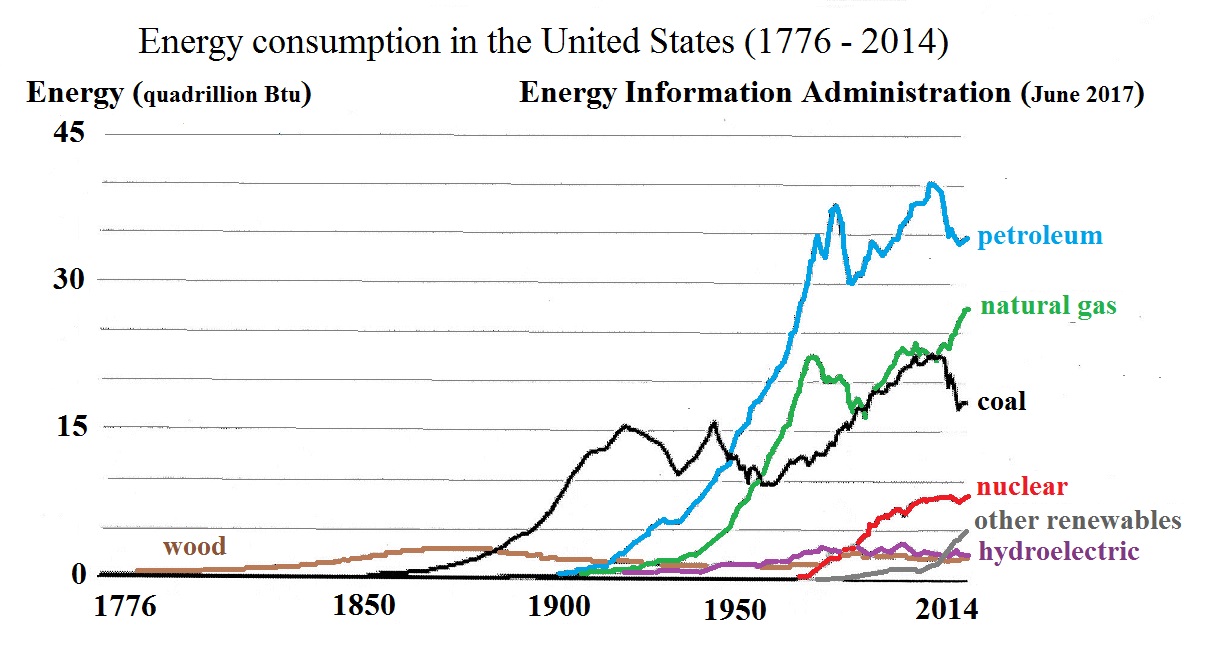 |
| adapted from the U.S.
Energy Information Administration (June 2017) |
 |
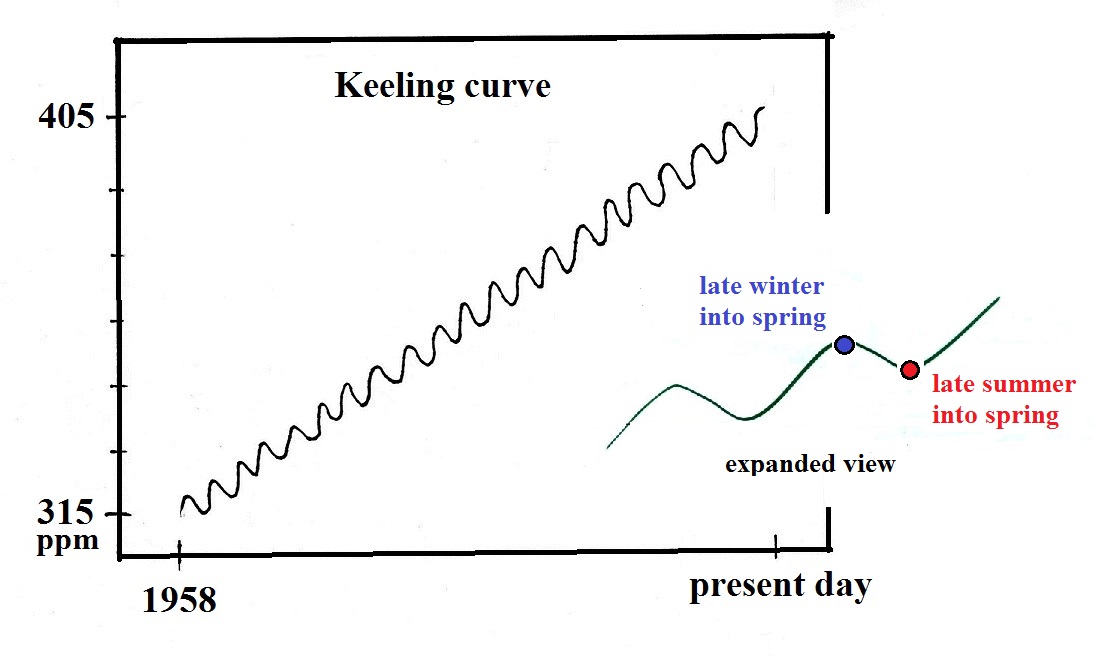
| also from the U.S.
Energy Information Administration (June 2017) |
 |
 |
| concentration |
physiological symptoms |
| 1% (10,000 ppm) |
some people start to experience
drowsiness. |
| 2% |
mildly narcotic, increases blood
pressure and pulse rate, and decreases hearing |
| 5% |
shortness of breath, dizziness,
confusion, anxiety, headache |
| 8% |
dimmed sight, sweating, muscular
tremors, loss of consciousness after 5 to 10 minutes
exposure |
 |
 |
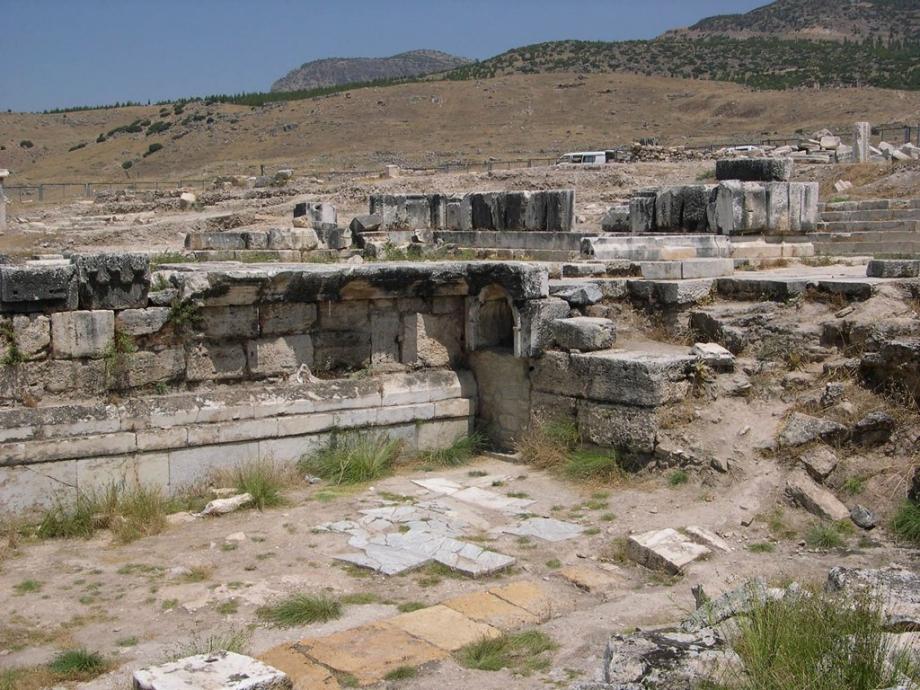
| The site as it appears
now (source
of this photograph) |
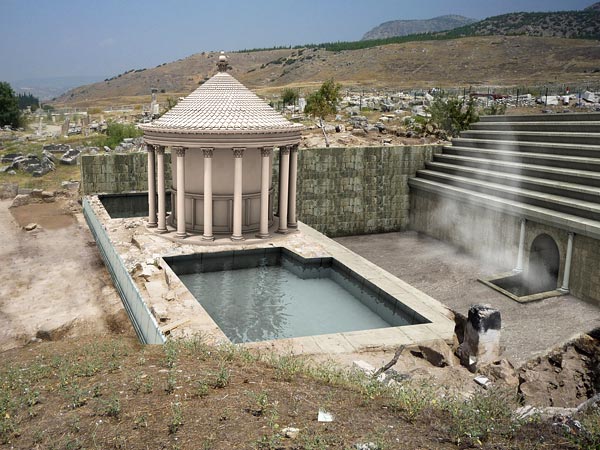
The site as it might have
appeared in ancient times. This photograph,
credited to Francesco D'Andria, the Italian archaeologist
that announced the discovery in March, 2013, is found in a news
report from the National Geographic Society. |