Upper Level Charts pt. 1 - Basic Features

There is an Optional Assignment that accompanies a 3-part series of reading material on Upper Level Charts.  You'll be able to earn extra credit points or points that will be added to your Quiz #3 score.  We'll only cover the first part of the material in class.

We've already spent some time learning about surface weather maps.  Maps showing conditions at various altitudes above the ground are also drawn.  Upper level conditions can affect the development and movement of surface features (and vice versa).

In this first section we'll just learn 3 basic facts about upper level charts.  First 
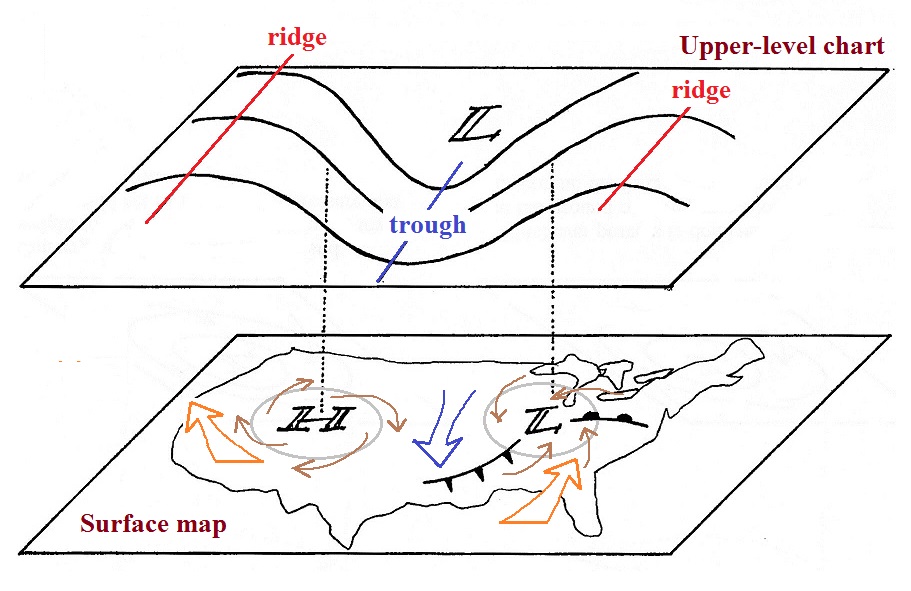
the overall appearance is somewhat different from a surface weather map.  The pattern on a surface map can be complex 
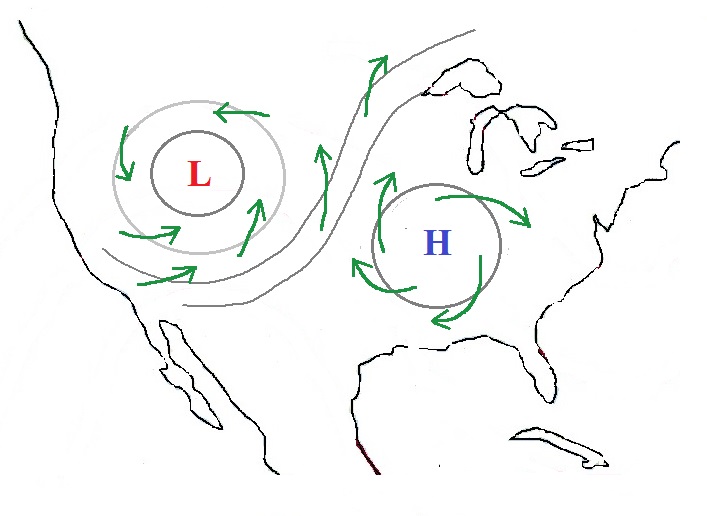
and you generally find circular (more or less) centers of high and low pressure (see the bottom part of the figure below).  You can also find closed high and low pressure centers at upper levels, but mostly you find a relatively simple wavy pattern like is shown on the upper portion of the figure below (sort of a 3-dimensional view).  The figure below is on page 42 in the Class Notes.


A simple upper level chart pattern is sketched below (a map view).  There are two basic features: wavy lines that dip southward and have a "u-shape" and lines that bend northward and have an "n-shape".  The following figure is on page 41 in the ClassNotes.

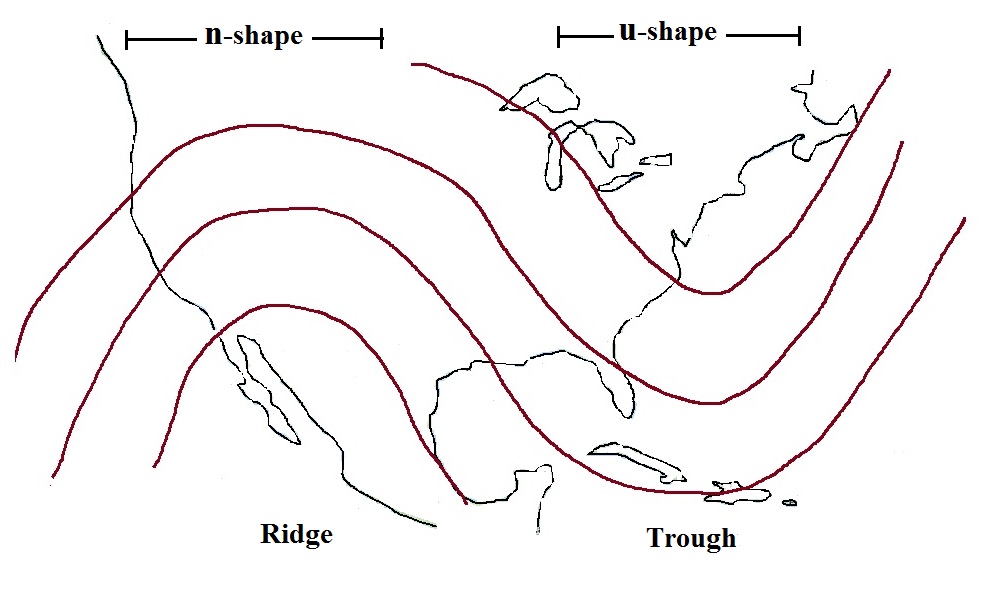
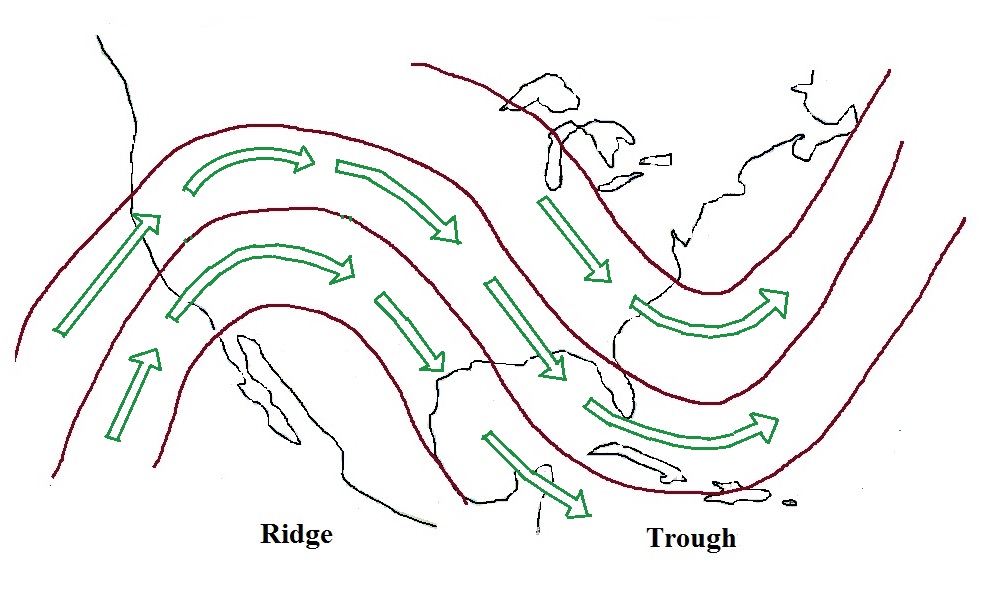
The u-shaped portion of the pattern is called a trough.  The n-shaped portion is called a ridge.

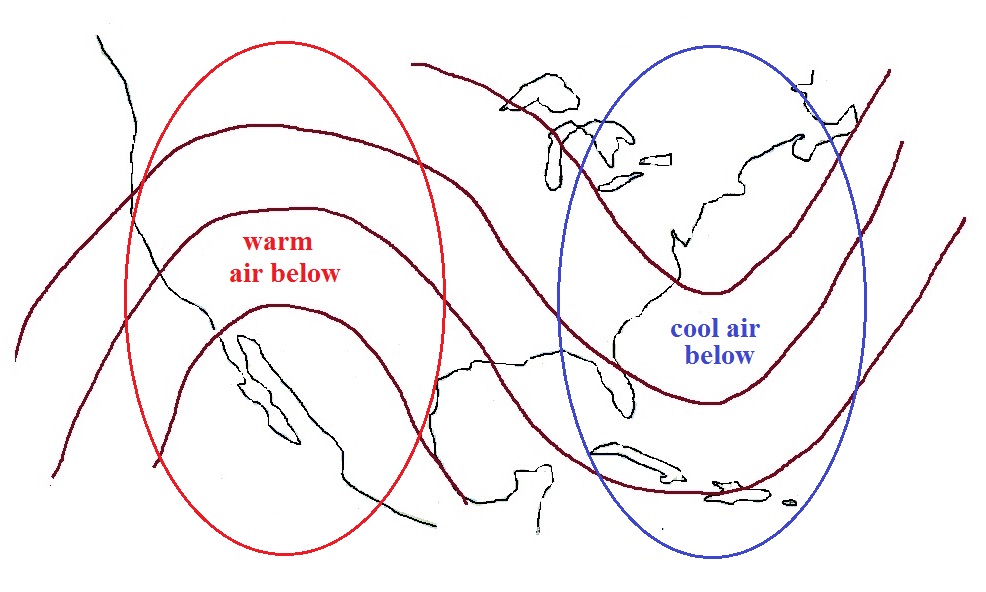
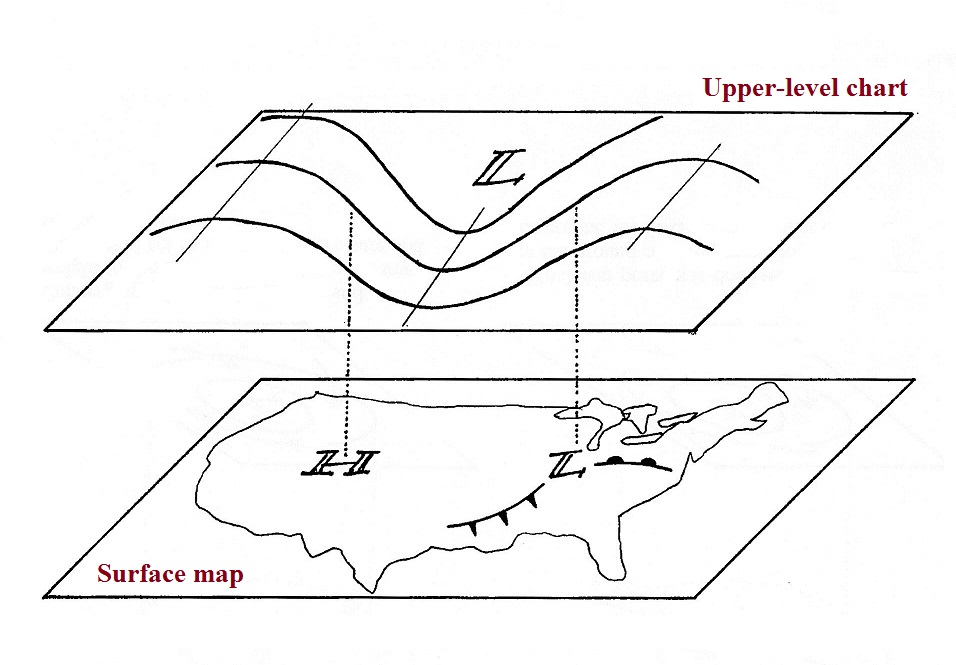
Troughs are produced by large volumes of cool or cold air (the cold air is found between the ground and the upper level that the map depicts).  The eastern half of the country in the map above would probably be experiencing colder than average temperatures.  Large volumes of warm or hot air produce ridges.  We'll see why this is true in the 2nd part of the supplementary reading material.


The 10 am MST 500 mb upper level chart for Monday, Oct. 15, 2018.  Note the trough positioned over the western states.

This feature is partly responsible for the wetter- and cooler-than-average weather we have been experiencing.


11 am surface temperatures for Monday, Oct. 15, 2018.  The western 2/3rds of the US are under an upper level trough.  Temperatures in Arizona, New Mexico, and western Texas are in the 30s and 40s.  The eastern 1/3rd of the country is under the the edge of a ridge and is considerably warmer.  Temperatures in Mississippi, Alabama, and Georgia are in the 80s.

We can begin to see how surface features can influence the upper level pattern in the map below.


A surface center of low pressure is often found east of an upper level trough.  Surface high pressure is often east of an upper level ridge.  Note how the surface winds in between the surface high and surface low are moving colder air southward.  This is directly below the upper level trough axis.    Warmer air is moving northward to the east of the surface low and to the west of the surface high.  This warmer air is directly below upper level ridges.

There is one last feature to be aware of.


The winds on upper level charts blow parallel to the contour lines generally from west to east.  This is a little different from surface winds which blow across the isobars toward low pressure.  An example of surface winds is shown below.


That's it for this first section.  Really all you need to be able to do is
1. identify troughs and ridges,
2. remember that troughs are associated with cold air & ridges with warm air, and
3. remember that upper level winds blow parallel to the contour lines from west to east.