 |
 |
|
 |
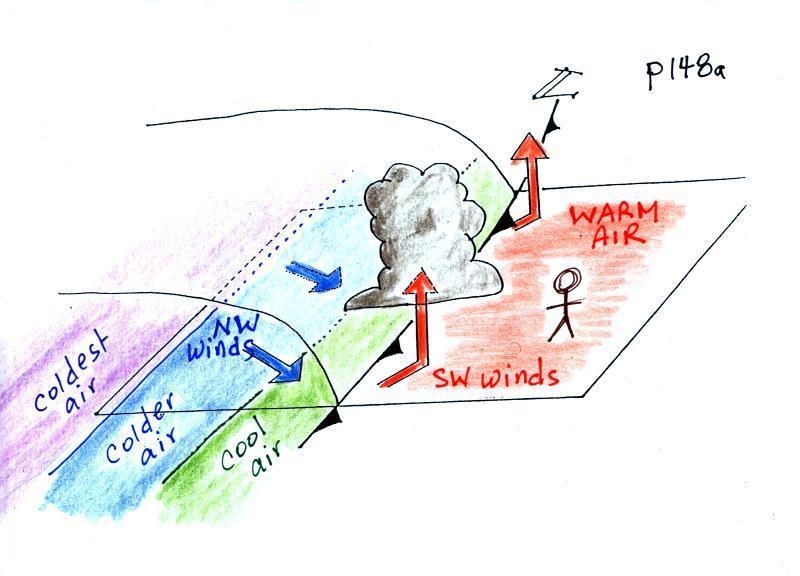
| Weather
variable |
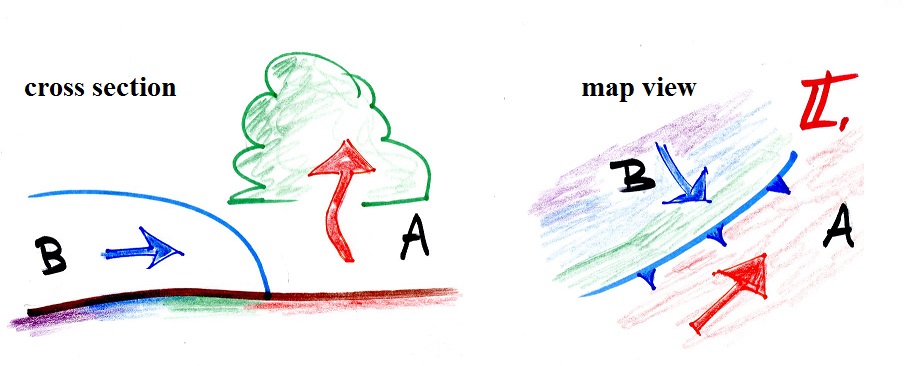
Behind |
Passing |
Ahead |
| Temperature |
cool, cold,
colder* |
warm |
|
| Dew
Point |
usually much
drier** |
may be moist
(though that is often not the case here in the desert southwest) |
|
| Winds |
northwest |
gusty winds (dusty) |
from the southwest |
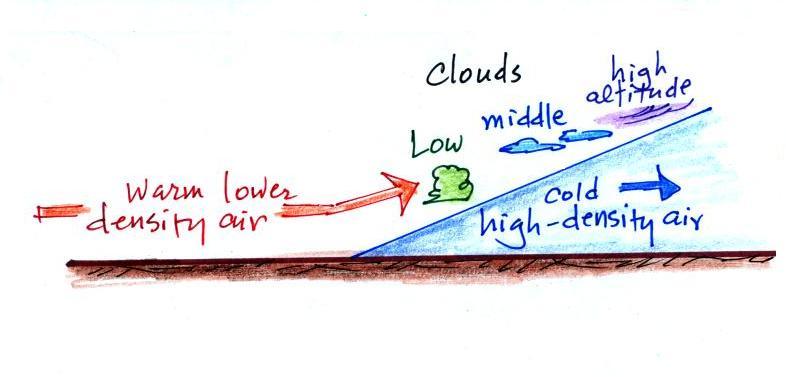
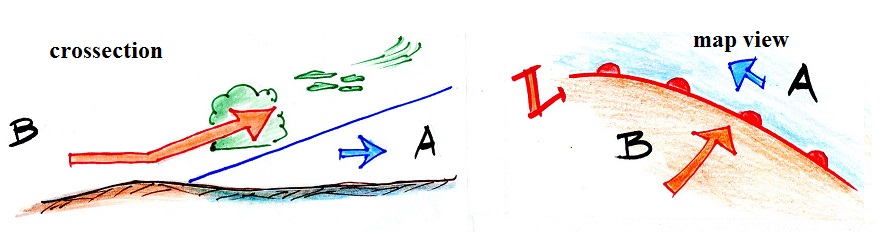
| Clouds,
Weather |
clearing |
rain clouds,
thunderstorms in a narrow band along the front (if the warm air mass is moist) |
might see some high
clouds |
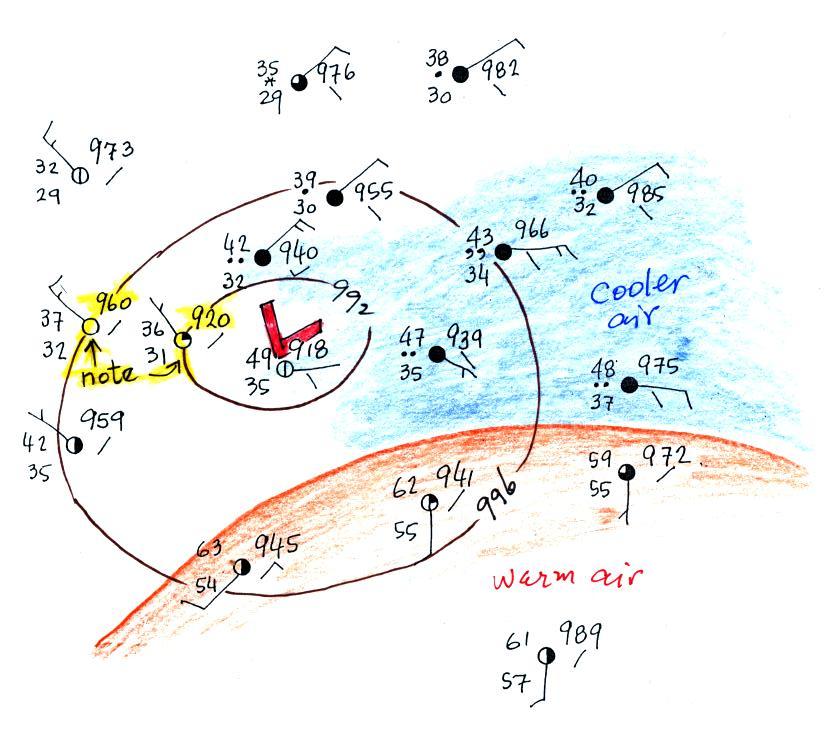
| Pressure |
rising |
reaches a minimum |
falling |
|
 |


| Weather
Variable |
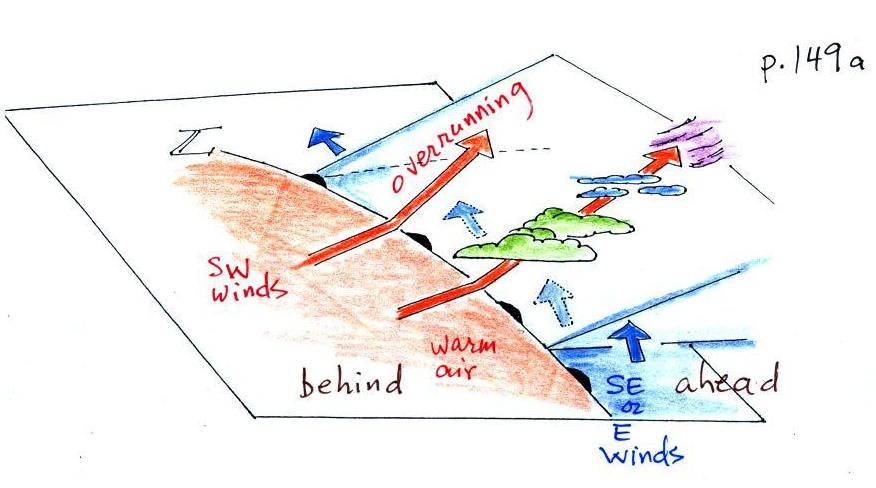
Behind
(after) |
Passing |
Ahead
(before) |
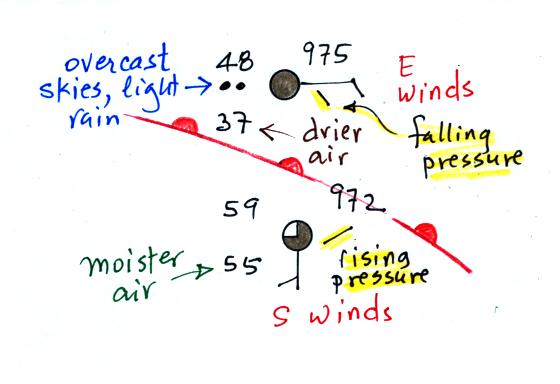
| Temperature |
warmer |
cool |
|
| Dew point |
may be moister |
drier |
|
| Winds |
SW, S, SE |
from the East or
SE, maybe even the S |
|
| Clouds,
Weather |
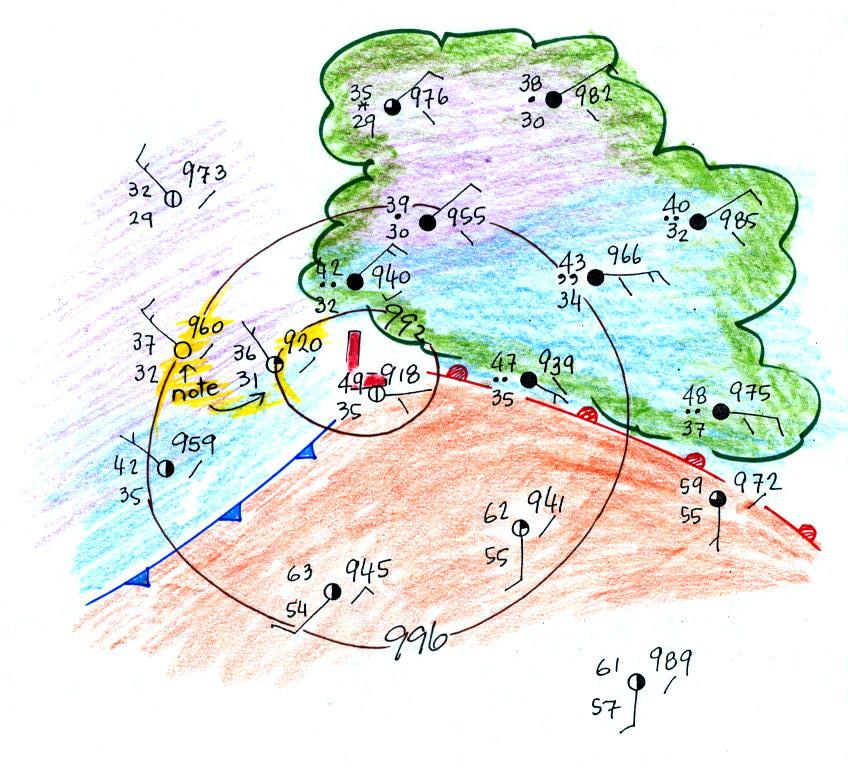
clearing |
wide
variety of clouds that may precede arrival of the front
by a day or two clouds may produce a wide variety of types of precipitation also (snow, sleet, freezing rain, and rain) |
|
| Pressure |
rising |
minimum |
falling |
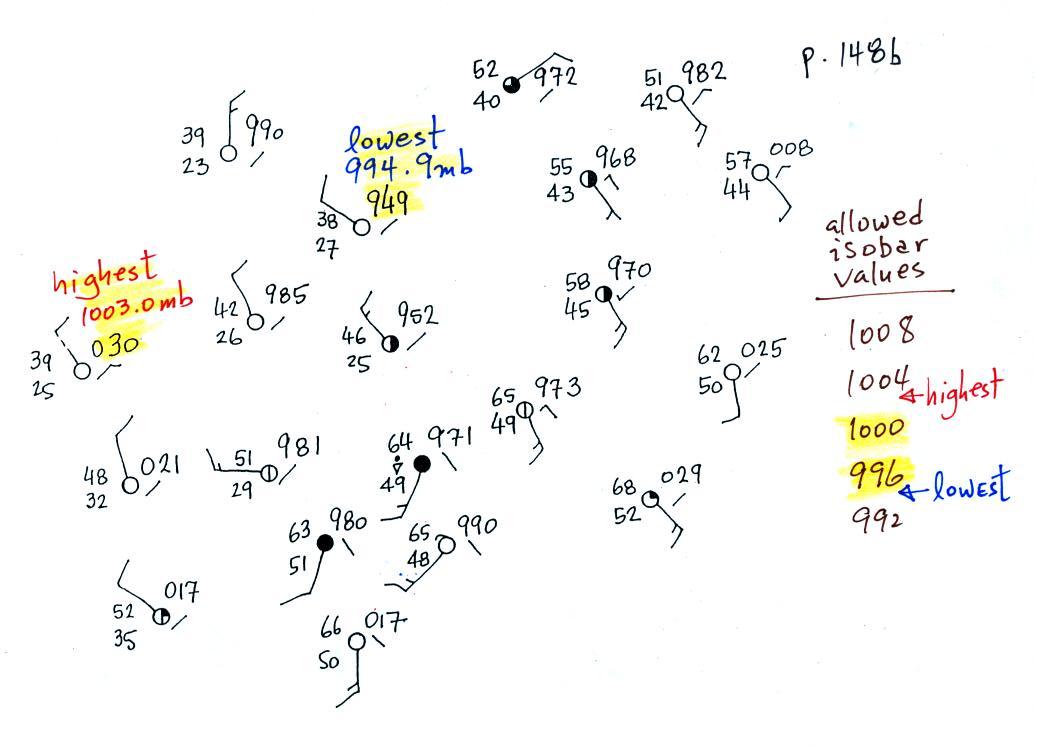
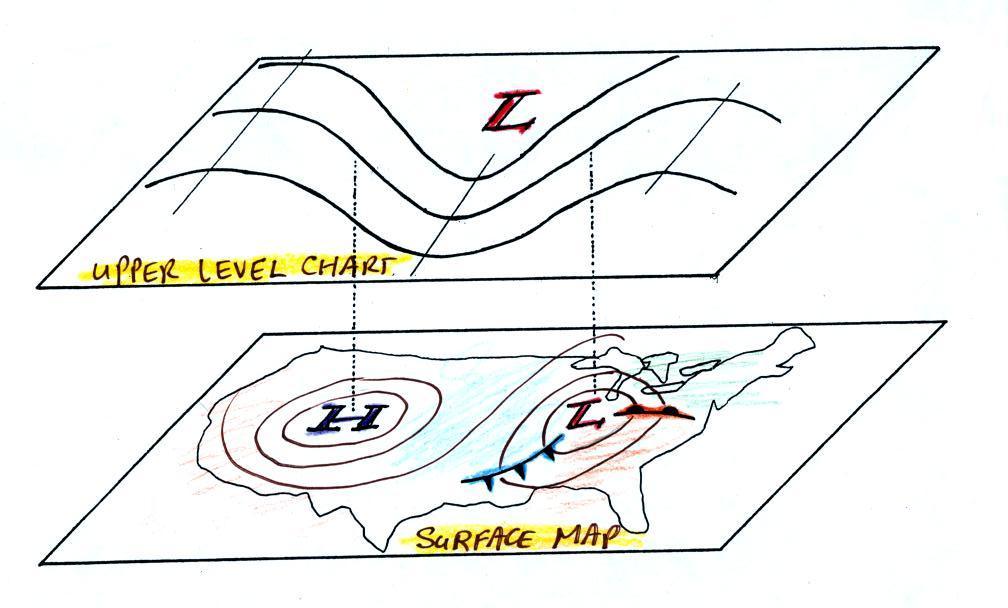
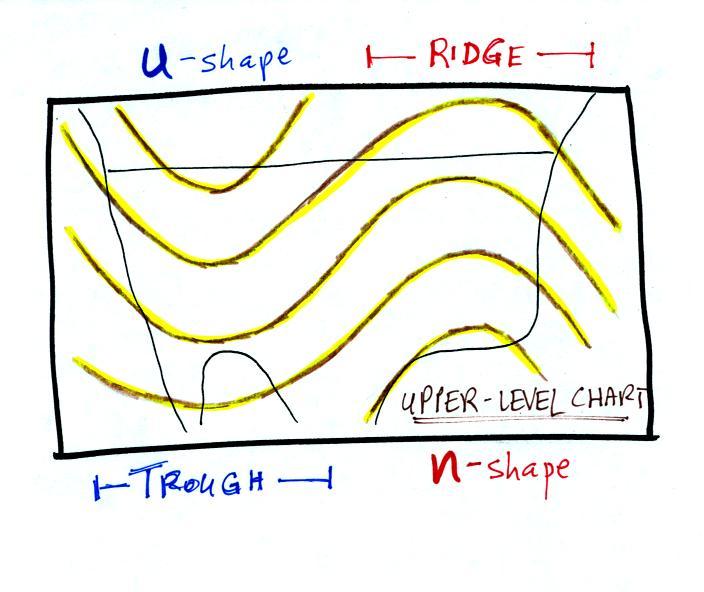
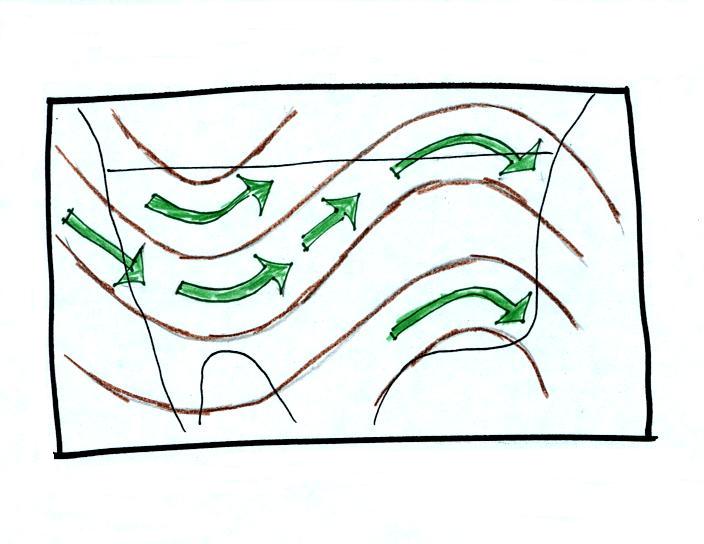
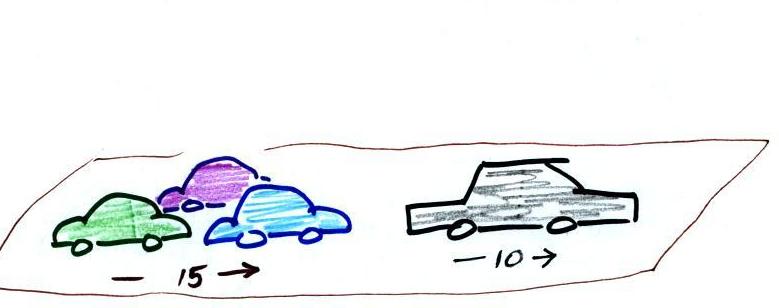
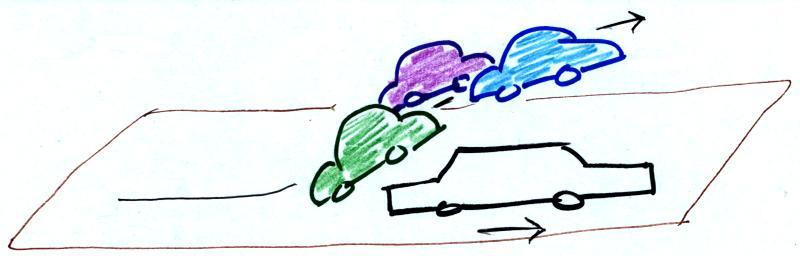
The u-shaped portion
of the pattern is called a trough. The n-shaped portion is called
a ridge.
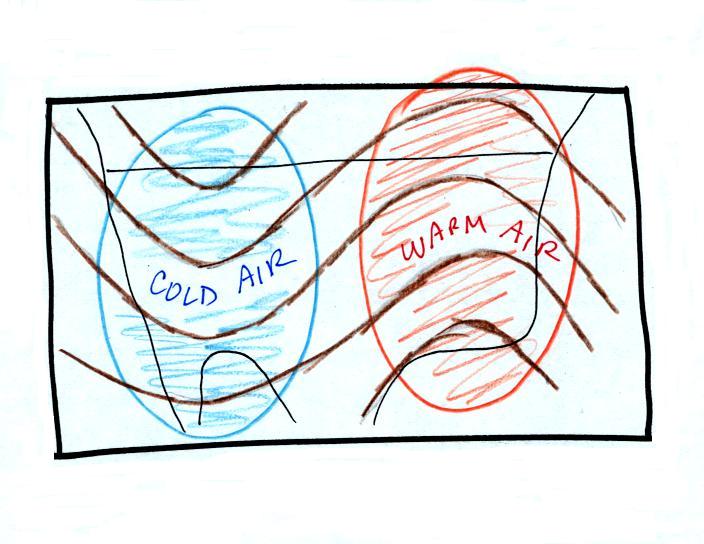
Troughs are produced by large volumes of cool or cold
air (the cold air is found between the ground and the upper
level that the map depicts). The western half of the
country in the map above would probably be experiencing colder
than average temperatures. Large volumes of warm or hot
air produce ridges. We'll see why this is true in "Upper
level charts pt. 2".
 |
 |
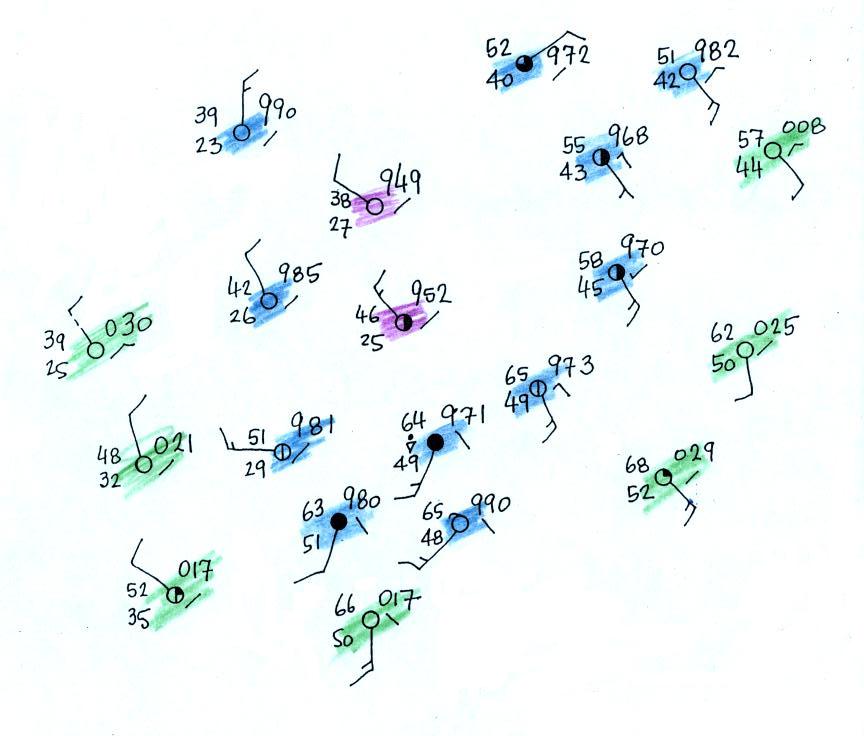
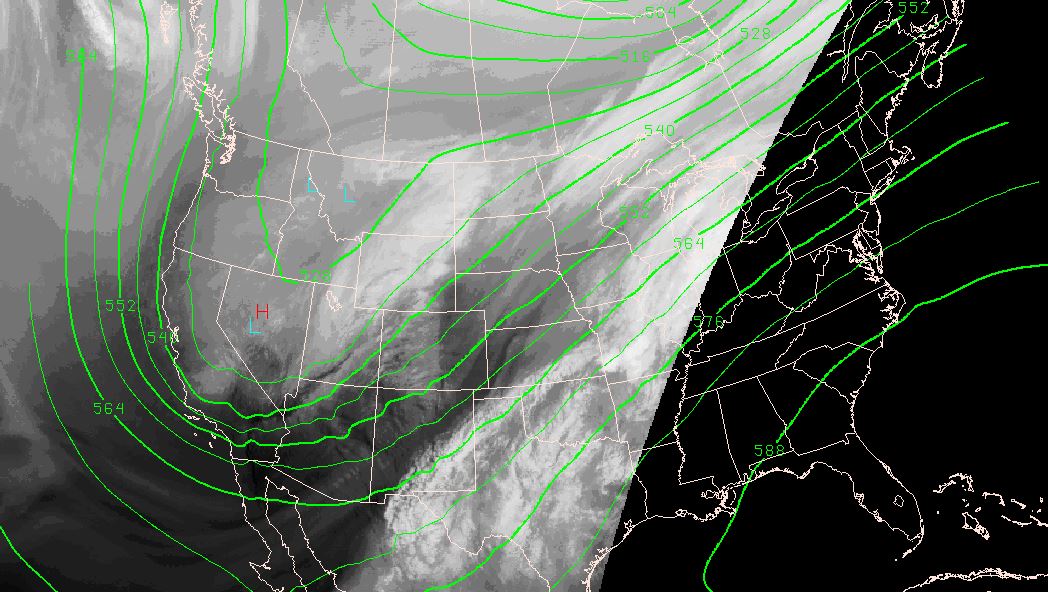
| The 500 mb upper level chart for Monday
Feb. 19, 2018. Note the trough positioned over the
western states. |
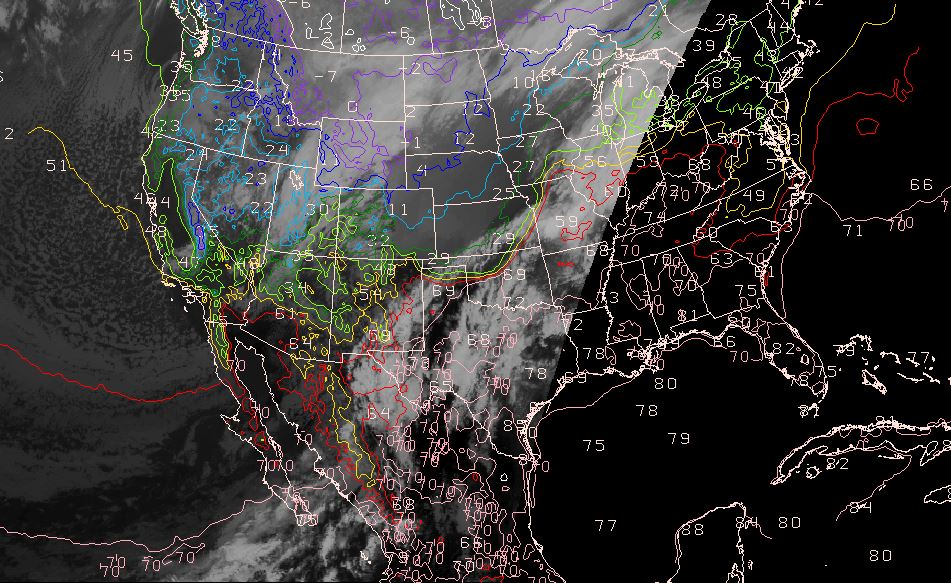
2 pm surface temperatures for Monday,
Feb. 19 (18Z = 11 am MST). At a given latitude,
temperatures do seem to be somewhat cooler under the
trough over the western third of the US (blue and green
colors) compared to the eastern portion of the US (yellow
and red isotherms).). |