Thursday Nov. 16, 2017
Chris Isaak "Wicked Game"
(4:47), Amy Winehouse "Back to Black"
(3:54), Gotye "Somebody I
Used to Know" (4:07), Koop "Koop Island
Blues" (4:33), Nouvelle Vague "In a Manner
of Speaking" (4:00)
Thunderstorms introduction
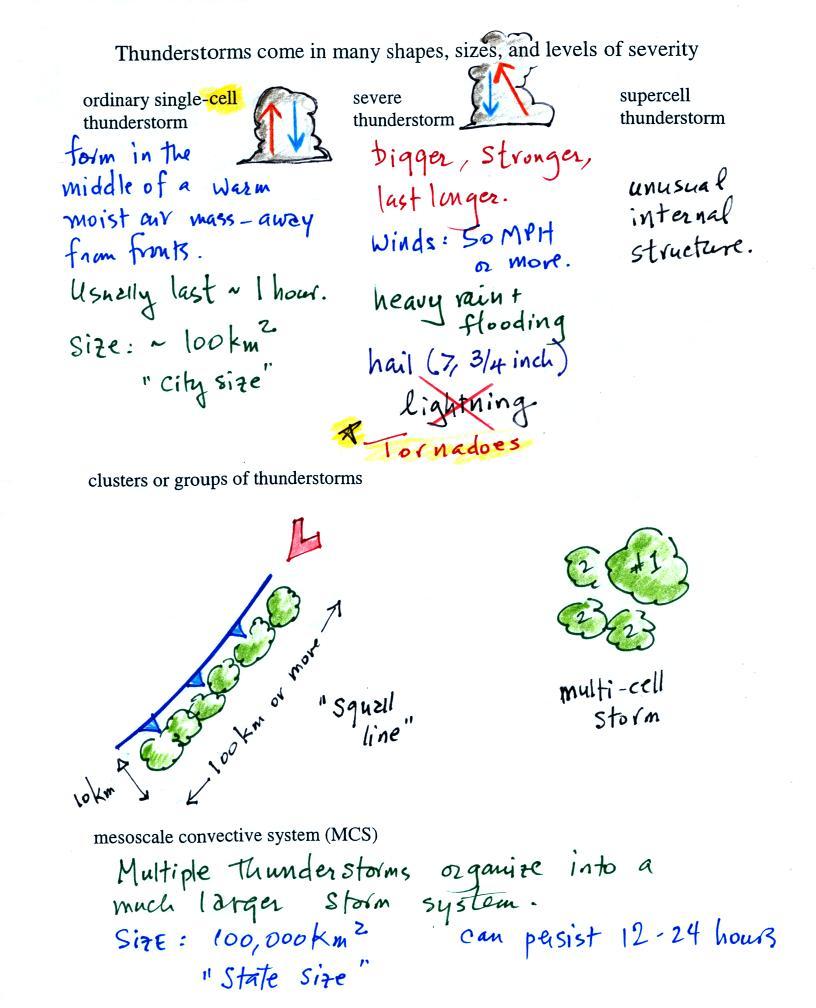
Thunderstorms come in different sizes and levels of
severity. We will mostly be concerned with ordinary
single-cell thunderstorms (also referred to as air mass
thunderstorms). They form in the middle of warm moist air,
away from fronts. Most summer thunderstorms in Tucson are
this type. An air mass thunderstorm has a vertical
updraft. A cell is just a term that means a single
thunderstorm "unit" (a storm with an updraft and a downdraft).
In class I'll show a particularly nice image of a single cell
thunderstgorm from a
gallery of storm images that were taken by Mike Olbinski.
Tilted updrafts are found in severe and supercell
thunderstorms. As we shall see this allows those storms to
get bigger, stronger, and last longer. The
tilted updraft will sometimes begin to rotate. We'll see
this produces an interesting cloud feature called a wall cloud and
sometimes tornadoes. Supercell thunderstorms have
a complex internal structure; I'll try to show a short video
at some point that shows a computer simulation of the complex air
motions inside a supercell thunderstorm.
The 1st and 5th images in Olbinski's gallery show the base of a
supercell thunderstorms photographed in Texas with wall clouds (in
the 5th image, air from the downdraft is being sucked back up by
the updraft). There are additional images
further down in the gallery.
We won't spend anytime discussing mesoscale convective systems
except to say that they are a much larger storm system. They
can cover a large portion of a state. They move slowly and
often thunderstorm activity can persist for much of a day.
Occasionally in the summer in Tucson we'll have activity that
lasts throughout the night. This is often caused by an MCS.
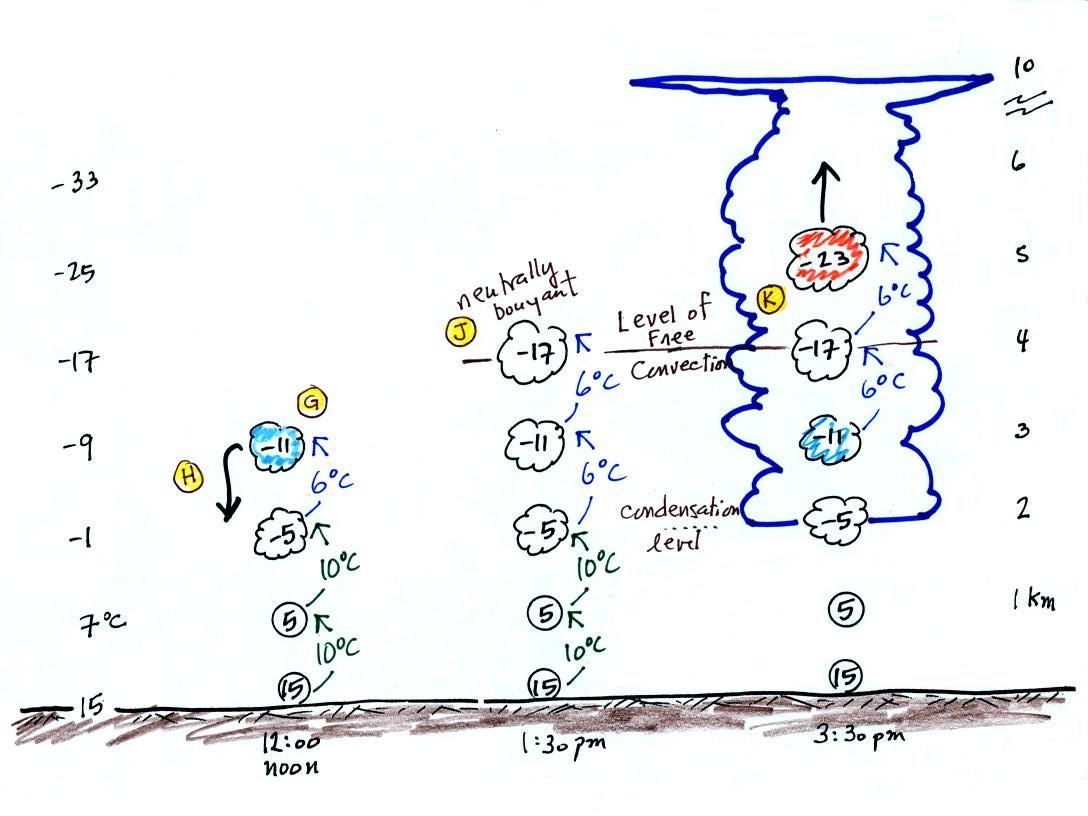
The buildup to an air mass thunderstorm
The following somewhat tedious material is intended to
prepare you to better appreciate a time lapse video movie of a
thunderstorm developing over the Catalina mountains. The
newest 1S1P/Optional Assignment will make use of the same 10
C/km and 6 C/km rates of cooling for rising parcels of
unsaturated and saturated air.
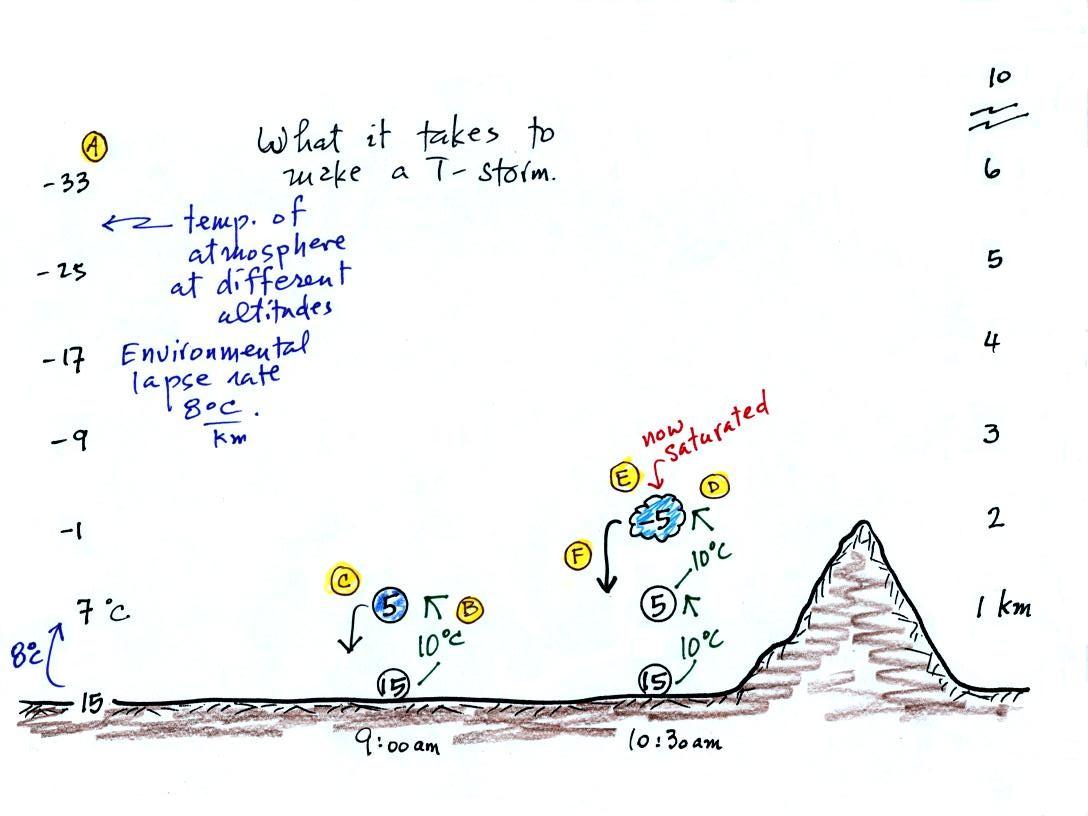
Refer back and forth between the lettered points in the
figure above and the commentary below.
The numbers in Column A
show the temperature of the air in the atmosphere at various
altitudes above the ground (note the altitude scale on the right
edge of the figure). On this particular day the air
temperature was decreasing at a steady rate of 8 C per
kilometer. This rate of decrease is referred to as the
environmental lapse rate (lapse rate just means rate of decrease
with altitude). Temperature could decrease more quickly than
shown here or less rapidly. Temperature in the atmosphere
can even increase with increasing altitude (a temperature
inversion).
At Point B, some
of the surface air is put into an imaginary container, a
parcel. Then a meteorological process of some kind lifts the
air to 1 km altitude (in Arizona in the summer, sunlight heats the
ground and air in contact with the ground, the warm air becomes
buoyant - that's called free convection). The rising air
will expand and cool as it is rising. Unsaturated air (RH
is less than 100%) cools at a rate of
10 C per kilometer. So the 15 C surface air will have
a temperature of 5 C once it arrives at 1 km altitude.
Early in the morning "Mother Nature" is only able to lift the
parcel to 1 km and "then lets go." At Point C note that the
air inside the parcel is slightly colder than the air outside (5 C
inside versus 7 C outside). The air inside the parcel will
be denser than the air outside and the parcel will sink back to
the ground. You wouldn't be able to see this because the air
is clear, invisible.
By 10:30 am the parcel is being lifted to 2 km as shown at Point D. It is
still cooling 10 C for every kilometer of altitude gain. At
2 km, at Point E
the air has cooled to its dew point temperature, the
relative humidity is now 100%, and a cloud has formed.
This level is referred to as the condensation level.
A dew point temperature of -5 C was used in this example. It
could be warmer or colder than that.
Notice at Point F,
the air in the parcel or in the cloud (-5 C) is still colder and
denser than the surrounding air (-1 C), so the air will sink back
to the ground and the cloud will disappear. Still no
thunderstorm at this point.
At noon, the air is lifted to 3 km. Because the air
became saturated at 2 km, it will cool at a different rate between
2 and 3 kilometers altitude. Saturated air cools at a
rate of 6 C/km instead of 10 C/km. The saturated air
cools more slowly because release of latent heat during
condensation offsets some of the cooling due to expansion.
The air that arrives at 3km, Point H, is again still colder than the
surrounding air and will sink back down to the surface.
By 1:30 pm the air is getting high enough that it has become
neutrally buoyant, it has the same temperature and density as the
air around it (-17 C inside and -17 C outside). This is
called the level of free convection, Point J in the
figure.
If you can, somehow or another, lift air above the level
of free convection it will find itself warmer and less dense than
the surrounding air as shown at Point K and will float upward to
the top of the troposphere on its own, it doesn't need Mother
Nature's help anymore. This is really the beginning
of a thunderstorm. The thunderstorm will grow
upward until it reaches very stable air at the bottom of the
stratosphere the rising air will quickly become colder and denser
than the surrounding air if it travels into the stratosphere).
Here's a time
lapse video showing a day's worth of work leading eventually
to the development of a thunderstorm over the Catalina mountains
north of Tucson (Firefox seems to have trouble sometimes
downloading the file, you may need to use another browser).
Air mass thunderstorm life
cycle
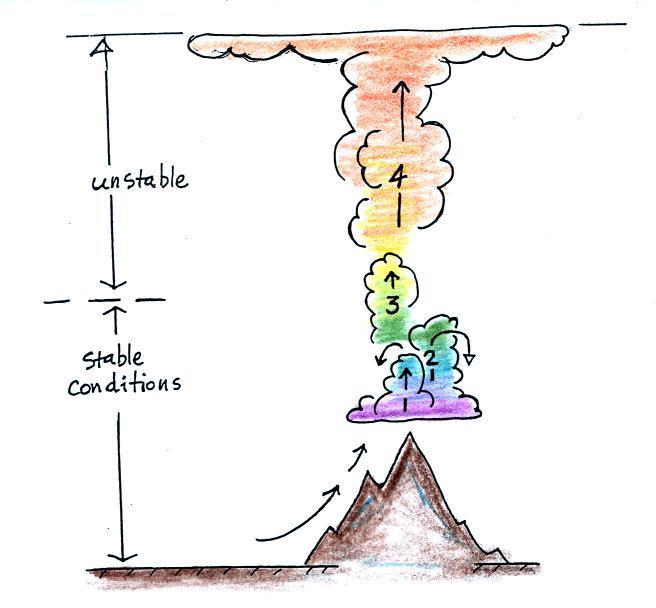
The events leading up to the initiation of a
summer air mass thunderstorm are summarized in the figure below
(p. 151 in the ClassNotes). It takes some effort and often a good part of the day
before a thunderstorm forms. The air must be lifted to
just above the level of free convection (the dotted line at
middle left in the picture). Once air is lifted above the
level of free convection it finds itself warmer and less dense
that the air around it and floats upward on its own. I've tried to show this with colors below.
Cool colors below the level of free convection because the air
in the lifted parcel is colder and denser than its
surroundings. Warm colors above the dotted line indicate
parcel air that is warmer and less dense than the
surroundings. Once the parcel is lifted above the level
of free convection it becomes buoyant; this is the
moment at which the air mass thunderstorm begins.
Once an air mass
thunderstorm gets above the level of free convection it goes
through a 3-stage life cycle
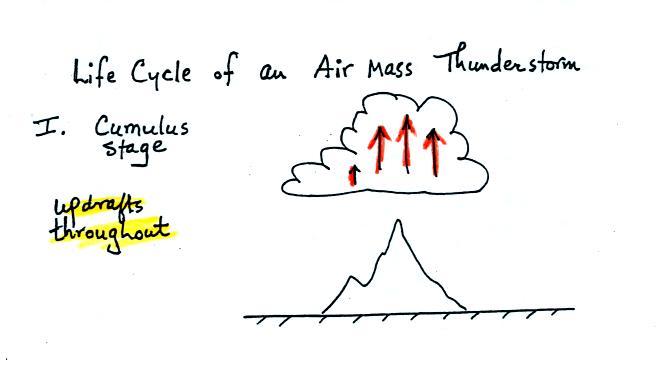
In
the first stage you would only find updrafts inside the cloud
(that's all you need to know about this stage, you don't even
need to remember the name of the stage).
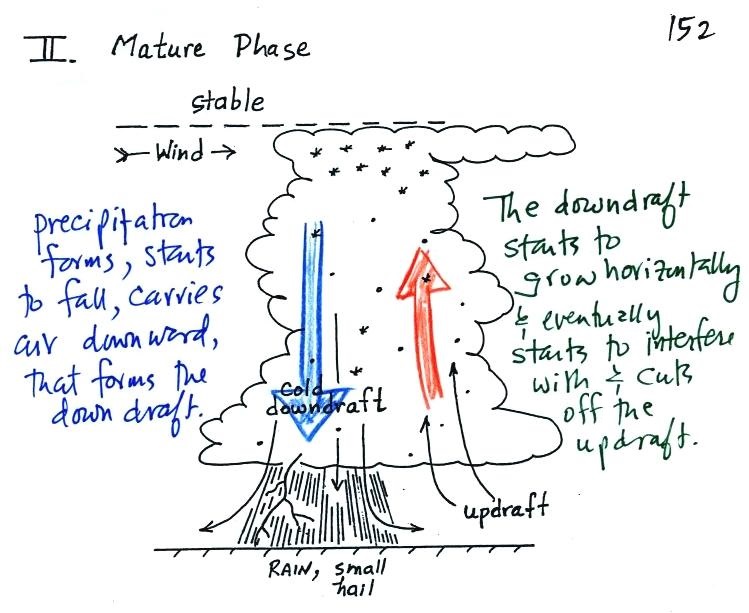
Once precipitation has formed and grown to a certain size, it
will begin to fall and drag air downward with it. This
is the beginning of the mature stage where you find both an
updraft and a downdraft inside the cloud. The falling
precipitation will also pull in dry air from outside the
thunderstorm (this is called entrainment). Precipitation
will mix with this drier air and evaporate. The
evaporation will strengthen the downdraft (the evaporation
cools the air and makes it denser).
The thunderstorm is strongest in the mature stage. This
is when the heaviest rain, hail, strongest winds, and most of
the lightning occur.
Eventually the downdraft spreads
horizontally throughout the inside of the cloud and begins to
interfere with the updraft. This marks the beginning of
the end for this thunderstorm.
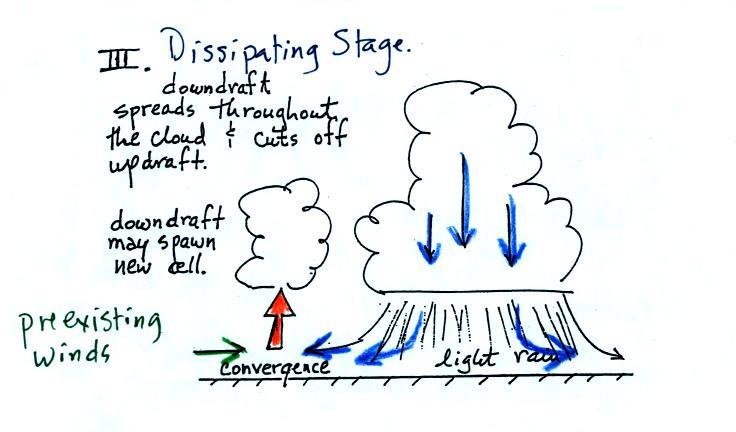
The downdraft
eventually fills the interior of the cloud. In this
dissipating stage you would only find weak downdrafts
throughout the cloud.
Note how the winds from one
thunderstorm can cause a region of convergence on one side of
the original storm and can lead to the development of new
storms. Preexisting winds refers to winds that were
blowing before the thunderstorm formed. Convergence
between the preexisting winds and the thunderstorm downdraft
winds creates rising air that can initiate a new thunderstorm.
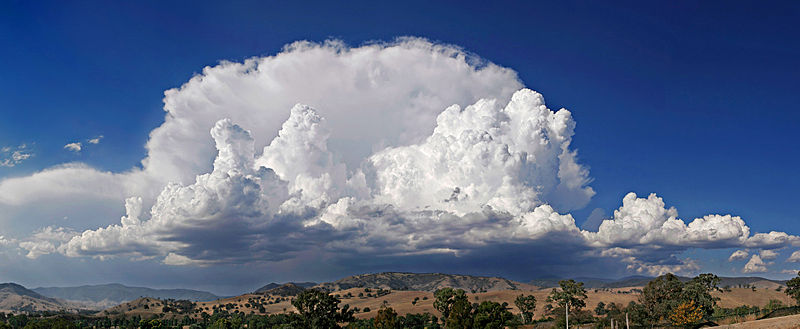
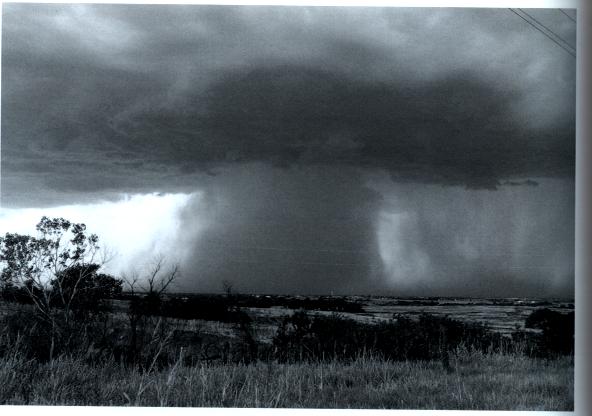
The photograph below (taken near Swifts Creek, Victoria
(Australia) by fir0002 | flagstaffotos.com.au
) shows a mature thunderstorm with an anvil in the
background. New thunderstorms are trying to develop in
the foreground (this photo was in a Wikipedia
article about thunderstorms)
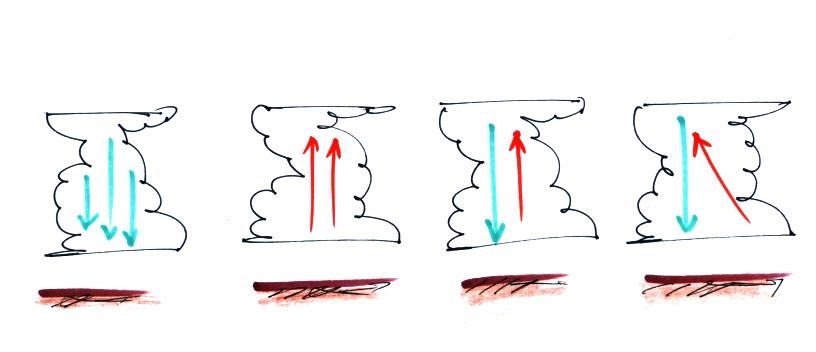
Here's a sketch of 4 thunderstorm clouds, what information
could you add to each picture.
Click here
to see the answer
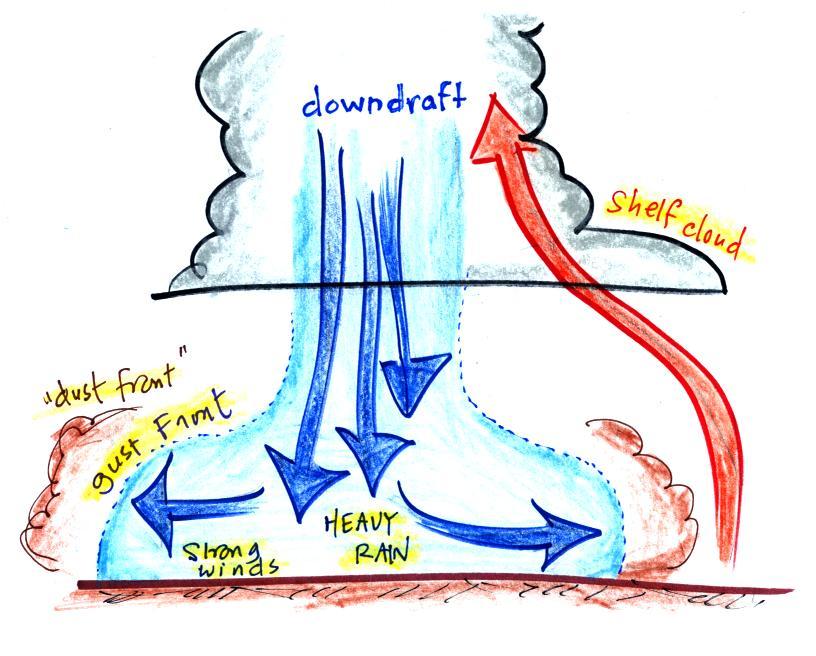
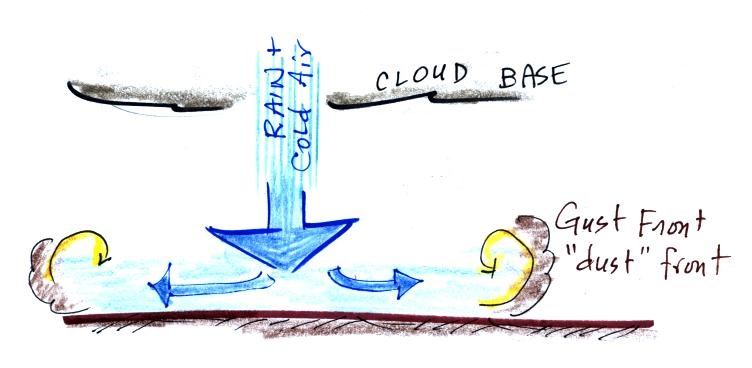
Gust fronts and the dust storms (haboobs) they can
produce
The picture below shows some of the features at the base of a
thunderstorm (I got a little carried away with the colored
pencils).
The cold downdraft air spilling out of
a thunderstorm hits the ground and begins to move outward from underneath the thunderstorm. The
leading edge of this outward moving air is called a gust
front. You can think of it as a dust front
because the gust front winds often stir up a lot of dust here in
the desert southwest (see below). There are
several very nice examples in Mike
Olbinski's Storm Gallery.
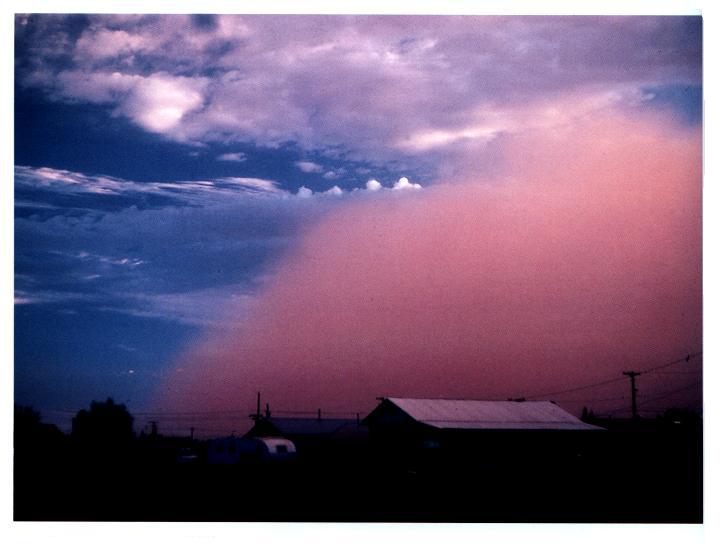
The gust front in this picture
(taken near Winslow,
Az) is moving from the right to the left.
Visibility in the dust cloud can drop to near zero which
makes this a serious
hazard to automobile traffic. Dust storms like this
are sometimes called "haboobs".
There's lots of video on YouTube of an impressive dust storm a
few summers ago. Here's an example
from Gilbert Arizona (July 5, 2011). You
can see day literally turn to night when the dust cloud is
overhead (start about 1:20). Here's another video of the same storm
from a different location (South Mountain). There are also
several time lapse videos on Mike
Olbinski's Time Lapse Gallery page.
Here's a video
from a summer 2012 dust storm captured from the front window
of a vehicle that drove through the storm. Check the last
minute or two of the video where visibility drops to near zero
(about 9:00 minutes into the video). Officials recommend
that you drive off the highway under conditions like this, turn
off your lights, and take your foot off the brake so that your
brake lights are not on (otherwise someone might follow your
lights thinking you're still on the highway and run into you from
behind).
Microbursts
Thunderstorm downdraft winds can be a serious hazard whether they
stir up dust or not.
A narrow intense
thunderstorm downdraft is called a microburst. At the
ground microburst winds will sometimes reach 100 MPH or more
(over a limited area). As we will see most tornadoes have
winds of 100 MPH or less. Microburst winds can damage
homes (especially mobile homes that aren't tied to the ground),
uproot trees, and seem to blow over a line of electric power
poles at some point every summer in Tucson. Wind damage from a microburst is
often incorrectly attributed to a tornado.
Microbursts
are a serious threat to aircraft especially when they are close
to the ground during landing or takeoff. Microburst
associated wind shear was largely responsible for the crash of Delta
Airlines Flight 191 while landing at the Dallas Fort Worth
airport on Aug. 2, 1985 (caution some of the links at the end of
the article contain audio of actual cockpit communications).
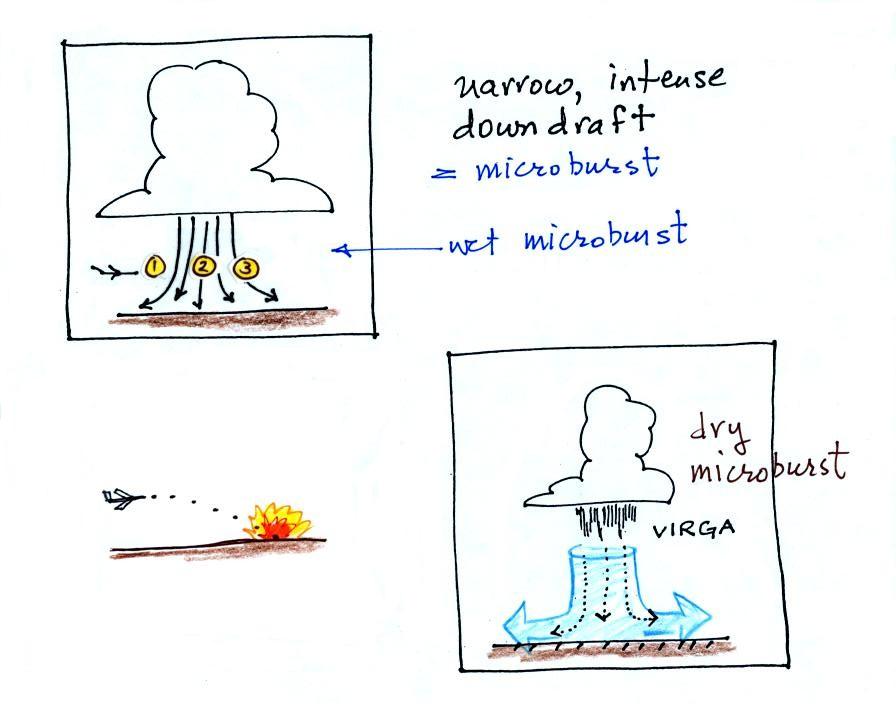
Falling rain could warn of a
wet microburst (see photo below). In other cases, dangerous dry microburst winds might be
invisible (the virga, evaporating
rain, will cool the air, make the air more dense, and strengthen
the downdraft winds).
Here are a couple of microburst
videos. The first video
was taken in the heavy rain and strong winds under a
thunderstorm in the microburst. You'll see a power pole
snapped in half by the microburst winds at about 2:26 into the
video. We'll look at portions of a 2nd longer
video in class. It was taken in or near San Tan,
Arizona. The microburst doesn't look too impressive at the
start of the footage but the storm winds soon get pretty violent
(at about the 3:15 point in the video) and winds were strong
enough to break the trunks of at least one tree (6:45 into the
video). It is probably more common to see recently planted
trees uprooted.
This is about as far as we got in class
on Thursday. There are a couple or three videos above
that I'll show in class and we'll finish up the material below
at the start of class on Tuesday (Nov. 21).
Severe thunderstorms, wind shear, mesocyclones, and
wall clouds
Next I wanted to look at some of the conditions that can lead
to severe thunderstorm formation and some of the characteristics
of these storms. Severe thunderstorms last longer, grow
bigger, and become stronger than ordinary air mass
thunderstorms. They can also produce tornadoes.
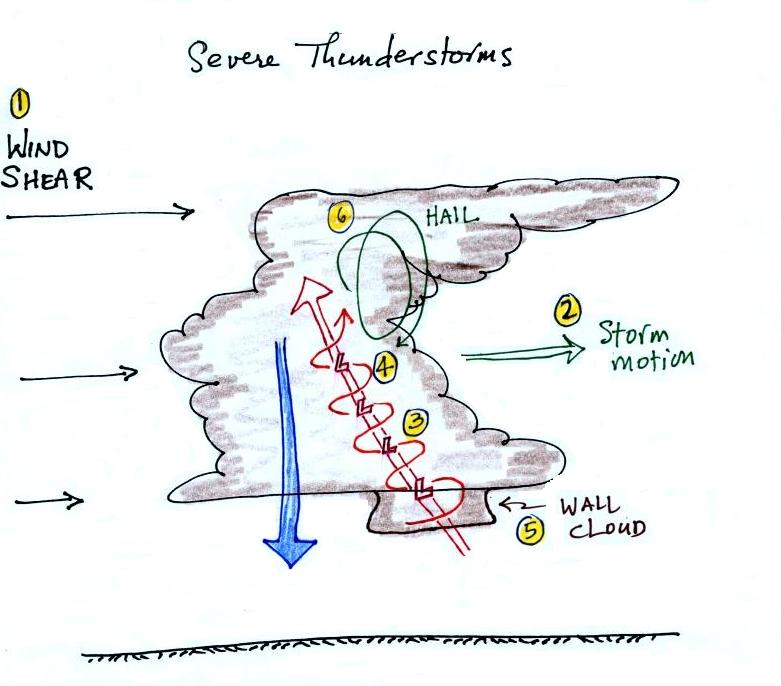
Severe storms are more likely to form
when there is vertical wind shear (the picture above is on p.
154a in the ClassNotes). Wind shear (Point 1)
is changing wind direction and/or wind speed with
distance. In the case shown above, the wind speed is
increasing with increasing altitude, this is vertical wind
shear.
A thunderstorm that forms in this kind of an environment will move at an average of
the speeds at the top and bottom of the cloud (Point 2). The
thunderstorm will move to the right more rapidly than the air
at the ground which is where the updraft begins. Rising
air that is situated at the front bottom edge of the
thunderstorm will find itself at the back edge of the storm
when it reaches the top of the cloud.
This produces a tilted updraft (Point 3). The downdraft
is situated at the back of the ground. The updraft is
continually moving to the right and staying away from the
downdraft. The updraft and downdraft coexist and do not
"get in each others way." If you remember in air mass
thunderstorms, the downdraft gets in the way of the updraft
and leads to dissipation of the storm.
Sometimes
the tilted updraft will begin to rotate. A rotating
updraft is called a mesocyclone (Point
4). Meso
refers to medium size (thunderstorm size) and cyclone means
winds spinning around low pressure (tornadoes are sometimes
called cyclones). Low pressure in the core of the mesocyclone creates an inward pointing
pressure gradient force needed to keep the updraft winds
spinning in circular path.
The cloud that extends below the cloud
base and surrounds the mesocyclone
is called a wall cloud
(Point 5). The
largest and strongest tornadoes will generally come from the
wall cloud.
Note (Point 6)
that a tilted updraft also provides a way of keeping growing
hailstones inside the cloud. Hailstones get carried up
toward the top of the cloud where they begin to fall. But they then fall back into the strong core
of the updraft and get carried back up toward the top of the
cloud.
Here is a link to an exceptional time lapse video
of a supercell thunderstorm in Texas (from Mike Olbinski).
Find the Supercell near Booker, Tx frame near the bottom of the
page. In time lapse you can see the rotation of the wall
cloud. If you watch closely you'll see another interesting
feature: moisture from air in the downdraft that reaches the
ground is drawn into the thunderstorm updraft (starting at about
0:38 in the video up until the end of the first segment of
video). As the downdraft air moves upward cloud begins to
form.
It is worth trying to understand why the wall cloud surrounds the
mesocyclone and why it extends below the rest of the cloud.
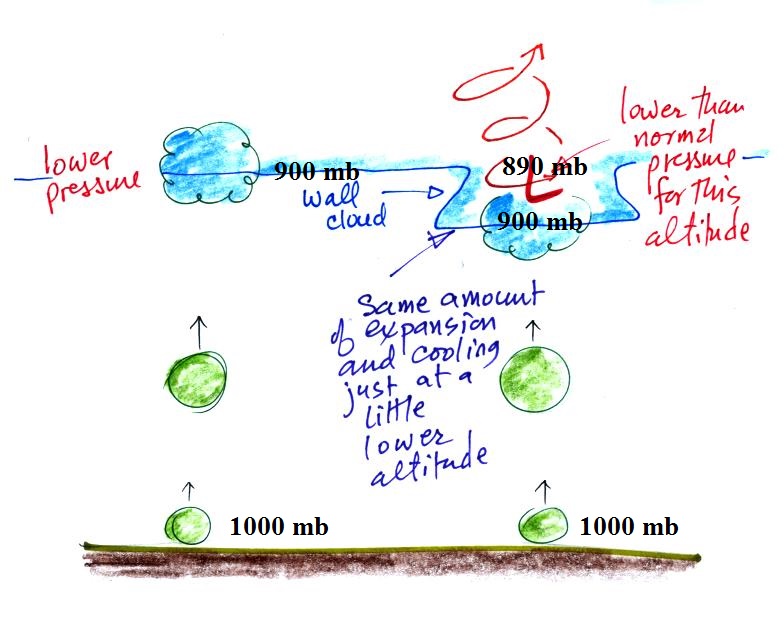
Air in the center of the rotating updraft has a little
lower pressure than the air surrounding it at the same
altitude. I've assumed that the pressure in the middle
of the mesocyclone at cloud base altitude is 890 mb. In
this part of the picture 900 mb pressure is found a little bit
closer to the ground. Thus air that rises into the
rotating updraft doesn't have to go as high before it
encounters 900 mb pressure and has expanded and cooled enough
to form a cloud.
A similar kind of thing happens in the formation of a tornado
cloud.
Weather radar and "hook
echoes"
Thunderstorms with rotating updrafts and supercell thunderstorms
often have a distinctive radar signature called a hook echo.
This is one of the ways that scientists are now able to
better detect and warn of tornadic thunderstorms
We haven't discussed
weather radar in this class. In some ways a radar image of
a thunderstorm is like an X-ray photograph of a human body.
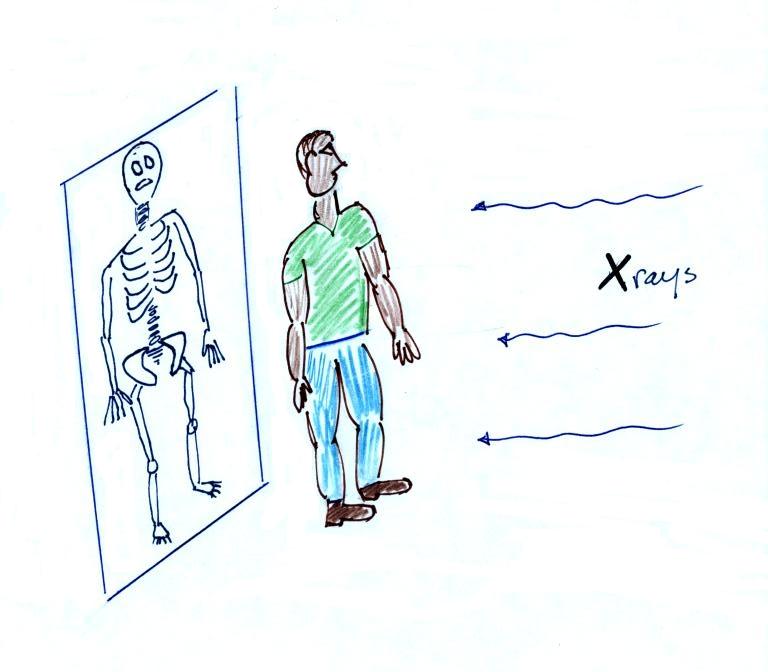
An X-ray image of a person doesn't usually
show the entire body, often just the bones and skeleton
inside.
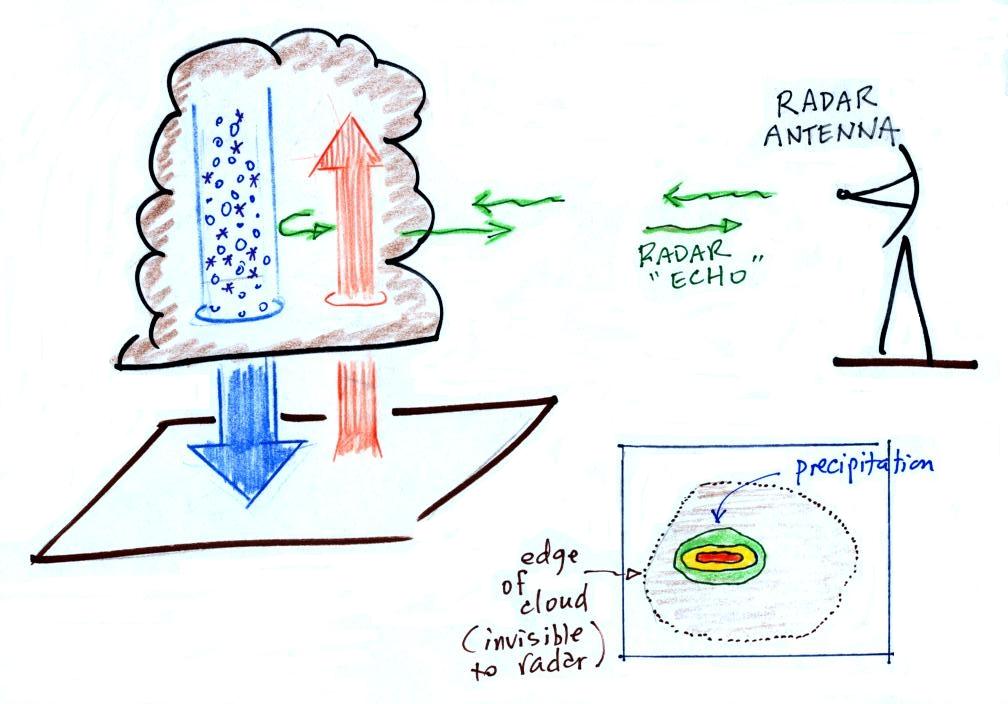
The
radio signals emitted by radar pass through the cloud itself
but are reflected by the much larger precipitation
particles. The radar keeps track of how long it takes for the
emitted signal to travel out to the cloud, be reflected, and
return to the radar antenna. The radar can use this to
determine the distance to the storm. It also knows the
direction to the storm and can locate the storm on a
map. The intensity of the reflected signal (the echo) is
often color coded. Red means an intense reflected signal
and lots of large precipitation particles. The edge of
the cloud isn't normally seen on the radar signal.
The amount and intensity of the precipitation is sometimes used
in Tucson during the summer to issue a severe thunderstorm
warning.
A Doppler radar (something we didn't
discuss in class) can detects small shifts in the
frequency of the reflected radar signal caused by precipitation
moving toward or away from the radar antenna. This can be
used to determine wind speeds inside the tornado.
Below is an actual radar image with a prominent hook
echo. The hook is evidence of large scale rotation inside
a thunderstorm and means the thunderstorm is capable of, and may
already be, producing tornadoes.
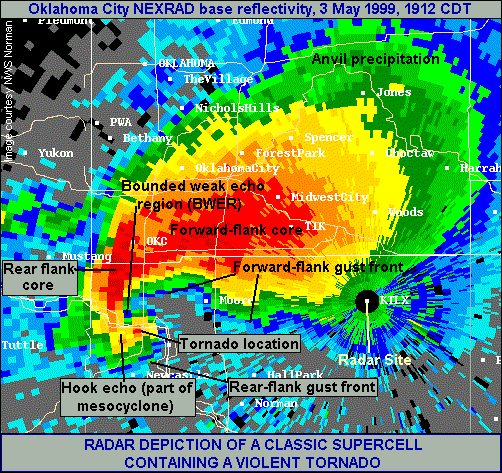
This is the radar image of a thunderstorm that
produced a very strong tornado that hit Oklahoma
City in May 1999
. The hook echo is visible near the lower left
hand corner of the picture. Winds in the tornado
may have exceeded 300 MPH. You can read more about this
tornado here.
And here is some storm chase
video of the tornado.