Thermal Circulations and
the 3-cell Model of the Earth's Global Scale Circulation
Pattern
Just as with water draining from a toilet bowl or a sink,
there are small scale circulations where the the Pressure
Gradient force is so much stronger than the Coriolis force
that the CF can be ignored.
The pressure differences are created by differences in
temperature (such as you might find between a
coast and the ocean or between a city and the surrounding country
side). The horizontal pressure gradient can then produce a wind
flow pattern known as a thermal circulation.
By applying some of the
concepts we learned earlier in the semester we can really
understand pretty thoroughly how thermal circulations develop.
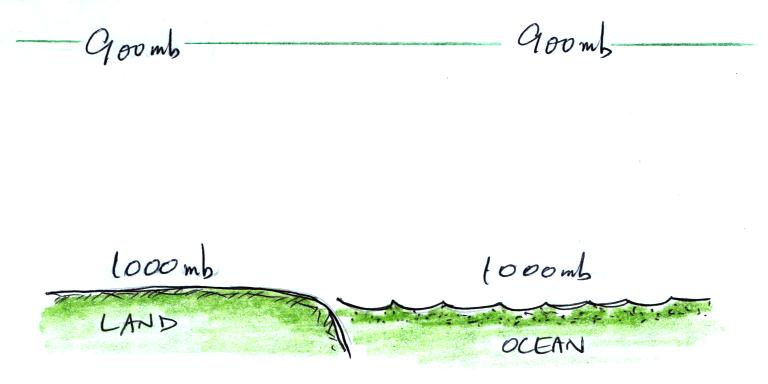
We'll start here along a sea coast. In this picture
the air temperatures and pressures on both sides of the
picture are the same.
Next we'll warm part of the picture and see what effect that
has.
Let's warm the left side of the picture. A beach will
often become much warmer than the nearby ocean during the day
(the sand gets hot enough that it is painful to walk across in
bare feet).
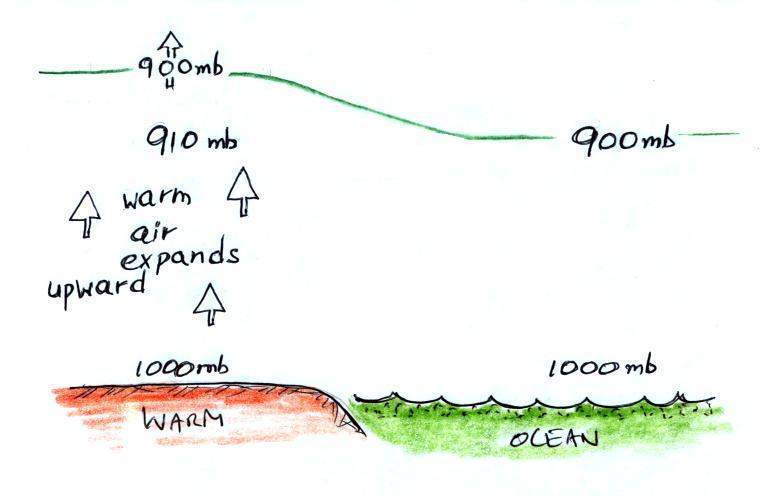
The air above the warm sand will warm and expand upward.
Note how the 900 mb level has moved upward on the warm side of
the picture. We find 910 mb pressure above the land at the
same level where we earlier had 900 mb.
We've left the temperature of the ocean water the same.
The height of the 900 mb level above the ocean hasn't
changed. We have 910 mb pressure over the land at the same
altitude as we find 900 mb over the ocean.
.
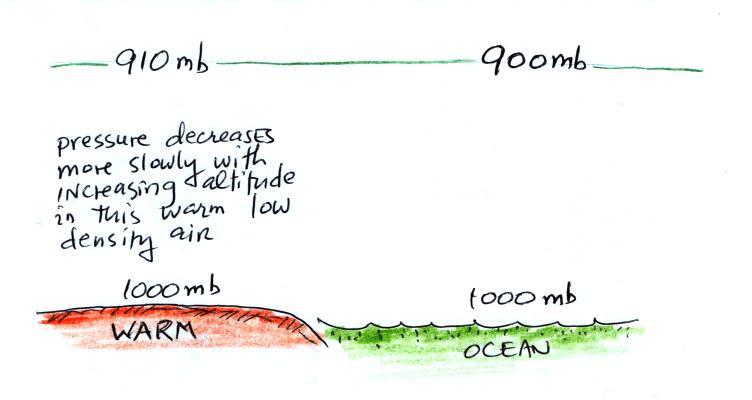
Here's another way of arriving at the same result. We need
to remember that pressure decreases relatively slowly in warm
low density air. There is only a 90 mb drop between the
ground and the green line on the left side of the picture.
Pressure decreases more rapidly with altitude (a 100 mb drop) in
the cooler higher density air on the right side. We end up
with the same upper level pressure gradient.
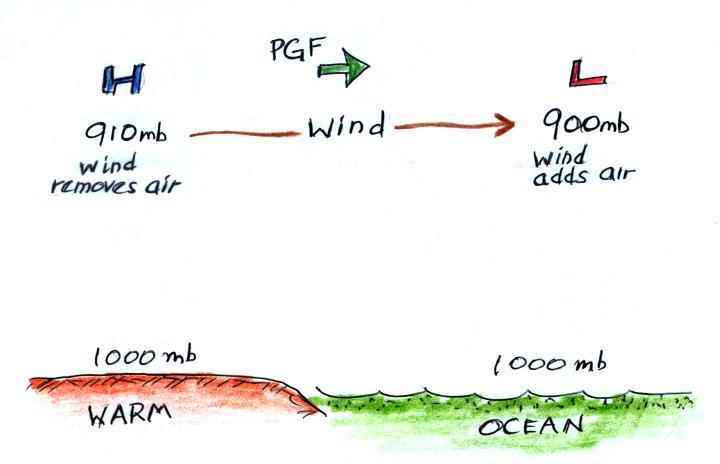
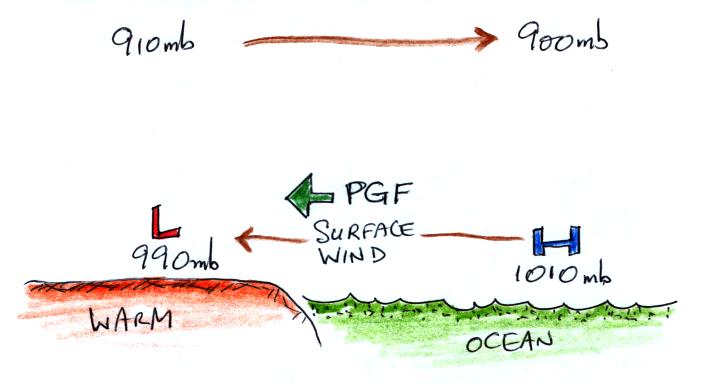
The temperature differences have created an upper level pressure
gradient (pressure difference), higher pressure (910 mb) on the
left and lower pressure (900 mb) on the right. The
resulting PGF causes air to start to blow from left to right.
Once the air aloft begins to move it will change the surface
pressure pattern. The air leaving the top left side of the
picture will lower the surface pressure (from 1000 mb to 990
mb). Adding air at to the upper right side of the picture
will increase the surface pressure (from 1000 mb to 1010
mb). Air motions above the ground have created a surface
pressure gradient. Surface winds will begin to blow from
right to left.
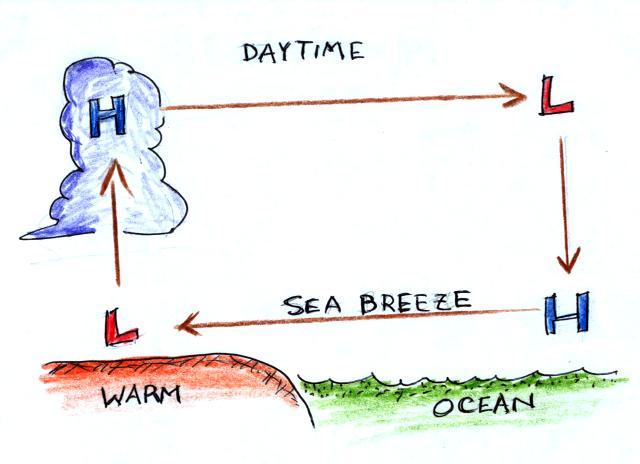
You can complete the circulation loop by adding rising air
above the surface low pressure at left and sinking air above the
surface high at right. The surface winds which blow from
the ocean onto land are called a sea breeze (meteorologists
always try to specify where the wind is coming from).
Since this air is likely to be moist, cloud formation is likely
when the air rises over the warm ground. Rising air
expands and cools. If you cool moist air to its dew point,
clouds form.
It is pretty easy to figure the directions of the winds in a
thermal circulation without going through a long-winded
development like this. Just remember that warm air rises.
Draw in a rising air arrow above the warm part of the picture,
then complete the loop.
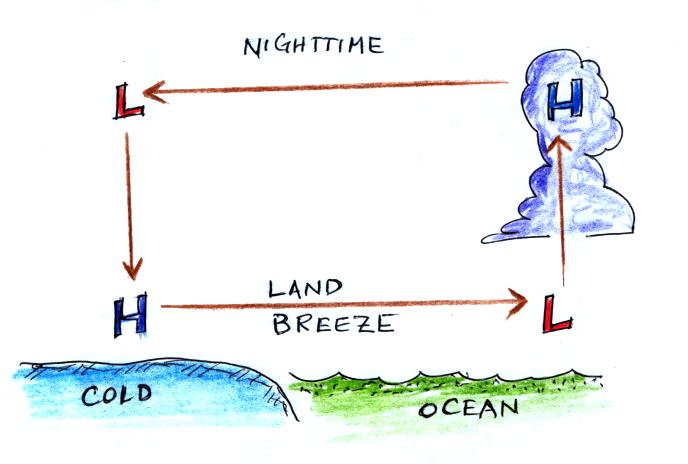
At night the ground cools more quickly than the ocean and
becomes colder than the water. Rising air is found over
the warmer ocean water (sea below). The thermal
circulation pattern reverses direction. Surface winds blow
from the land out over the ocean. This is referred to as a
land breeze.
I've stuck some additional examples at the end of this section
just in case you're interested. You'd won't need to be
familiar with that material in order to answer questions on the
Optional Assignment.
Next we will use basic concept of a thermal
circulation
to
learn about global scale pressure and wind patterns.
Ordinarily you couldn't apply a small scale phenomena like a
thermal circulation to the much larger global scale. However
if we make some simplifying assumptions, particularly if we assume
that the earth doesn't rotate or only rotates slowly, we can
ignore the Coriolis force and a thermal circulation could become
established.
Some additional simplifications are also made and are listed
below.
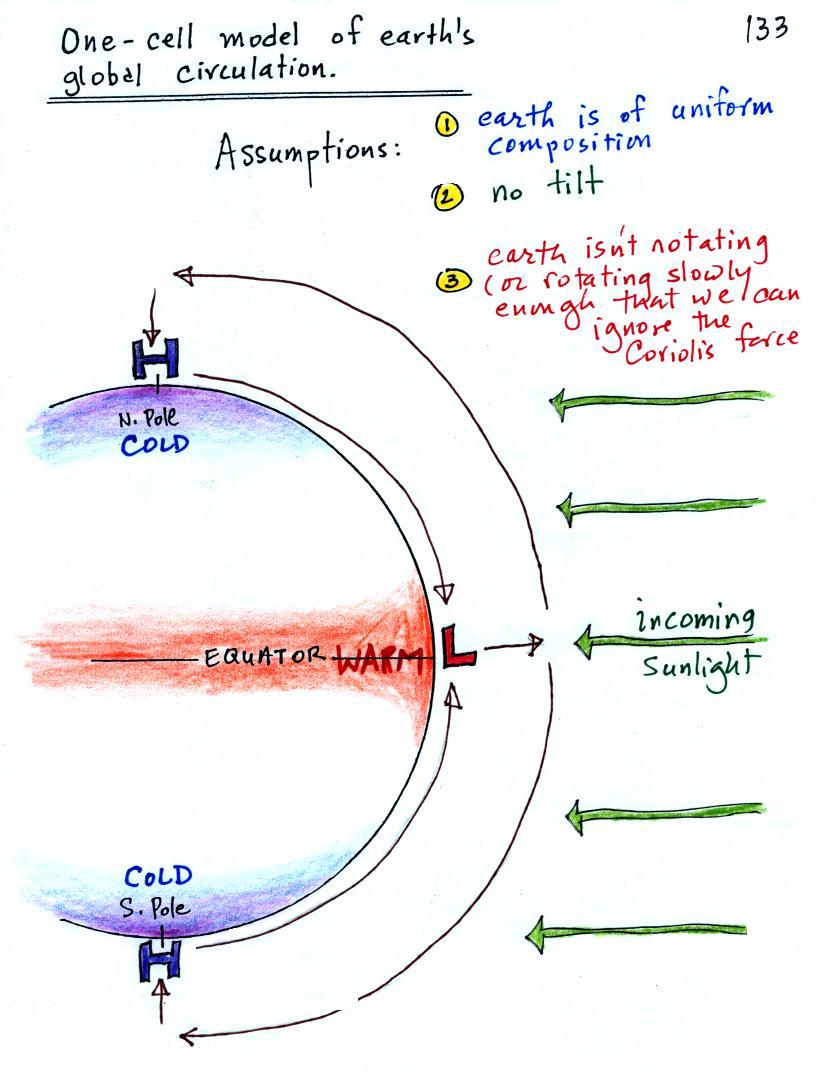
Because the earth isn't tilted, the incoming sunlight
shines on the earth most directly at the equator. The
equator will become hotter than the poles. By
allowing the earth to rotate slowly we spread this warmth out in a
belt that circles the globe at the equator rather than
concentrating it in a spot on the side of the earth facing the
sun. Because the earth is of uniform composition
there aren't any temperature differences created between oceans
and continents.
If you remember the short cut that applies to thermal circulations
"warm air rises" you can drawn a rising arrow above the
equator. Then you just complete the loop. Actually
there are two loops, one in the northern hemisphere and the other
in the southern hemisphere. This is the 1-cell model
or 1-cell representation of the earth's global scale circulation
pattern. The term one cell just means there is one complete loop in the
northern hemisphere and another in the southern hemisphere.
Next we will remove the assumption concerning the rotation of
the earth. We won't be able to ignore the Coriolis force
now.
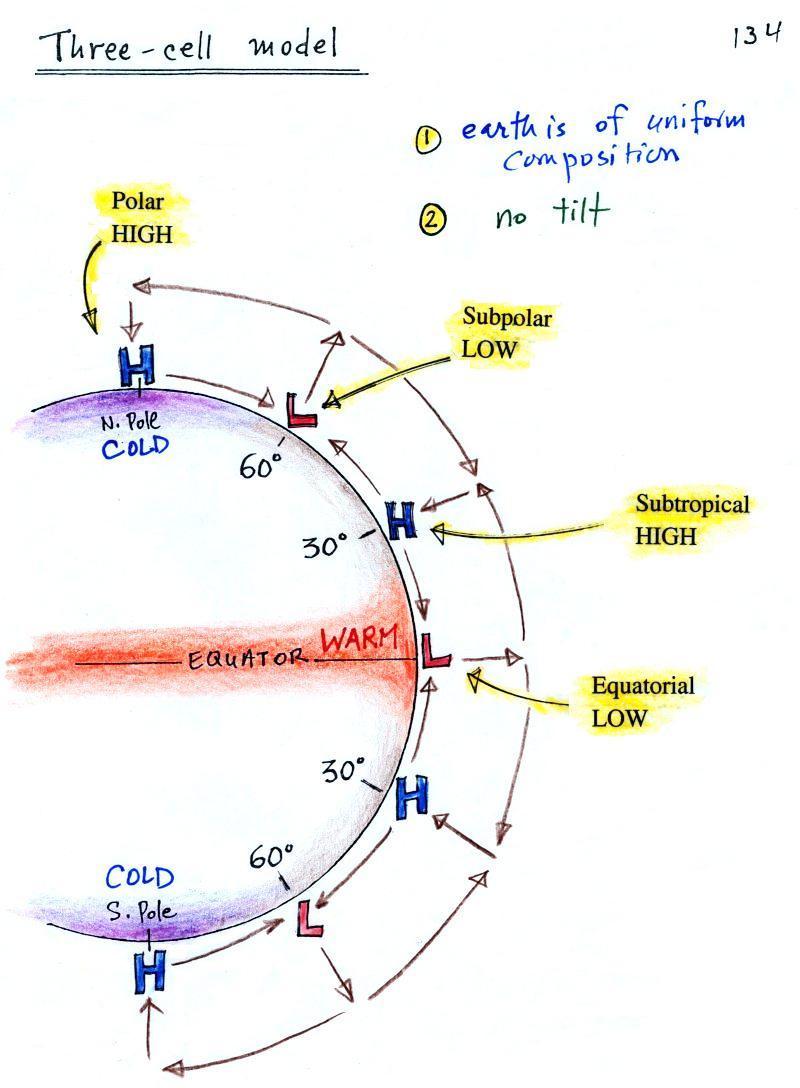
Here's what a computer would predict you would now see on the
earth. Things are pretty much the same at the equator in the
three cell and one cell models: surface low pressure and rising
air. At upper levels the winds begin to blow from the
equator toward the poles. Once headed toward
the poles the upper level winds are deflected by the Coriolis
force. There end up being three closed loops in the northern
and in the southern hemispheres. There are
surface belts of low pressure at the equator (the equatorial low) and at 60 degrees
latitude (the subpolar low). There are belts of high pressure (the
subtropical high) at 30 latitude and high pressure centers at the
two poles (the polar highs).
We're going to concentrate on just the surface features
(pressure belts and the winds that develop in between).
Even with the unrealistic simplifying assumption, much of what is
predicted by the 3-cell model is actually found on the earth.
Here's a map view of the region between 30 S and 30 N
latitude. We're looking down from above at the earth's
surface.
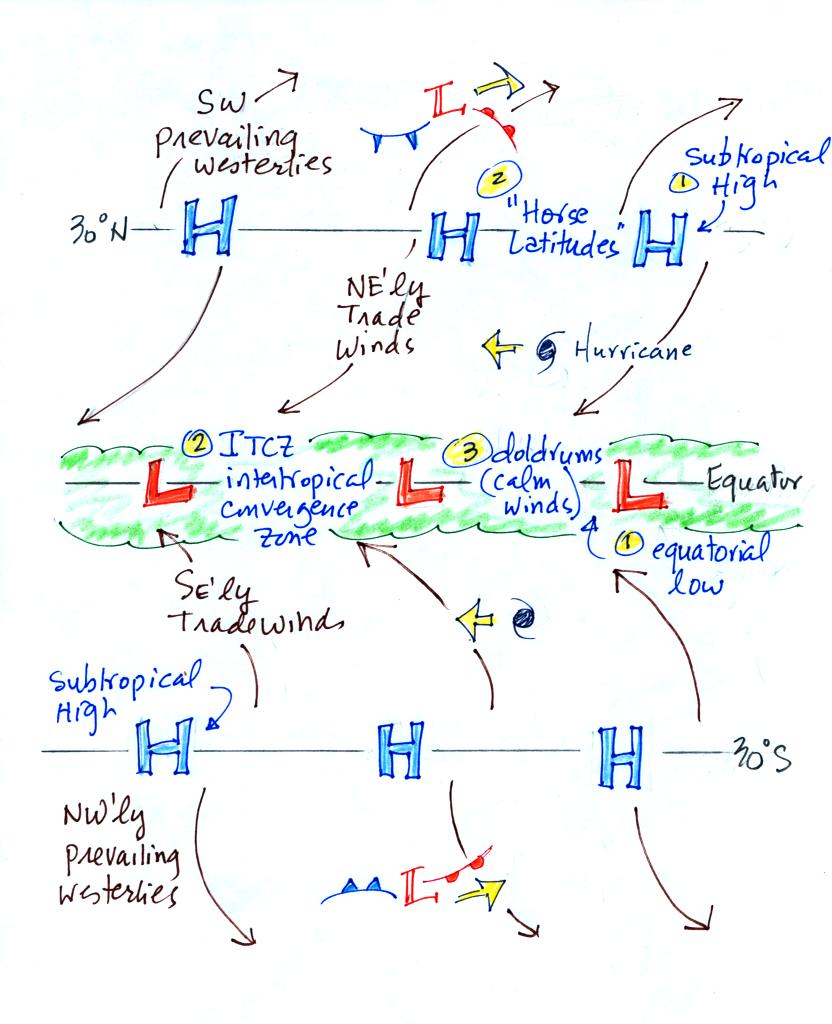
There's a lot of information on this picture, but with a
little study you should be able to start with a blank sheet of
paper and reproduce this figure. I would suggest starting at
the equator. You need to remember that there is a belt of
low pressure found there. Then remember that the pressure
belts alternate: there are belts of high pressure at 30 N
and 30 S.
Let's start at 30 S. Winds will begin to blow from High
pressure at 30 S toward Low pressure at the equator. Once
the winds start to blow they will turn to the left because of the
Coriolis force. Winds blow from 30 N toward the equator and
turn to the right in the northern hemisphere (you need to turn the
page upside down and look in the direction the winds are
blowing). These are the Trade
Winds (northeasterly trade winds north of the equator and
southeasterly trades south of the equator). They converge at
the equator and the air there rises (refer back to the cross
sectional view of the 3-cell model). This is the cause of the band
of clouds that you can often see at or near the equator on a satellite
photograph.
The Intertropical Convergence Zone or ITCZ is another name for the
equatorial low pressure belt. This region is
also referred to as the doldrums because it is a region where
surface winds are often weak. Sailing ships would sometimes
get stranded there hundreds of miles from
land. Fortunately it is a cloudy and rainy region so
the sailors wouldn't run out of drinking water (they might well
have run out of rum though which might have been worse).
Hurricanes form over warm ocean water in the subtropics between
the equator and 30 latitude. Winds at these latitudes have a
strong easterly component and hurricanes, at least early in their
development, move from east to west. Middle latitude storms
found between 30 and 60 latitude, where the prevailing westerly wind belt is found, move from
west to east.
You find sinking air, clear skies, and weak surface winds
associated with the subtropical high pressure belt. This is
also known as the horse latitudes. Sailing ships could
become stranded there also. Horses were apparently either
thrown overboard (to conserve drinking water) or eaten if food
supplies were running low (at least that's the story I've heard,
Wikipedia has a different
explanation). Note that sinking air is associated with
the subtropical high pressure belt so this is a region on the earth where skies are clear (Tucson is
located at 32 N latitude, so we are strongly affected by the
subtropical high pressure belt).
The winds to the north of 30 N and to the south of 30 S are called
the "prevailing westerlies." They blow from the
SW in the northern hemisphere and from the NW in the southern
hemisphere. The 30 S to 60 S latitude belt in the southern
hemisphere is mostly ocean. Because there is less friction
over the oceans, the prevailing westerlies there can get strong,
especially in the winter. They are sometimes referred to as
the "roaring 40s" or the "ferocious 50s" (the 40s and 50s refer to
the latitude belt they are found in).
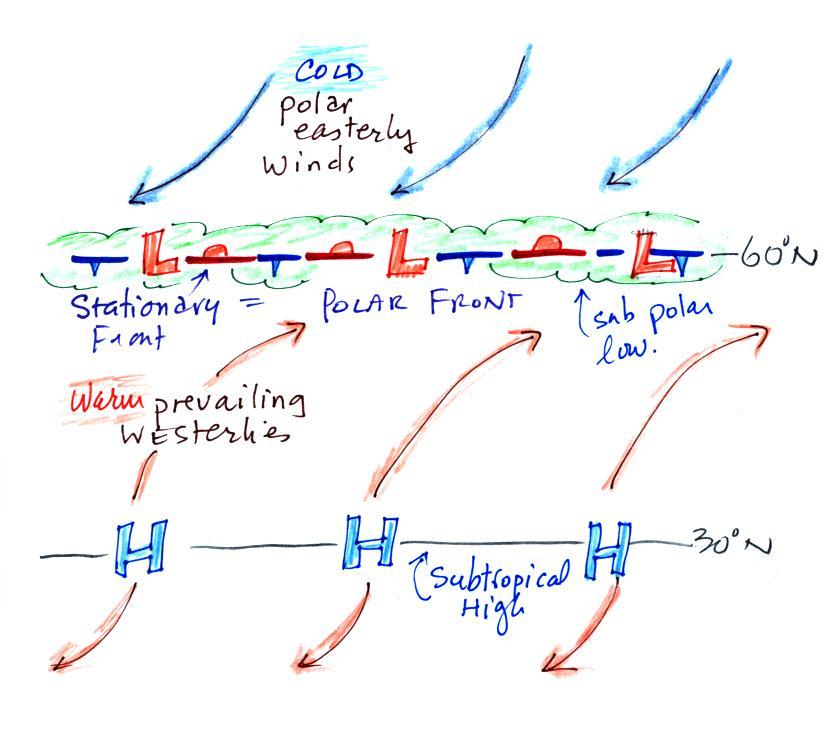
Here's another surface map, it's a little simpler because we're
just looking from about 30 N to a little bit past 60 N.
Winds blowing north from H pressure at 30 N toward Low pressure at
60 N turn to the right and blow from the SW. These are the
"prevailing westerlies." The polar easterlies are cold
winds coming down from high pressure at the north pole. The
subpolar low pressure belt is
found at 60 latitude. This is also a convergence
zone where the cold polar easterly winds and the warmer prevailing
westerly winds meet. The boundary between these two
different kinds of air is called the polar front and is often
drawn as a stationary front on weather maps. A strong current of winds
called the polar jet stream is found overhead. Strong middle
latitude storms will often form along the polar front.
Now a quick comparison of predicted 3-cell model features and
corresponding features found in the real world.
|
|
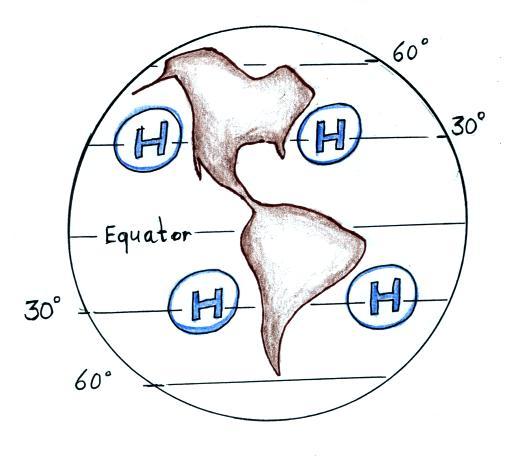
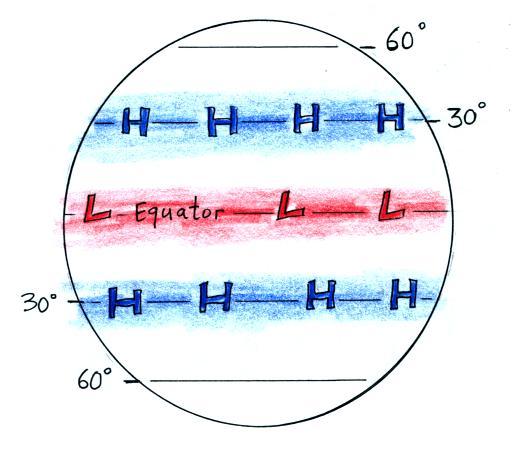
The 3-cell model assumes that
the earth is of uniform composition and not tilted toward or
away from the sun. It predicts belts of high
pressure at 30 N and 30 S latitude as shown above at left.
Because the real world has oceans and continents we find centers
of high pressure, not belts, located near 30 latitude.
They move north and south of 30 degrees during the year as the
N. Pole tilts toward and away from the sun.
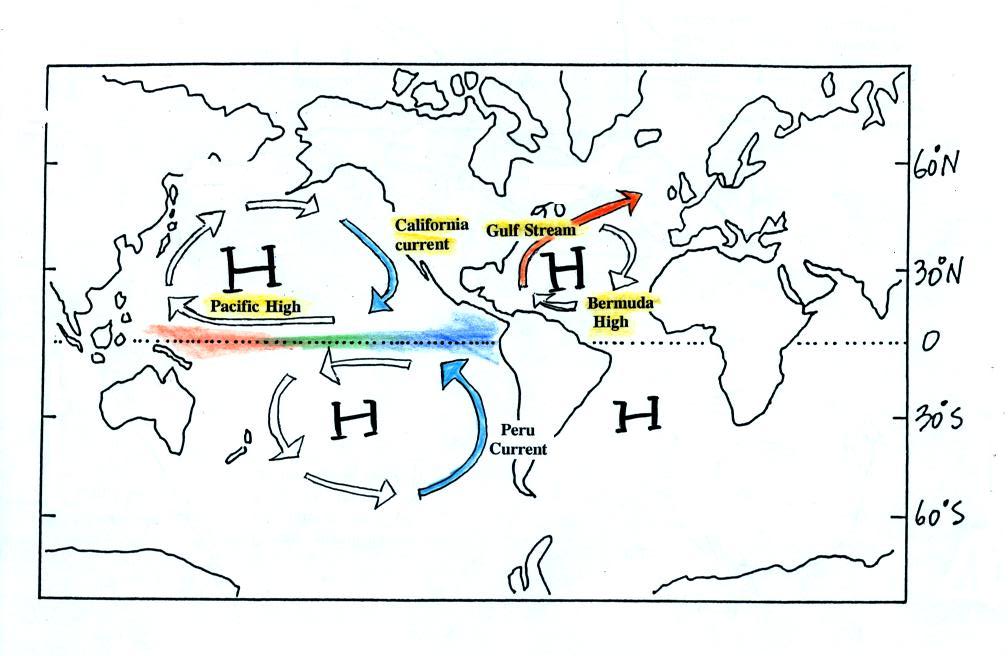
This is shown a little more detail on the figure below.
The high pressure center off the East Coast of the US is
called the Bermuda High. The Pacific High is found off the
west coast. Don't worry about the names of the Highs off
the east and west coasts of South America.
Winds blowing around these centers of high pressure
create some of the world's major ocean currents.
Clockwise winds around the Pacific High create the California
current, a cold southward flowing current found off the west
coast of the US. The Gulf Stream is the warm northward
flowing current along the east coast.
The El Nino phenomenon is described at the end of this
section. Ocean water in the equatorial Eastern Pacific is
normally cold. The water warms as it moves westward.
This temperature pattern is shown above. You can now
better understand why this is true. Two cold ocean
currents, the California current north of the equator and its
analog in the southern hemisphere meet at the equator in the
eastern Pacific. That is why the water there is so
cold. During an El Nino event the two cold ocean currents
stop short of the equator. The ocean water temperature
pattern basically reverses. This has a profound effect on
weather around the globe.
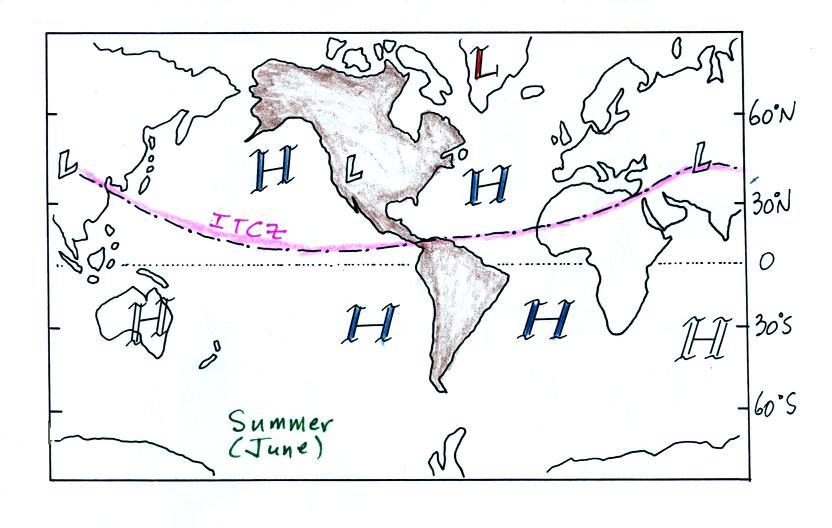
The following two pictures show how the 3-cell models
features move during the season.
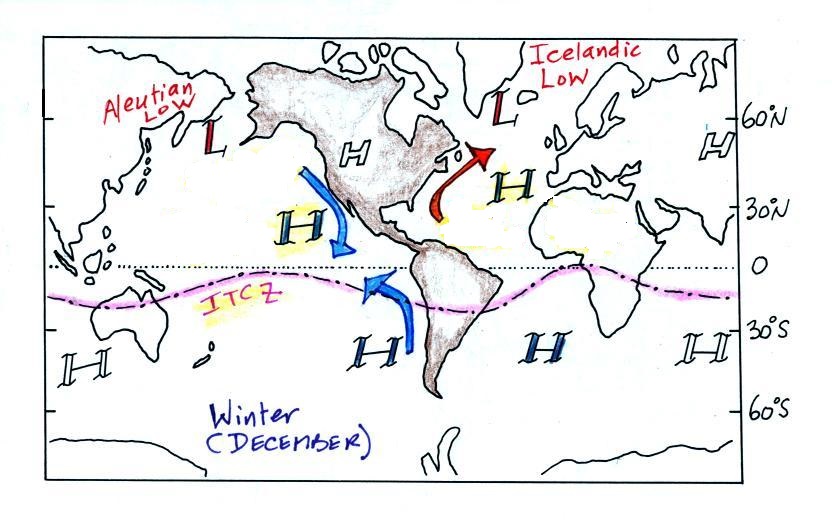
This is a winter picture
(northern hemisphere winter, the North Pole is tilted away from
the sun). All of the 3-cell model features have moved
south of their nominal locations. The intertropical
convergence zone (ITCZ) which is normally at the equator has
moved south of the equator.
Here's the summer picture (North Pole tilted toward the
sun). The ITCZ has moved north of the equator.
The movement of the Pacific High north and south of its nominal
position near 30 degrees latitude is part of what causes our
summer monsoon in Arizona.
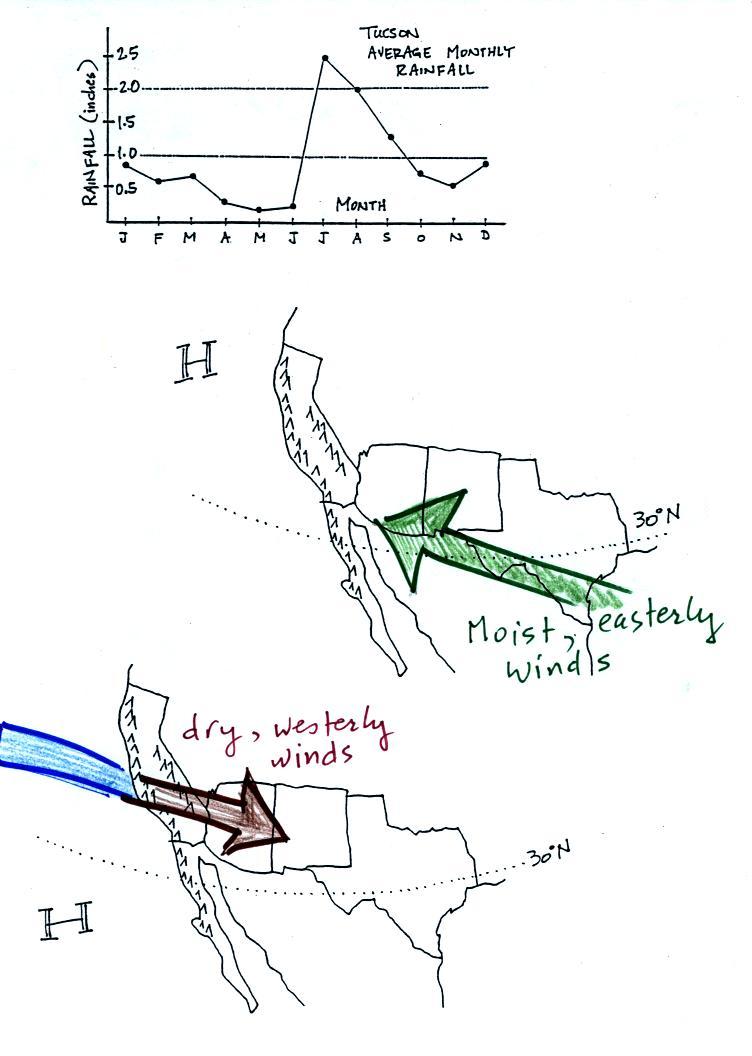
In the winter the Pacific High is
found south of 30 N latitude (the bottom of the figure
above). Winds to the north of the high blow from the
west. Air originating over the Pacific Ocean is moist
(though the coastal water is cold so this air isn't as moist as it
would be if it came off warmer water). Before reaching
Arizona the air must travel over high mountains in
California. The air loses much of its moisture as it does
this (remember the rain shadow effect). The air is pretty
dry by the time it reaches Arizona. Significant winter rains
occur in Arizona when storms systems are able to draw moist
subtropical air from the southwest Pacific ocean into Arizona.
During the summer, the
Pacific High moves north of 30 N latitude. Winds on the
southern side of the subtropical high have an easterly
component. Moist air originating in Mexico and from
over warm water in the Gulf of Mexico blows into Arizona.
The sun heats the ground during the day, warm moist air in contact
with the ground rises and produces convective thunderstorms.
Tucson gets about 12 inches of
rain in a normal year. About half of this comes during the
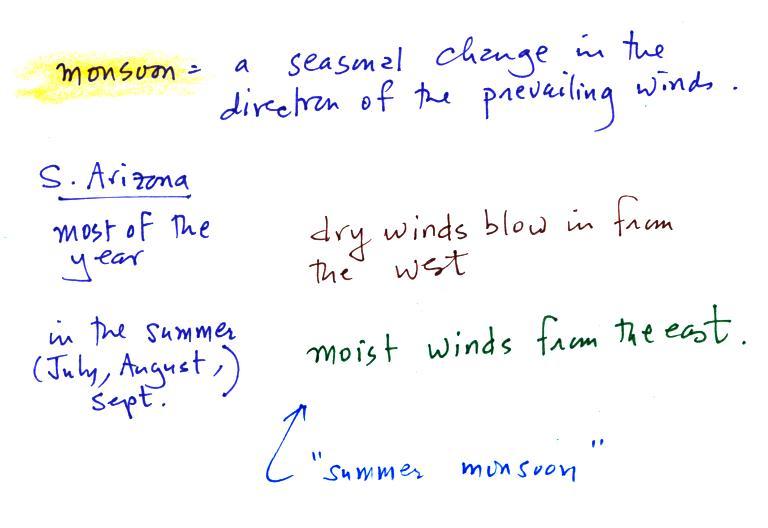
"summer monsoon" season. The word monsoon, as you can learn
below, refers to a seasonal change in wind direction. It is
often used incorrectly in S. Arizona to refer to a thunderstorm.
That's the end of the
material you'll need to read to be able to answer the
questions on the Optional Assignment. There
is some additional material below - examples where remembering the
basic concept of a thermal circulation can help you understand a
variety of other wind circulation patterns.
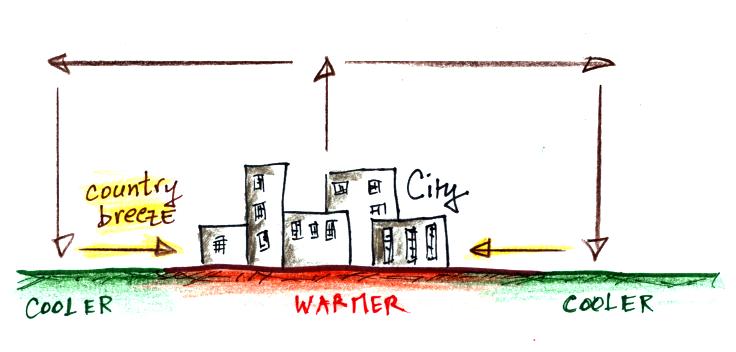
Cities are often warmer than the
surrounding countryside, especially at night. This is
referred to as the urban
heat island effect. This difference in temperature
can create a "country breeze." This will
sometimes carry pollutants from a factory or odors
from a sewer treatment plant located outside the city
back into town.
The Asian monsoon is a large scale circulation pattern and is
much more complex than a simple thermal circulation.
However you can use the thermal circulation concept to get a
general understanding of what to expect at different times of
the year. Before looking at that let's be
clear about the meaning of the term monsoon.
Monsoon just refers to a seasonal change in the direction of the
prevailing winds. Most of the year in Arizona winds come
from the west and are dry. For 2 or 3 months in the summer
winds come from the south and southeast. This
is when we get our summer thunderstorm season or summer
monsoon.
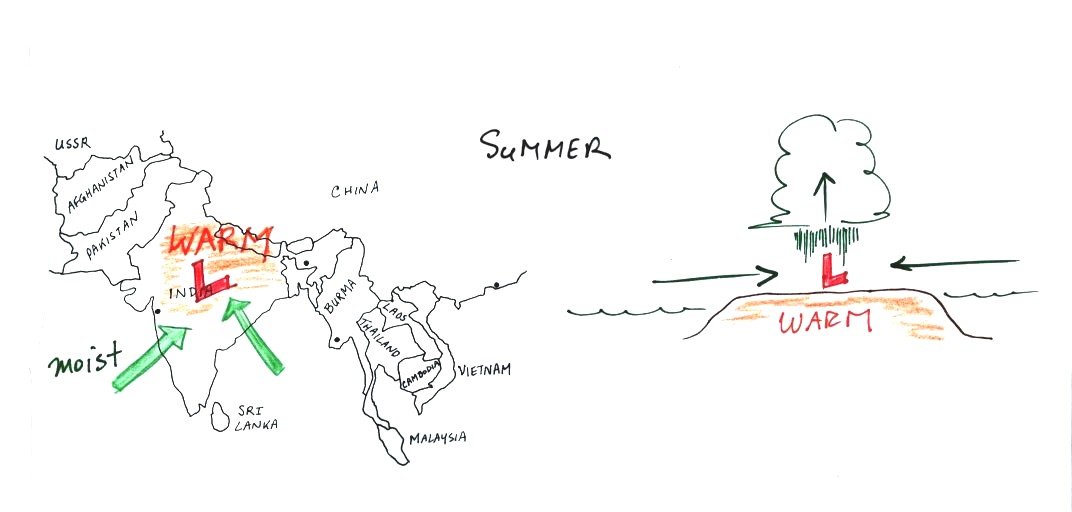
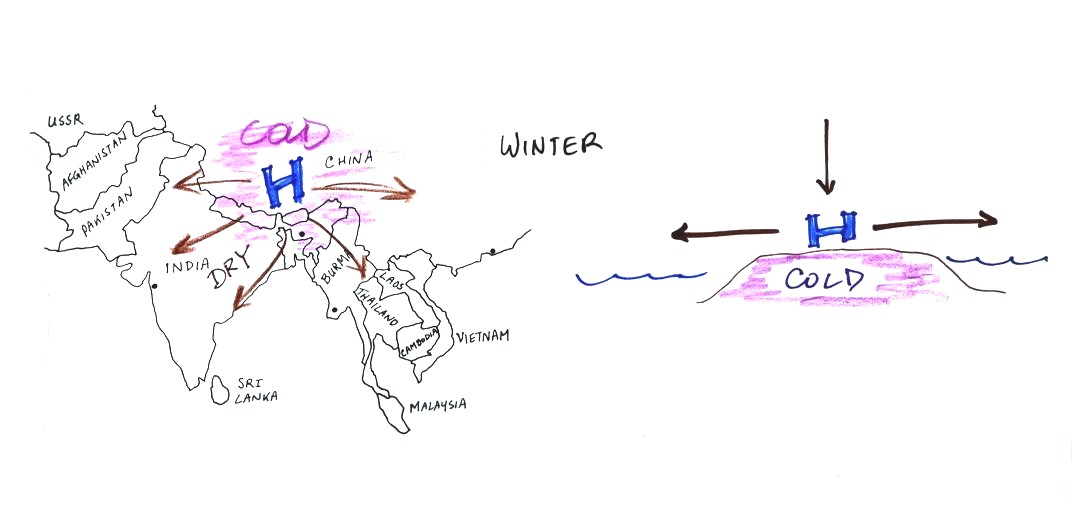
In the summer land masses in India and Asia become warmer than
the oceans nearby. Surface low pressure forms over the
land, moist winds blow from the ocean onshore, and very large
amounts of rain can follow. A map view (top view) is shown
at left, a cross sectional view is shown at right (it really
just resembles a large scale sea breeze).
The winds change directions in the winter when the land
becomes colder than the ocean.
You can also use the thermal circulation to understand some
of the basic features of the El Nino phenomenon (you find a
discussion of the El Nino on pps 135-139 in the photocopied
Classnotes).
First here is what conditions look like in the tropical
Pacific Ocean in normal non-El Nino years (top and side views
again)
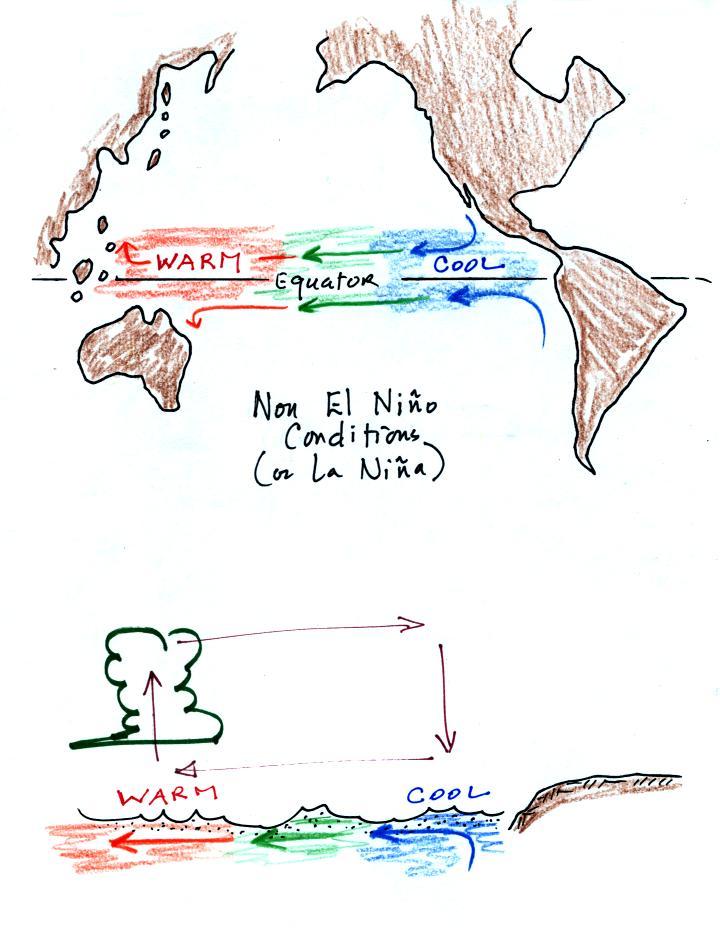
Cold ocean currents
along the west coasts of N. America and S. American normally
converge at the equator and begin to flow westward (see top
view above). As the water travels westward it
warms. Some of the warmest sea surface waters on earth
are normally found in the western Tropical Pacific (this is
also where hurricanes are most frequent). A
temperature gradient becomes established between the W. and
E. ends of the tropical Pacific. The cross sectional view
above shows the normal temperature and circulation pattern
found in the equatorial Pacific Ocean. You would
find surface high pressure in the east and low pressure in
the west. Note that the wind circulation pattern is
the same as the simple thermal circulation we studied above.
During a La Nina event, waters in the Eastern Pacific are
even colder than normal. This generally produces drier
than normal conditions during the winter in the desert SW.
You can read more about La Nina
here.
Every few years El Nino conditions occur and the
cold currents don't make it to the Equator. Warm water
is carried from the western Pacific to the eastern
Pacific. The temperature and pressure basically
reverses itself.
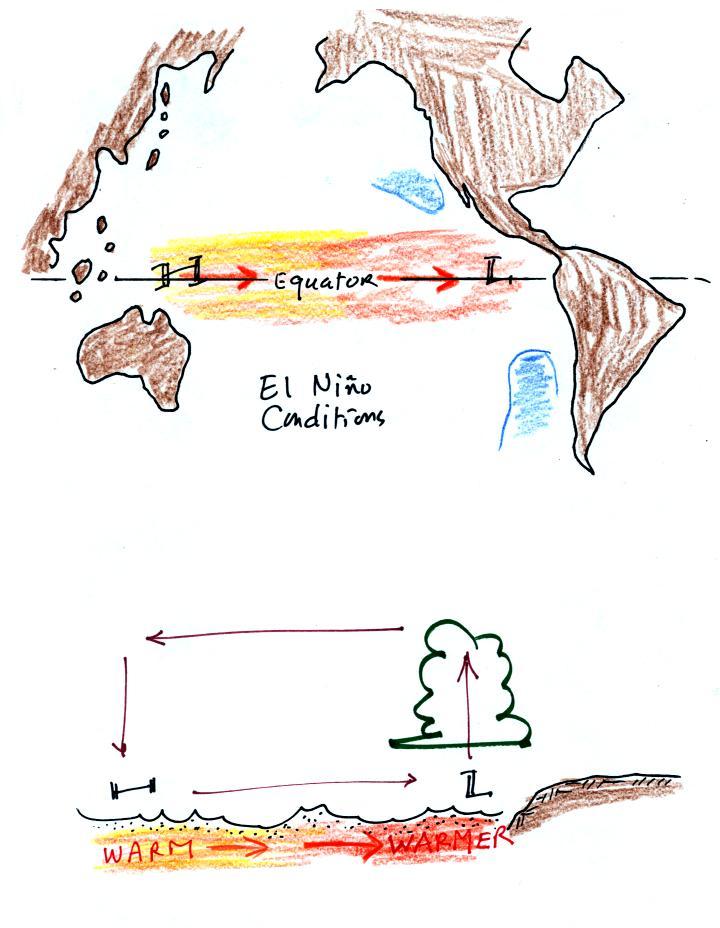
Now surface high
pressure is found in the west and surface low pressure and
rising air is found in the E. Pacific (the reversal in the
surface pressure pattern is referred to as the southern
oscillation). Indonesia and Australia often experience
drought conditions (and devastating wildfires) during El
Nino years. In the desert SW we expect slightly wetter
than normal conditions (perhaps 20% wetter than
normal). Wetter conditions are also found in
California and in the SE US.
Here's a map showing the effects of El Nino and La Nina
conditions on winter weather in N. America (source).