Thursday Nov. 21, 2013

Some melancholic music before class this morning.  Seemed appropriate given the wet and cool weather that is forecast for the next few days.  You heard several (but not all) of the following: Death Cab for Cutie "I Will Follow You Into the Dark", The Doors "Spanish Caravan", Eva Cassidy "Autumn Leaves", Lhasa De Sela "La Confession", The Wailin' Jennys "Arlington", Zoe Lewis "Barbizon" (which I wasn't able to find online).

Reasonably up-to-date grade summaries have been prepared and were handed out in class today.  They do not include the Koppen Climate Classification report scores (for those of you that turned one in) and do not include the Forces and Winds Optional Assignment which was also returned today.


Most tornadoes last a few minutes, have a path a few miles long, and move at a few 10s of MPH.  There are, of course, exceptions

This is the path of the 1925 "Tri-State Tornado" .  The path (note the SW to NE orientation) was 219 miles long, the tornado lasted about 3.5 hours and killed 695 people.  The tornado was traveling over 60 MPH over much of its path. It is still today the deadliest single tornado ever in the United States (you'll find a compilation of tornado records here).  The Joplin Missouri tornado (May 22, 2011) killed 162 people making it the deadliest since 1947 and the 7th deadliest tornado in US history.


Tornadoes often occur in "outbreaks."  The paths of 148 tornadoes during the April 3-4, 1974 "Jumbo Tornado Outbreak" are shown above.  Note the first tornadoes were located in the upper left corner of the map and all of the tornado paths are oriented from SW to NE.

The April 25-28, 2011 outbreak is now apparently the largest tornado outbreak in US history (358 tornadoes, 346 people killed).


As we learn more about tornadoes I'm hoping you'll look at video with a more critical eye than you would have otherwise.  So we took a moment, at this point,  to have a look at some tornadoes caught on video.  If you click on the links below you'll see the same or a similar video that I found online.  The videos shown in class were from a tape called "Tornado Video Classics".

The numbers in the left column identified the tornado on the tape.  The next column shows the Fujita Scale rating (the scale runs from F0 (weakest) to F5 (strongest).  The locations and date are shown next.  The last column has comments and things to look for when watching the video segment.


54a
F3
Grand Isle NE
Mar. 13, 1990
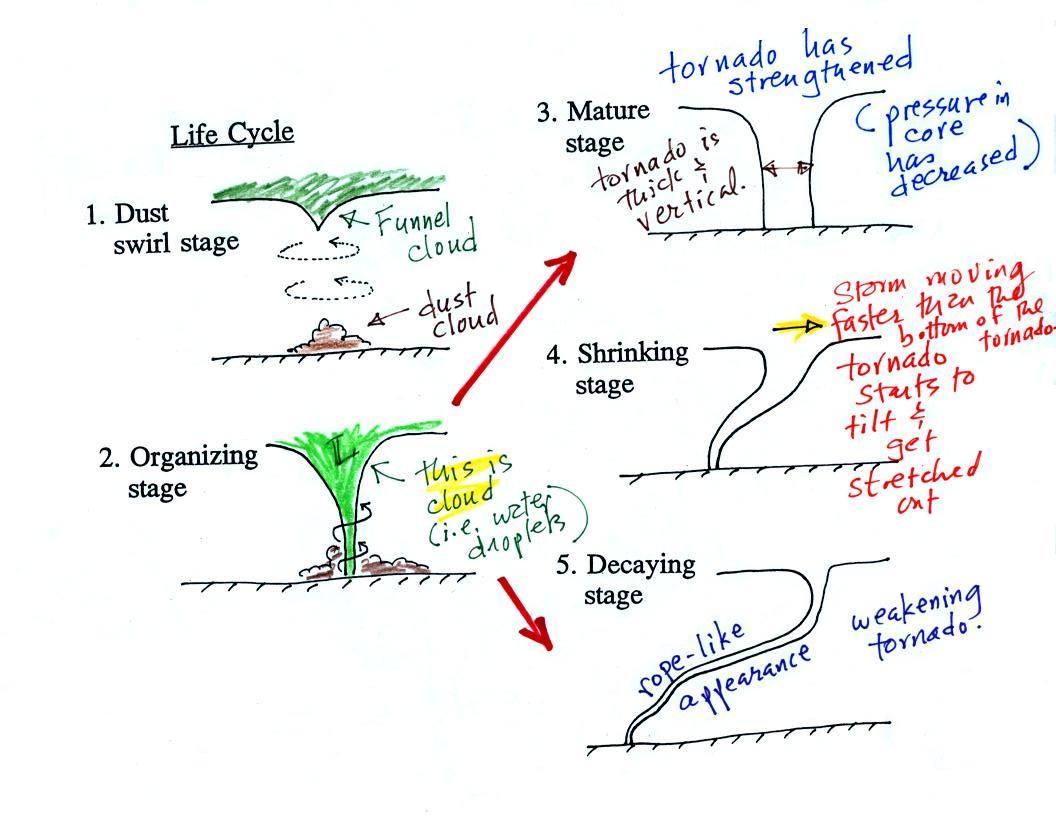
tornado cloud is pretty thick and vertical
61f
F3
McConnell AFB KS
Apr. 26, 1991
this is about as close to a tornado as you're ever likely to get.  Try to judge the diameter of the tornado cloud.  What direction are the tornado winds spinning?
52
F5
Hesston KS

Mar. 13, 1990
Watch closely, you may see a tree or two uprooted by the tornado winds
51
F3
North Platte
NE

Jun. 25, 1989
Trees uprooted and buildings lifted by the tornado winds.  The online video is longer than the one shown in class and has some good closeup video.  See especially the last couple of minutes of the video
65
F1
Brainard MN
Jul. 5, 1991
It's a good thing this was only an F1 tornado
57
F2
Darlington IN
Jun. 1, 1990
Tornado cloud without much dust
62b
F2
Kansas Turnpike
Apr. 26, 1991
It's sometimes hard to run away from a tornado.  Watch closely you'll see a van blown off the road and rolled by the tornado.  The driver of the van was killed!
47
F2
Minneapolis MN
Jul. 18, 1986
Tornado cloud appears and disappears.  The online video compares features seen in this tornado with one created in a laboratory.

The online Kansas turnpike video also has a warning that a highway underpass is actually a very dangerous place to take shelter from a tornado.  Here is some additional information from the Norman OK office of the National Weather Service.  Slide 6 lists some of the reasons why underpasses are so dangerous.


In the next video you'll see
1.  Some additional footage of the Andover KS tornado (the one that tore through the parking lot and the one that caught up the people driving on an interstate highway and forced them to seek shelter under a bridge).


2.  Pictures of new and distant supercell thunderstorms and wall clouds.

3.  A computer simulation of the growth and development of a supercell thunderstorm.

But first we need to learn a little bit about supercell thunderstorms.


Here is a relatively simple drawing showing some of the key features on a supercell thunderstorm (found on p. 163 in the ClassNotes).  In a supercell the rotating updraft (shown in red above) is strong enough to penetrate a little way into the stratosphere.  This produces the overshooting top or dome feature above.  A wall cloud and a tornado are shown at the bottom of the mesocyclone.  In an ordinary thunderstorm the updraft is unable to penetrate into the very stable air in the stratosphere and the upward moving air just flattens out and forms an anvil.  The flanking line is a line of new cells trying to form alongside the supercell thunderstorm (similar to convergence between prexisting winds and thunderstorm downdraft winds that can lead to new storm development alongside a dissipating air mass thunderstorm).


Here is a second slightly more complicated and realistic drawing of a supercell thunderstorm.  A typical air mass thunderstorm (purple) has been drawn in so that you can appreciated how much larger supercell thunderstorms can be.

The video segment was shown at this point.  It showed a distant supercell thunderstorm and photographs of the bases of nearby supercell thunderstorms.  Here you could see the spectacular wall cloud that often forms at the base of these storms.  Finally a computer simulation showed some of the complex motions that form inside supercell thunderstorms, particularly the tilted rotating updraft.  I haven't been able to find the video online.


Thunderstorms with rotating updrafts and supercell thunderstorms often have a distinctive radar signature called a hook echo.

In some ways a radar image of a thunderstorm is like an X-ray photograph of a human body.


It is important to understand that the X-ray doesn't photograph all the parts of the body, just the skeleton.


The radio signals emitted by radar pass through the cloud itself but are reflected by the much larger precipitation particles. The radar keeps track of how long it takes for the emitted signal to travel out to the cloud, be reflected, and return to the radar antenna.  The radar can use this to determine the distance to the storm.  It also knows the direction to the storm and can locate the storm on a map.  The intensity of the reflected signal (the echo) is often color coded.  Red means an intense reflected signal and lots of large precipitation particles.  The edge of the cloud isn't normally seen on the radar signal.

A Doppler radar (something we didn't discuss in class) can detects small shifts in the frequency of the reflected radar signal caused by precipitation moving toward or away from the radar antenna.  This can be used to determine wind speeds inside the tornado.

Here is an actual radar image with a prominent hook echo.  The hook is evidence of large scale rotation inside a thunderstorm and means the thunderstorm is capable of, and may already be, producing tornadoes.


This is the radar image of a thunderstorm that produced a very strong tornado that hit Oklahoma City in May 1999
( http://www.spc.noaa.gov/faq/tornado/radscel.htm ).  The hook echo is visible near the lower left hand corner of the picture.  Winds in the tornado may have exceeded 300 MPH.  You can read more about this tornado here.  And here is some storm chase video of the tornado.


The figure below (p. 162 in the ClassNotes) illustrates the life cycle of a tornado.  Have a close look at the next tornado you see on video and see if you can determine whether it is in one of the early or late stages of its development.


Tornadoes begin in and descend from a thunderstorm.  You would usually see a funnel cloud dropping from the base of the thunderstorm.  Spinning winds will probably be present between the cloud and ground before the tornado cloud becomes visible.  The spinning winds can stir up dust at ground level.  The spinning winds might also be strong enough at this point to produce some minor damage.  Here is video of the Laverne Oklahoma tornado that was shown in class and that shows the initial dust swirl stage very well. 


In Stage 2, moist air moves horizontally toward the low pressure in the core of the tornado.  This sideways moving air will expand and cool just as rising air does (see figure below).  Once the air cools enough (to the dew point temperature) a cloud will form. 

Tornadoes can go from Stage 2 to Stage 3 (this is what the strongest tornadoes do) or directly from stage 2 to stage 5.  Note a strong tornado is usually vertical and thick as shown in Stage 3.  "Wedge tornadoes" actually appear wider than they are tall.

The thunderstorm and the top of the tornado will move faster than the surface winds and the bottom of the tornado.  This will tilt and stretch the tornado.  The rope like appearance in Stage 5 is usually a sign of a weakening (though still a dangerous) tornado.


A tornado cloud forms is mostly the same way that ordinary clouds do.  In an ordinary cloud (left figure above) rising air moves into lower pressure surroundings and expands.  Expansion cools the air.  If the air expands and cools enough (to the dew point) a cloud forms.  In a tornado air moves horizontally into lower pressure at the core of the tornado.  The air expands and cools just like rising air does.  If the air cools enough a true cloud appears.


It is very hard to actually measure the speed of the rotating winds in a tornado.  Researchers usually survey the damage caused by the tornado and assign a Fujita Scale rating.  The original scale, introduced in 1971 by Tetsuya (Ted) Fujita.  A simplified, easy to remember version is shown below.  A very basic and grossly oversimplified damage scale is included.  This is simple enough that I can remember it and can use it to estimate tornado intensity when I see damage on the television news.


The original scale has been revised because the estimated wind speeds were probably too high.  The newer scale is called the Enhanced Fujita Scale and became operational in 2007.  Here's a simplfied version of the EF scale


Now EF2, EF3 and EF4 levels have winds between 100 and 200 MPH and only EF5 tornadoes have winds over 200 MPH.  More accurate versions of both scales are compared below.


The original Fujita Scale actually goes up to F12.  An F12 tornado would have winds of about 740 MPH, the speed of sound.  Roughly 3/4 of all tornadoes are EF0 or EF1 tornadoes and have winds that are less than 100 MPH.  EF4 and EF5 tornadoes are rare but cause the majority of tornado deaths. 

The EF scale considers 28 different "damage indicators," that is, types of structures or vegetation that could be damaged by a tornado.  Examples include:


Damage Indicator
Description
2
1 or 2 family residential home
3
Mobile home (single wide)
10
Strip mall
13
Automobile showroom
22
Service station canopy
26
Free standing light pole
27
Tree (softwood)


Then for each indicator is a standardized list of "degrees of damage" that an investigator can look at to estimate the intensity of the tornado.  For a 1 or 2 family home for example


degree of damage
description
approximate
wind speed (MPH)
1
visible damage
65
2
loss of roof covering material
80
3
broken glass in doors & windows
95
4
lifting of roof deck, loss of more than 20% of roof material, collapse of chimney, garage doors collapse inward, destruction of porch roof or carport
100
5
house slides off foundation
120
6
large sections of roof removed, most walls still standing
120
7
exterior walls collapse (top story)
130
8
most interior walls collapse (top story)
150
9
most walls in bottom floor collapse except small interior rooms
150
10
total destruction of entire building
170


You'll find the entire set of damage indicators and lists of degrees of damage here.
Here's some recent video of damage being caused by a tornado as it happened (caught on surveillance video).  The tornado struck West Liberty, Kentucky on March 2 this year.

The photos below show examples of damage caused by EF2, EF4, and EF5 tornadoes.  Damage photographs from the tornado outbreak this past Sunday have already appeared online.


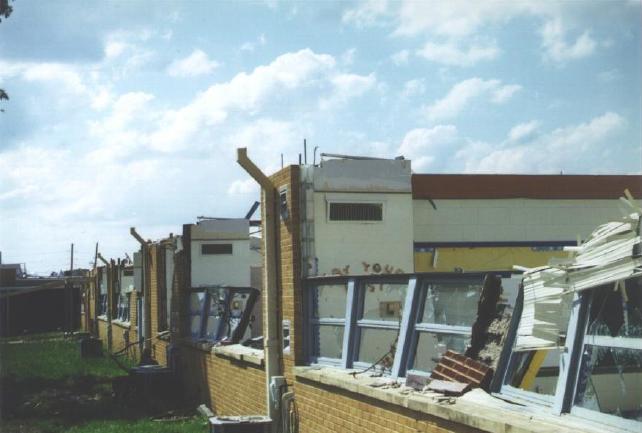
EF2 Damage
roof is gone, but all walls still standing
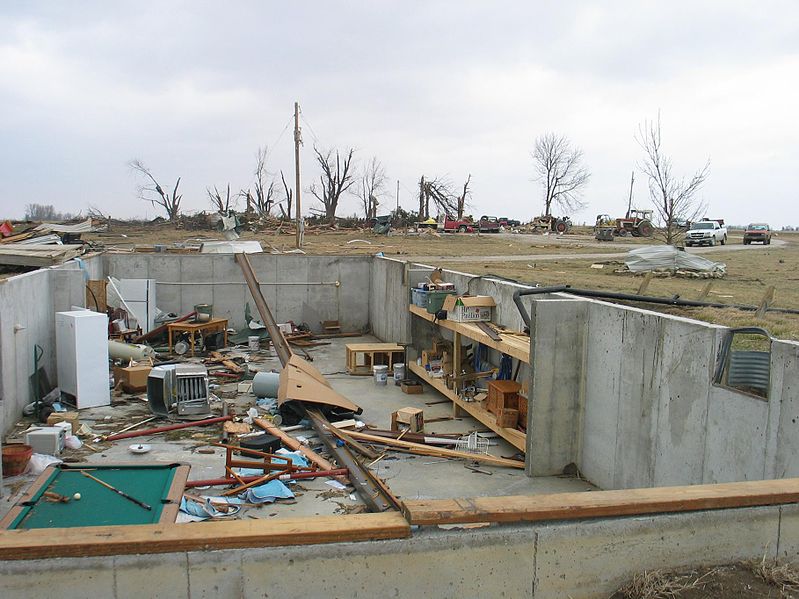
EF4 Damage
only the strong reinforced concrete basement walls are left standing.  It doesn't look like there would have been anywhere in this building that would have provided protection from a tornado this strong.
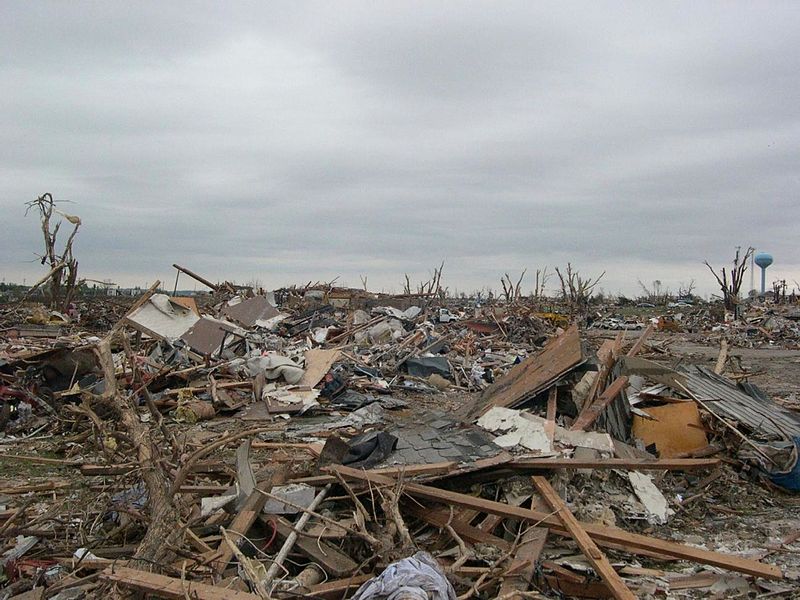
EF5 Damage
complete destruction of the structure


 Here are some additional, older, photographs of typical damage associated with all the levels on the Fujita Scale.  None of these photos was shown in class.


And finally, something that was initially a puzzle.


Several levels of damage (EF1 to about EF3) are visible in the photograph above.  It was puzzling initially how some homes could be nearly destroyed while a home nearby or in between was left with only light damage.  One possible explanation is shown below.


Some big strong tornadoes may have smaller more intense "suction vortices" that spin around the center of the tornado (they would be hard to see because of all the dust in the tornado cloud.  Tornado researchers have actually seen the pattern shown at right  scratched into the ground by the multiple vortices in a strong tornado.


The sketch above shows a tornado located SW of a neighborhood.  As the tornado sweeps through the neighborhood, the suction vortex will rotate around the core of the tornado.


The homes marked in red would be damaged severely.  The others would receive less damage.  Just one suction vortex was used here, there are usually several.  But the tornado diameter is probably larger than shown here.

At this point we watched the last of the tornado video tapes.  It showed a tornado that occurred in Pampa, Texas (here are a couple of videos that I found on YouTube: video 1, video 2, they're missing the commentary that was on the video shown in class).  Near the end of the segment, video photography showed several vehicles (pick up trucks and a van) that had been lifted 100 feet or so off the ground and were being thrown around at 80 or 90 MPH by the tornado winds.  Winds speeds of about 250 MPH were estimated from the video photography (though the wind speeds were measured above the ground and might not have extended all the way to the ground).