Tuesday Dec. 7, 2010
A couple of songs from the Royal Crown Revue
("Hey Pachuco" and "The Walkin' Blues"). Seemed like just the
right kind of stuff to end the semester with.
Everything in my possesion as of last Friday has been graded and
was returned in class today together with grade summaries.
The Final Exam for this class is Thursday, Dec. 16 from 8-10 am in ILC
140. You can take the final with the other section this coming
Friday, 2-4 pm in CESL 103. Please let me know ahead of time if
you plan to do that.
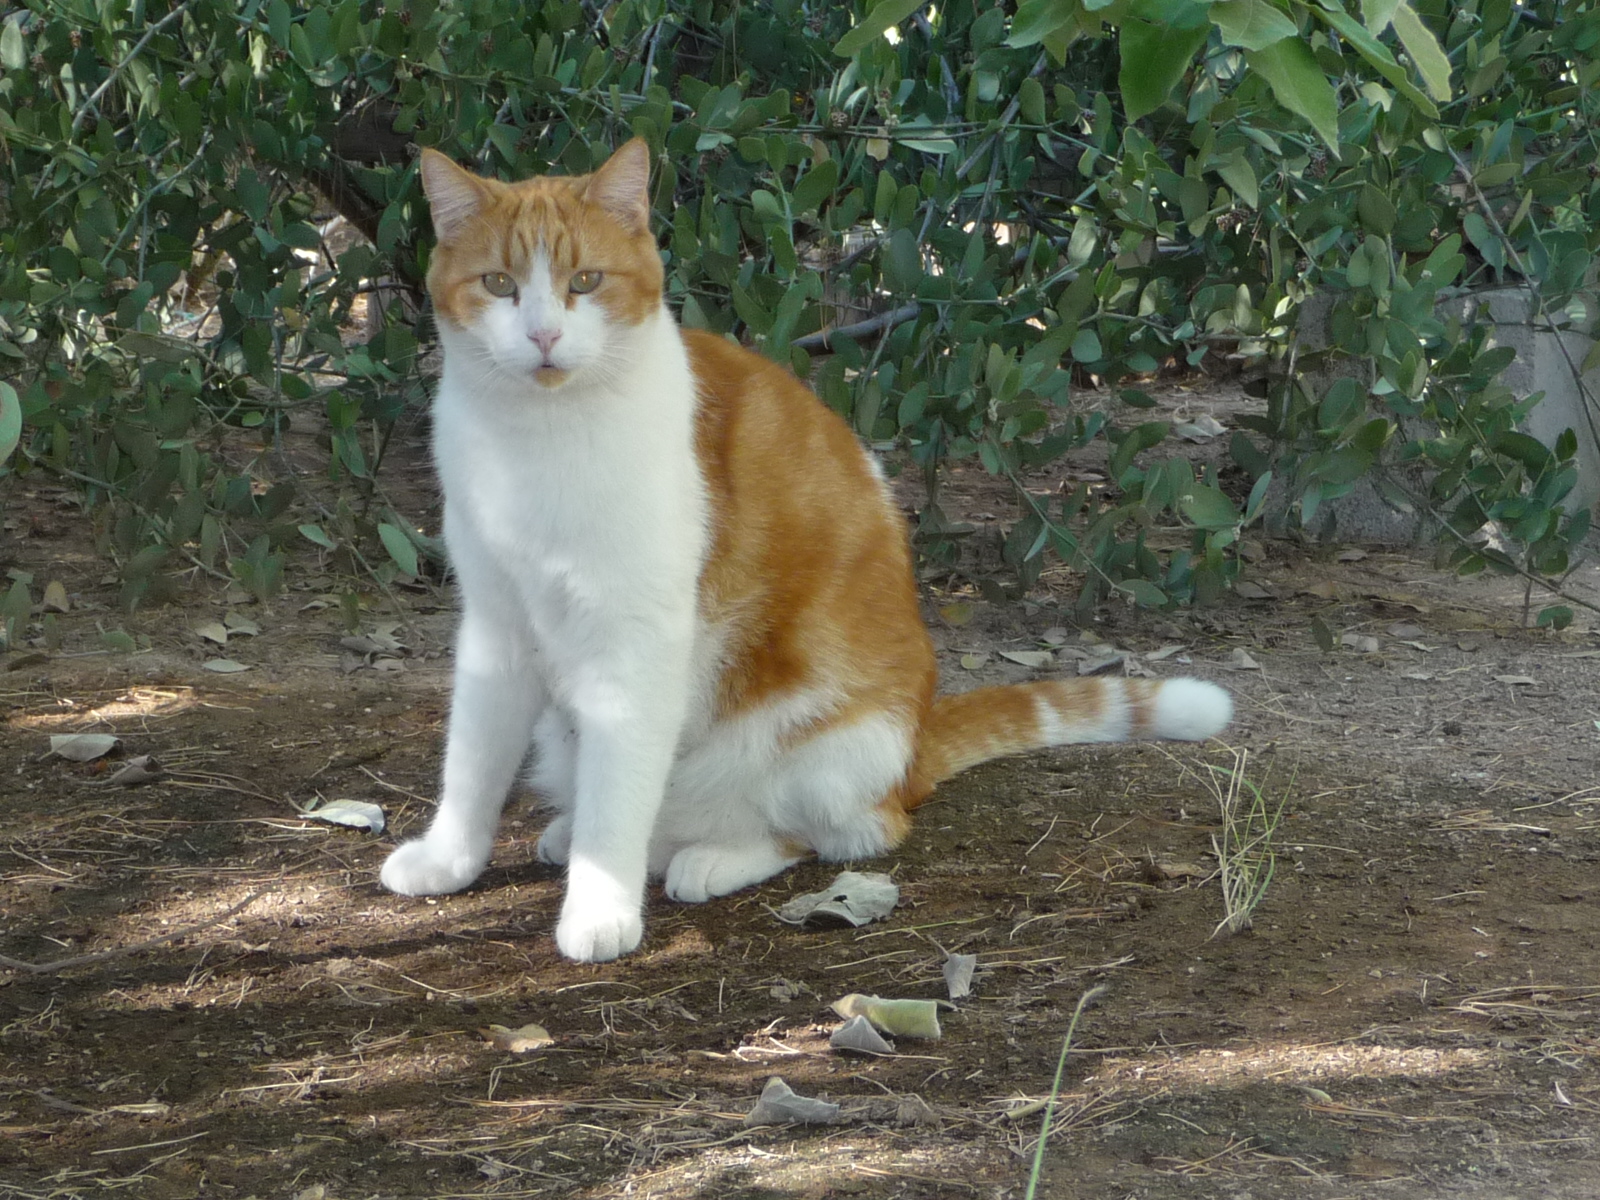
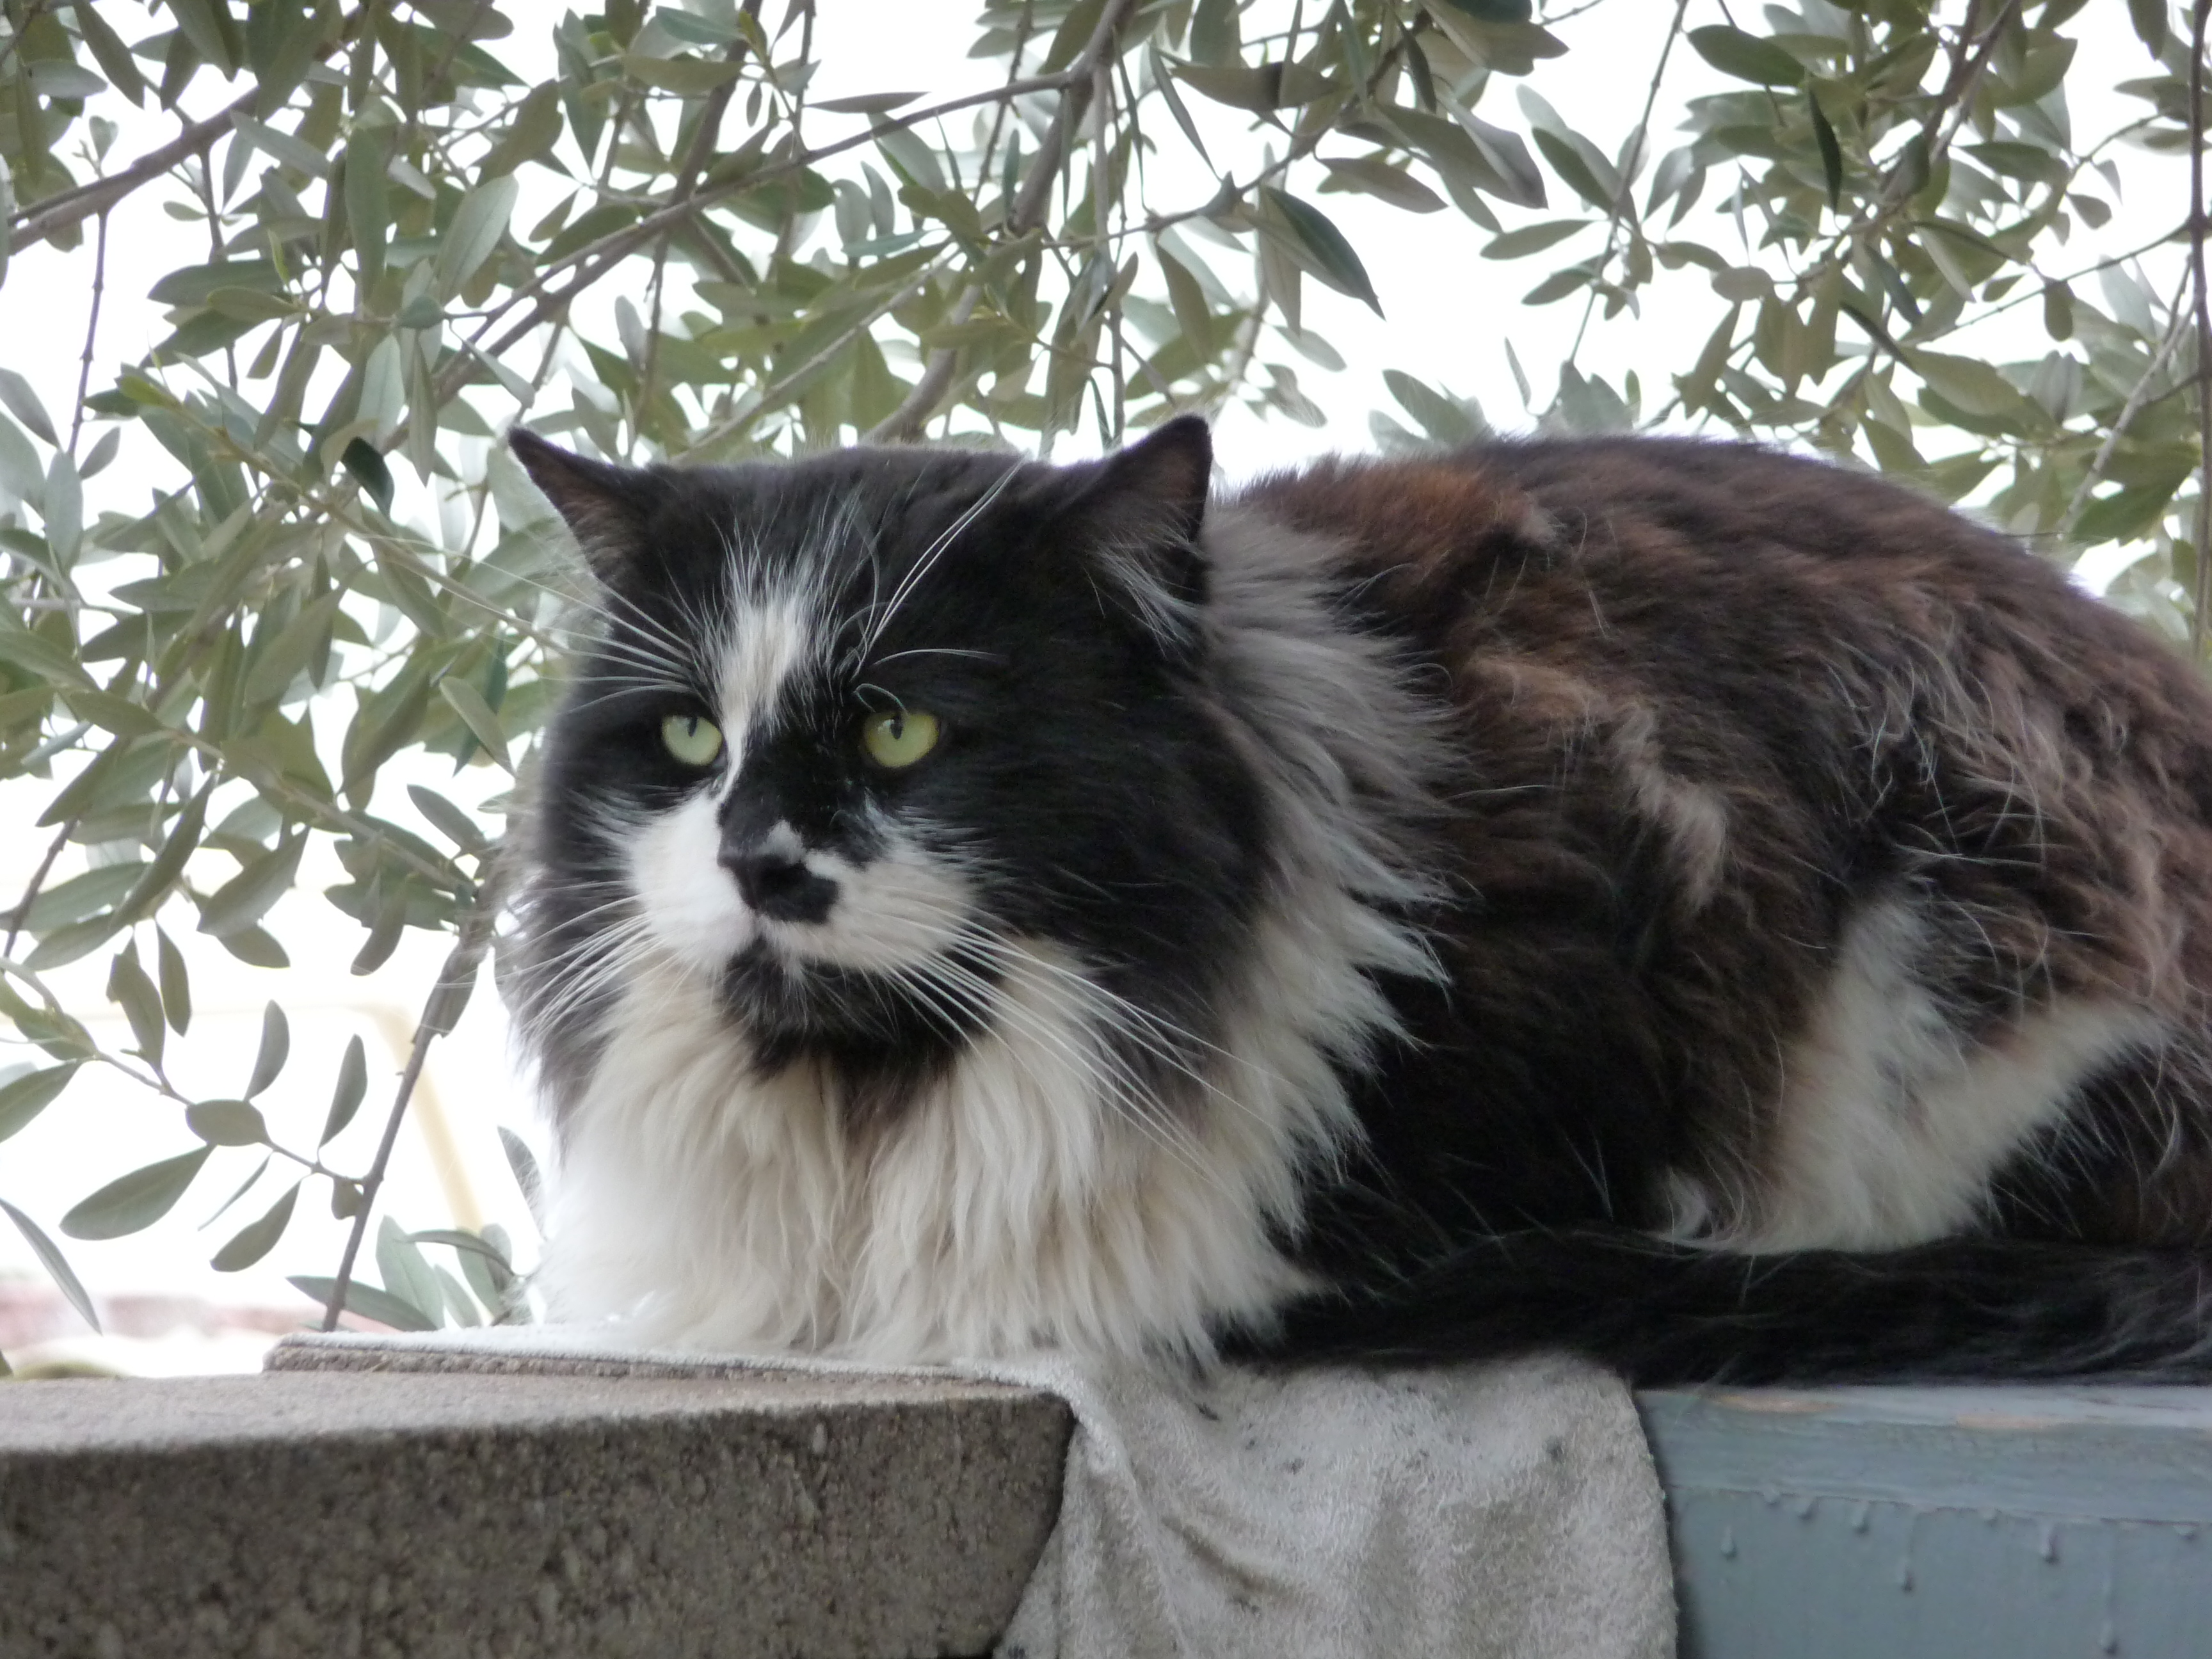
Today's
pictures of the day. Clockwise from upper left:
Fox, Rajah, stray cat #1, stray cat #2.
We
will
spend the last day of class on Hurricanes.
This will be the final
topic
that we cover this semester. This won't be on this week's quiz
but will most likely be on the Final Exam.
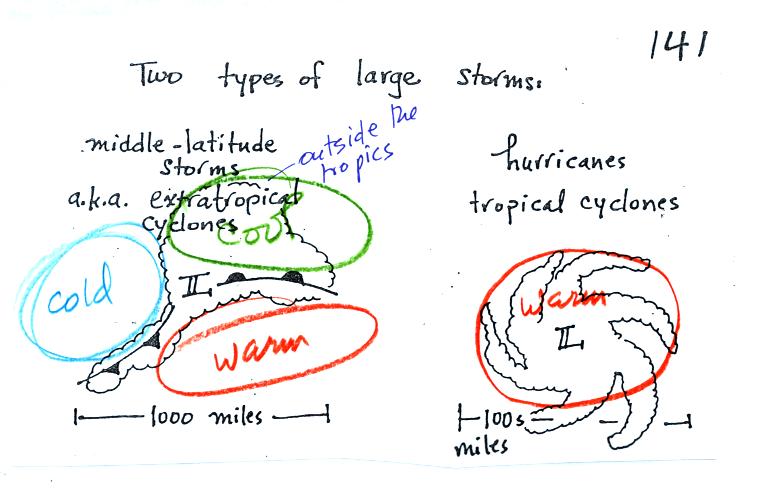
A good place to begin is to compare hurricanes (tropical cyclones)
with
middle latitude storms (extratropical cyclones). The middle
column below list some similarities, the outer columns list
differences. These are not details that you need to worry about
for the Final Exam.
|
Middle latitude storms
|
Similarities
|
Hurricanes
|
1
|
form at middle latitudes
(30 to 60 degrees latitude)
|
both types of storms have
low pressure centers
(cyclone refers to winds blowing around low pressure)
|
from in the subtropics
(5 to 20 degrees latitude)
|
2
|
can form over land or water
|
upper level divergence is
what causes
both types of storms to intensify
|
only form over warm ocean
water
|
3
|
bigger (might cover half
the US)
|
|
not as big (might fill the
Gulf of Mexico)
|
4
|
fronts separate warm and
cold air masses
|
|
just warm moist air
|
5
|
at middle latitude the
prevailing westerly winds move these storms from west to east
|
|
the trade winds move
hurricanes from east to west
|
6
|
strongest in the winter
into early spring
|
|
strongest in late summer
into fall (when the ocean is warmest)
|
7
|
produce rain, snow, sleet,
graupel |
|
mostly just rain (lots of
rain) |
8
|
usually no name
|
|
get names
|
Hurricanes receive names (when they reach tropical storm
strength). The names now alternate male and female. The
names of particularly strong or deadly hurricanes (such as Katrina) are
retired, otherwise the names repeat every 6 years.
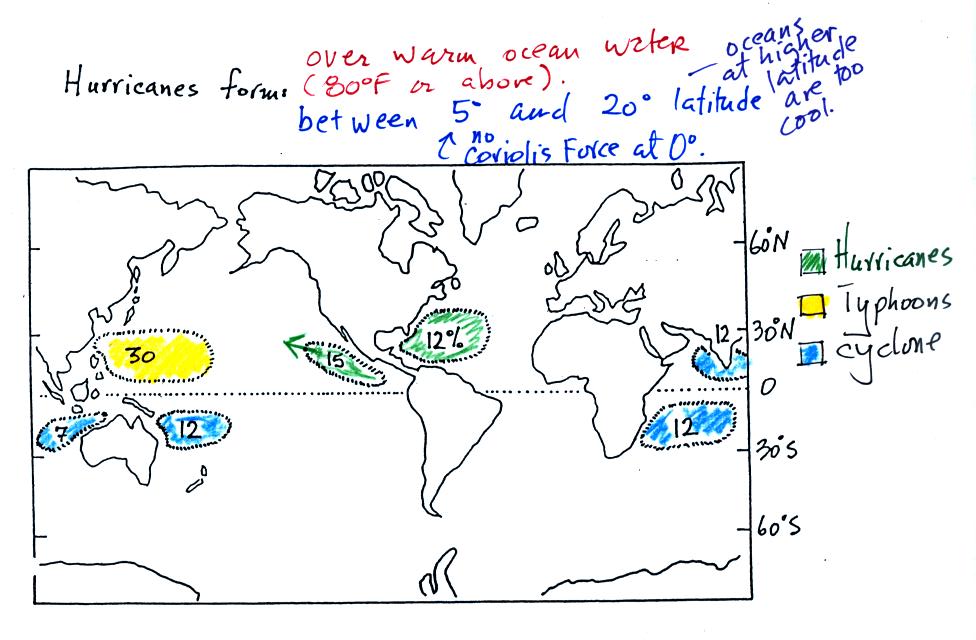
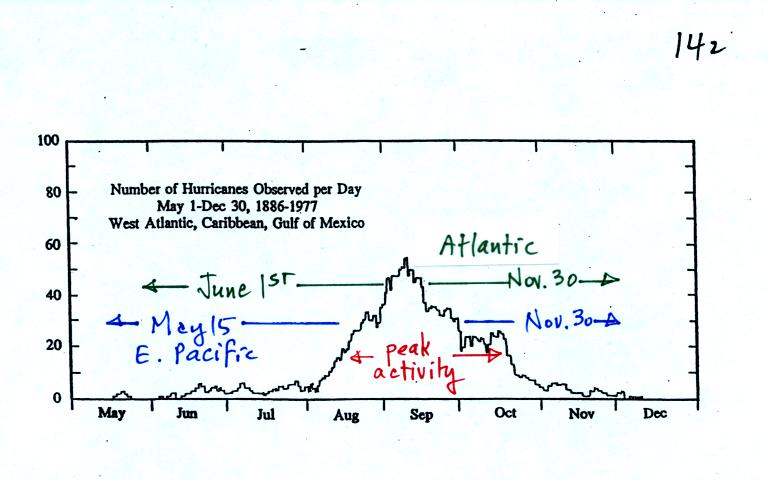
Hurricanes form between 5 and 20 degrees latitude,
over warm ocean
water, north and south of the equator. The warm
layer of water
must be fairly deep to contain enough energy to fuel a hurricane and so
that turbulence and mixing don't bring cold water up to the ocean
surface. The atmosphere must be unstable so that thunderstorms
can develop. Hurricanes will only form when there is very little
or no vertical wind shear (changing wind direction or speed with
altitude). Hurricanes don't form at the equator because there is
no Coriolis force there (the Coriolis force is what gives hurricanes
their spin and it causes hurricanes to spin in opposite directions in
the northern and southern hemispheres).
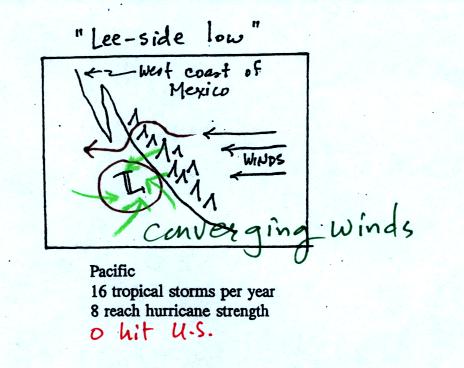
Note that more tropical
cyclones form off the
west coast of the US than
off the east coast. The west coast hurricanes don't generally get
much attention, because they move away from the coast and usually
don't
present a threat to the US (except occasionally to the state of
Hawaii). The moisture from these storms will
sometimes be pulled up into the southwestern US where it can lead to
heavy rain and flooding.
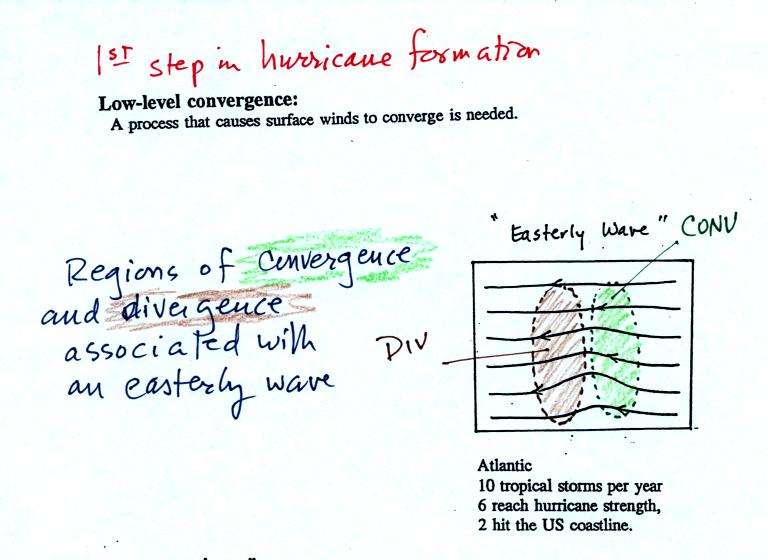
Some kind
of meteorological process that produces low
level
convergence
is needed to initiate a hurricane. One possibility, and the one
that fuels most of the strong N. Atlantic hurricanes, is an "easterly
wave." This is just a "wiggle" in the wind flow pattern.
Easterly waves often form over Africa or just off the African coast and
then travel toward the west across the N. Atlantic. Winds
converge as they approach the wave and then diverge once
they are
past it . The convergence will cause air to rise and
thunderstorms
to begin to develop.
In an average year, in the N.
Atlantic, there will be 10 named
storms
(tropical storms or hurricanes) that develop during hurricane
season. 2005 was, if you remember, a very unusual
year. There
were 28 named storms in the N. Atlantic in 2005. That beat the
previous record of 21 names storms that had been set in 1933. Of
the 28 named storms, 15 developed into hurricanes.
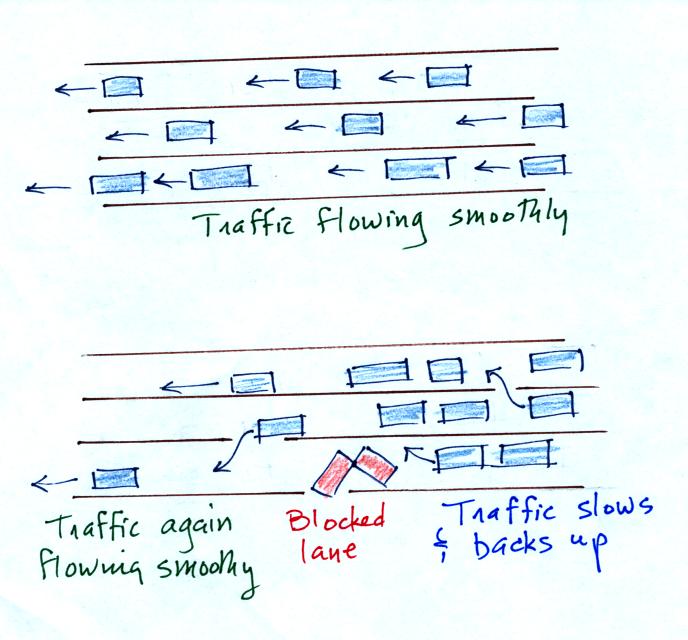
In some ways winds blowing through an easterly wave resembles
traffic
on a multi-lane highway. Traffic will back up as it approaches a
section of the highway with a closed lane. Once through the
"bottleneck" traffic will begin to flow more freely.
Another process that causes surface
winds to converge is a "lee side low."
This
figure tries to explain how a
cluster of thunderstorms can organize and intensify into a hurricane.
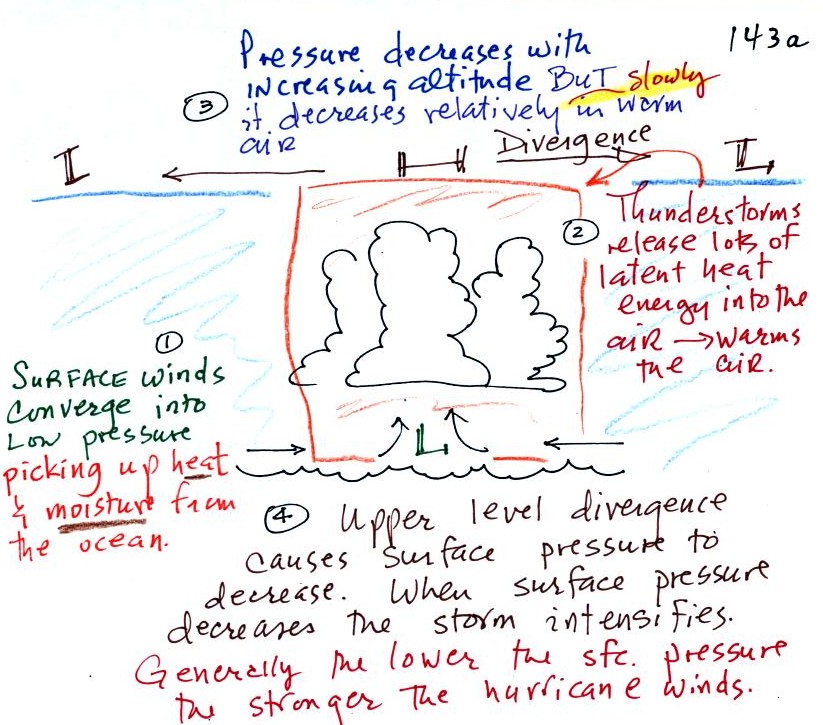
1. Converging surface winds pick
up heat and moisture from the ocean. These are the two mains
sources of energy for the hurricane.
2. Rising air expands, cools, and thunderstorm clouds
form. The
release of latent heat during condensation warms the atmosphere.
The core of a hurricane is warmer than the air around it.
3. Pressure decreases more slowly with increasing altitude
in the warm core of the hurricane. The result is that pressure at
the top center of the hurricane is higher than the pressure at the top
edges of the hurricane (pressure at the top center is still lower than
the
pressure at the bottom center of the hurricane). Upper levels
winds diverge and spiral outward
from the top center of the hurricane (you can sometimes see this on
satellite photographs of hurricanes).
4. The upper level divergence will cause the surface
pressure at the center of the hurricane to decrease. The speed of
the converging surface winds increases
and the storm intensifies. The converging winds pick up
additional heat and moisture which warms the core of the hurricane even
more. The upper level high pressure and the upper level
divergence increase. The increased divergence lowers the surface
pressure even more.
Here's another view of hurricane development and intensification
(not shown in
class)
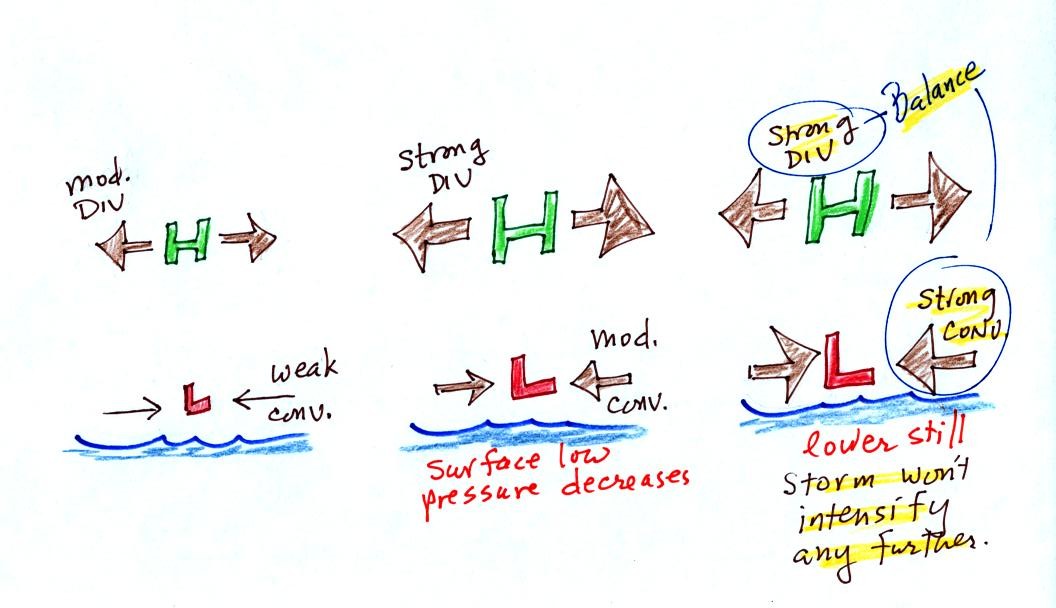
In the figure at left the upper level
divergence is stronger than the
surface convergence. Divergence is removing more air than is
being added by surface convergence. The surface low pressure will
decrease. The decrease in surface pressure will cause the
converging surface winds to blow faster.
In the middle picture, the surface low pressure is lower, the surface
convergence is stronger. The upper level divergence has also been
strengthened a little bit. The upper level divergence is still
stronger than the surface convergence so the surface so the surface low
pressure will
decrease even more.
In the right figure the surface low pressure has decreased enough that
the surface convergence now balances the upper level divergence.
The storm won't strengthen any more.
Generally speaking the lower the surface pressure at the center of a
hurricane the stronger the storm and the faster the surface winds will
blow. The following figure (not shown in class)
shows
this
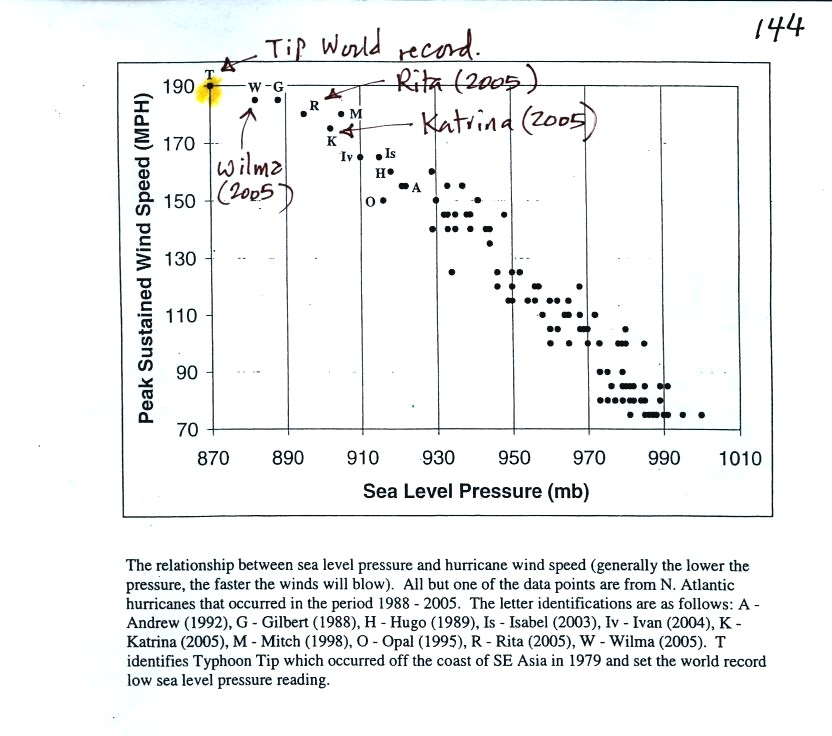
This figure tries to show the relationship between surface
pressure and surface wind speed. The world record low
sea level pressure reading, 870 mb, was set
by Typooon Tip off the SE Asia coast in 1979. Sustained winds in
that storm were 190
MPH. Three 2005 Atlantic hurricanes: Wilma, Rita, and Katrina had
pressures in the 880 mb to 900 mb range and winds ranging from 170 to
190 MPH.
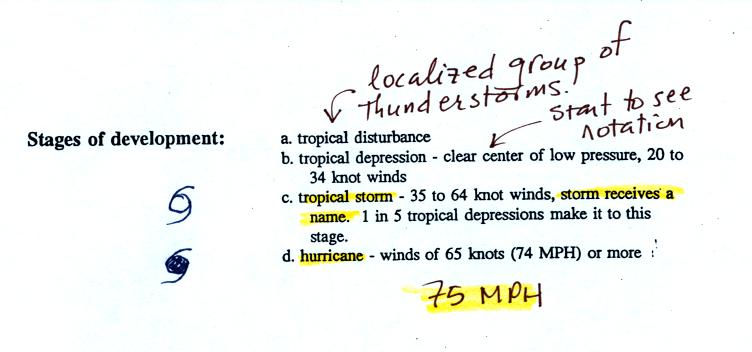
The stages
of storm development that lead up to a hurricane are shown
at the bottom of p. 143a in the photocopied ClassNotes.
A tropical disturbance is just a localized cluster of
thunderstorms
that a meterologist might see on a satellite photograph. But this
would merit observation because of the potential for further
development. Signs of rotation would be evidence of organization
and the developing storm would be called a tropical depression.
In order to be called a tropical storm the storm must
organize a little
more, and winds must
increase to 35 knots. The storm receives a name at this
point. Finally when winds exceed 75 MPH (easier to remember than
65 knots or 74 MPH) the storm becomes a hurricane.
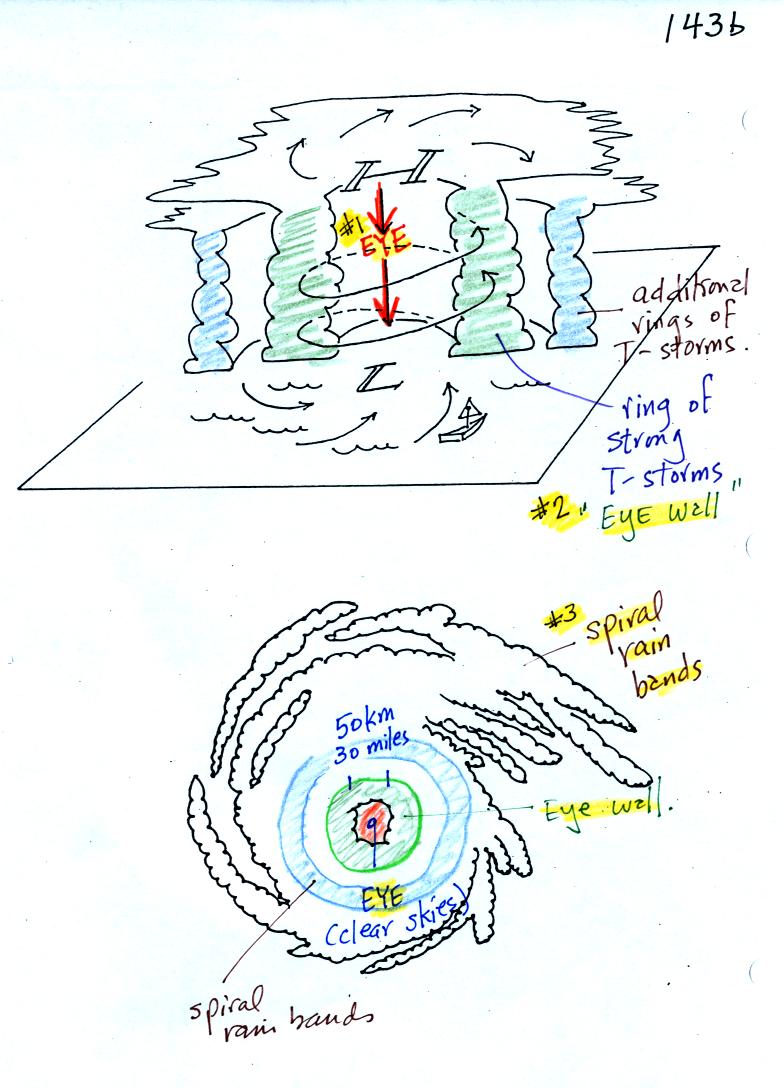
A crossectional view of a mature
hurricane (top) and a
picture
like you might
see on a satellite photograph (below).
Sinking air in the very center of a hurricane produces the clear
skies
of the eye, a hurricane's most distinctive feature. The eye is
typically a few 10s of miles across, though it may only be a few miles
across in the strongest hurricanes. Generally speaking the
smaller the eye, the stronger the storm.
A ring of strong thunderstorms, the eye wall, surrounds the
eye.
This is where the hurricane's strongest winds are found.
Additional concentric rings of thunderstorms are found as you move
outward from the center of the hurricane. These are called rain
bands. These usually aren't visible until you get to the outer
edge of the hurricane because they are covered by high altitude layer
clouds.
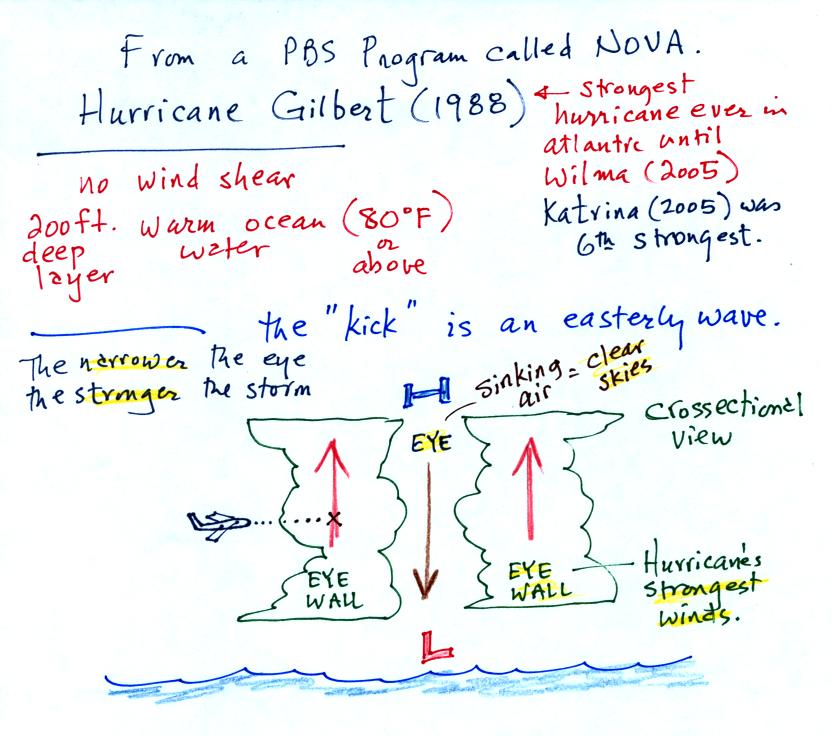
That was all the new material we had time to cover in class
because a
20
minute segment from a NOVA program (PBS network) on hurricanes was
shown. A film crew was on board a NOAA
reconnaissance plane as it flew into the narrow eye of hurricane
GILBERT. Gilbert set the record low sea level pressure reading
for the Atlantic ocean (888 mb). That record stood until the 2005
hurricane season when WILMA set a new record of 882 mb. The world
record low sea level pressure, 870 mb, was set in a SE Asian typhoon in
1979.
Here are some comments shown during the video. We
will review the Saffir Simpson scale in class on Monday.
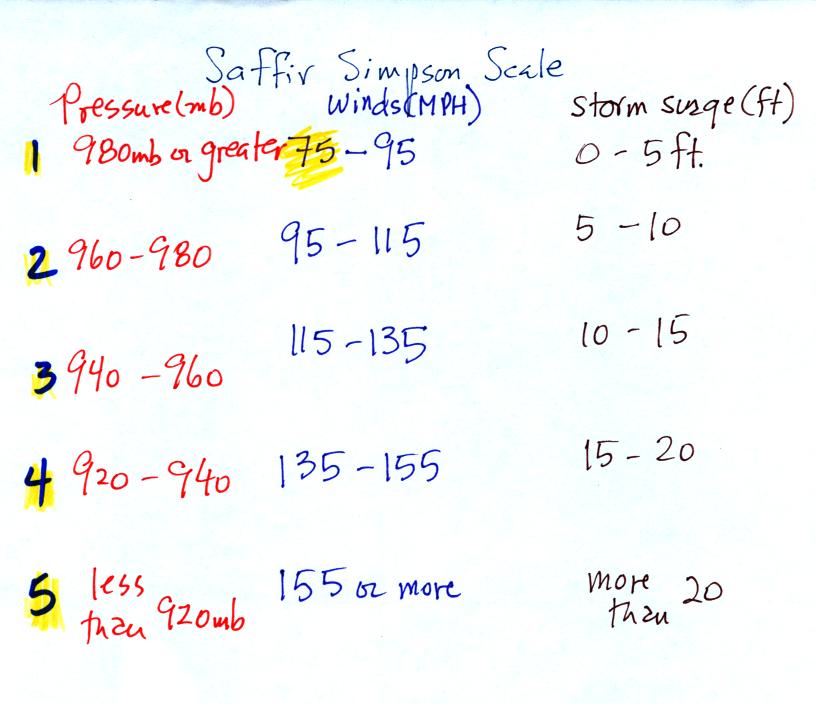
Here's a simplified version of the
Saffir-Simpson scale used to rate hurricane strength or intensity.
You should remember that the scale
runs from 1 to 5 and that winds need
to be 75 MPH or greater in order for a tropical storm to become a
hurricane.
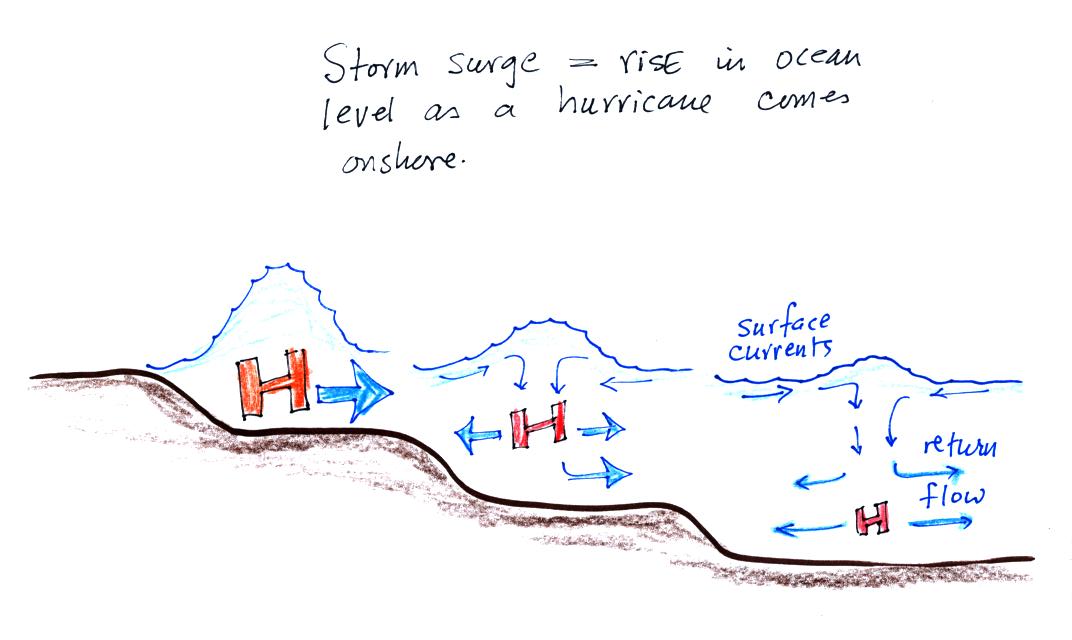
A hurricane storm surge is a rise in ocean level caused when
a hurricane moves onshore. It causes most of the destruction
along a coastline. The
following figure shows how a storm surge develops.
Out at sea,
the converging surface
winds
create
surface
currents
in the
ocean that transport water toward the center of the hurricane.
The rise in ocean level is probably only a few feet, though the waves
are much larger. A return flow develops underwater that carries
the water back to where it came from.
As the hurricane approaches shore, the
ocean becomes
shallower.
The return flow must pass through a more restricted space. A rise
in ocean level will increase the underwater pressure and the return
flow will speed up. More pressure and an even faster return flow
is needed as the hurricane gets near the coast. The rise in ocean
level can be more than 20 feet for a category 5 hurricane.
Here is a link to the storm surge website
(from the Hurricane Research Division of the Atlantic Oceanographic and
Meteorological Labororatory). It has an interesting animation
showing output from the SLOSH model used to predict hurricane storm
surges and the flooding they can cause.
And with that we came to
THE END
of what we will be able to cover in
NATS 101 this semester. In class on Wednesday we will begin
the review for next week's Final Exam.