Fri., Feb. 2, 2007
The Practice Quizzes and the first Optional Assignment were returned in class
today (note if you don't have a grade marked on your paper you received
full credit). Be sure to keep any graded work that is returned to
you just in case an error is made inputting grade data into the
computer used to calculate your grade for the class. The Practice
Quiz grades were not recorded, the optional assignment grades were
recorded.
The Experiment #1 reports and the 1S1P Assignment #1 reports are due next Monday
(Feb. 5). Students signed up for Expt. #2
should expect to receive the experiment materials next week.
We learned about the ideal gas law before the quiz on Wednesday.
This was the first of three steps that would lead to a better
understanding of why warm air rises and cold air sinks. Today we
will look at the 2nd and 3rd steps and finish that section. The
2nd step is Charles' Law which is a special case of the ideal gas law
(pressure stays constant).
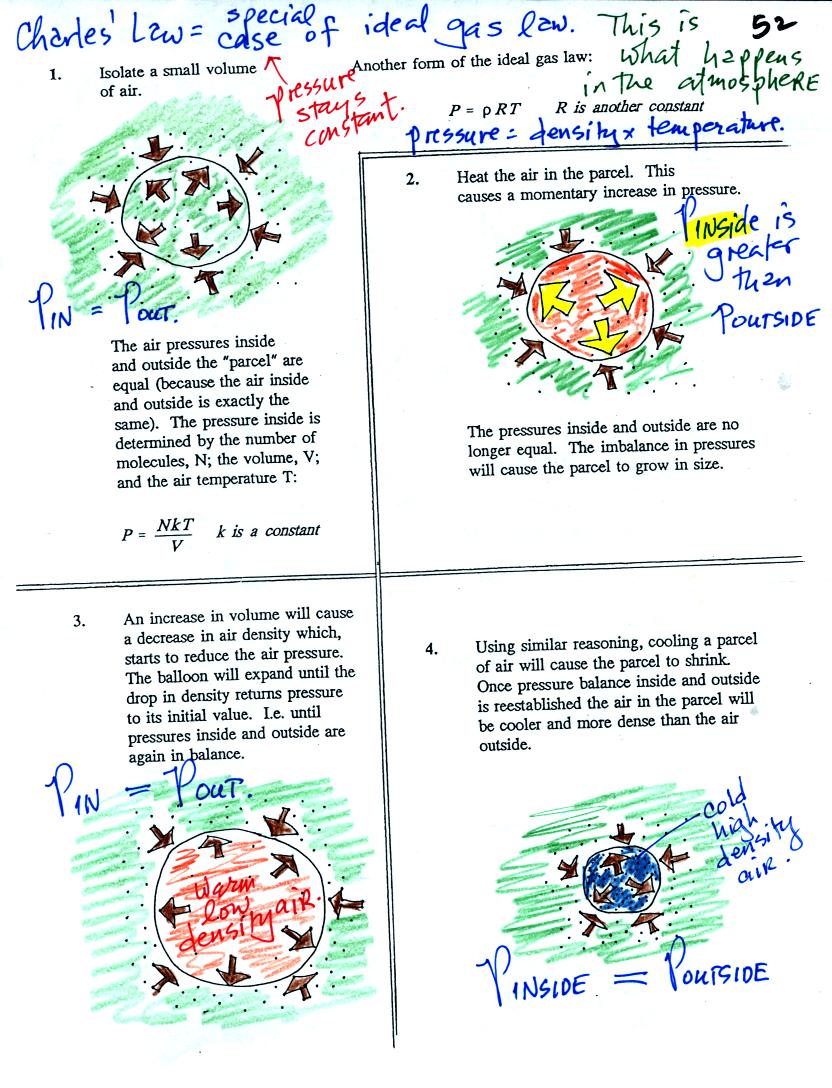
Air in the atmosphere behaves like air in a
balloon. A
balloon can grow or shrink in size depending on the pressure of the air
inside.
We start in the upper left hand corner with air inside a balloon that
is exactly the same as the air outside. The air inside and
outside have been colored green. The brown arrows show that the
pressure of the air inside pushing outward and the pressure of
the air surrounding the balloon pushing inward are all the same.
Next we warm the air in the balloon (Fig. 2). The ideal gas law
equation
tells us that the pressure of the air
in the balloon will increase. The increase is
momentary though.
Because the pressure inside is now greater than
the pressure outside, the balloon will expand. As volume begins
to increase, the pressure of the air inside the balloon will
decrease.
Eventually the balloon will expand just enough that the pressures
inside and
outside are again in balance. You end up with a balloon of warm
low density air that has the same pressure as the air surrounding it
(Fig. 3)
You can use the same reasoning to understand that cooling a balloon
will cause its volume to decrease. You will end up with a balloon
filled with cold high density air. The pressures inside and
outside the balloon will be the same.
These associations: warm air
= low density air and cold
air = high density air are important and
will come up a lot during the remainder of the semester.
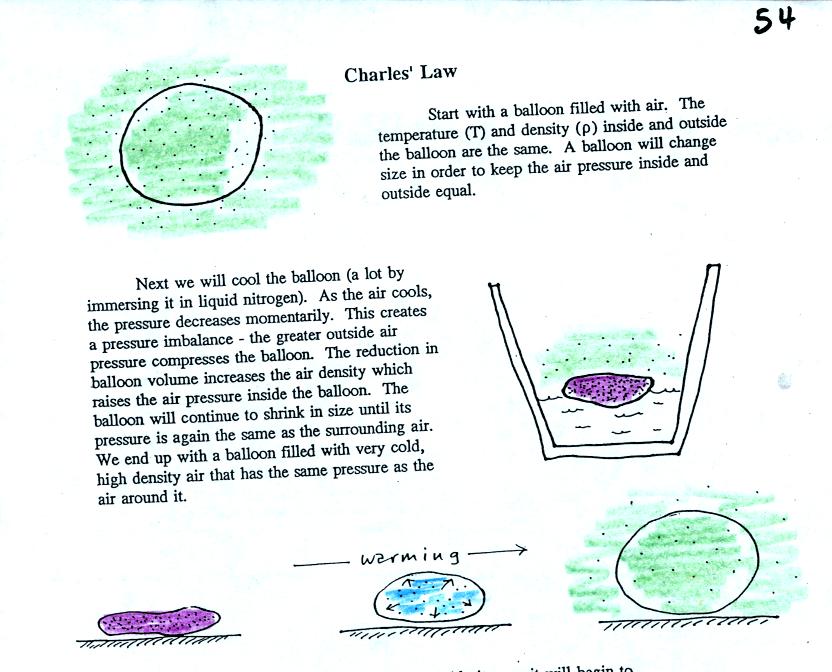
Charles Law can be demonstrated by dipping a balloon in liquid
nitrogen. When you pull the balloon out of the liquid nitrogen it
is very small. It is filled with cold high density air. As
the balloon warms the balloon expands and the density of the air inside
the balloon decreases. Air temperature and air density (or
volume) inside the balloon change in a way that keeps the pressure
constant.
The last
of the three steps (in trying to better understand why warm air rises
and cold air sinks) is to look at the upward and downward pointing
forces that act on a balloon and try to figure out why sometimes one
force sometimes the other force is dominant.
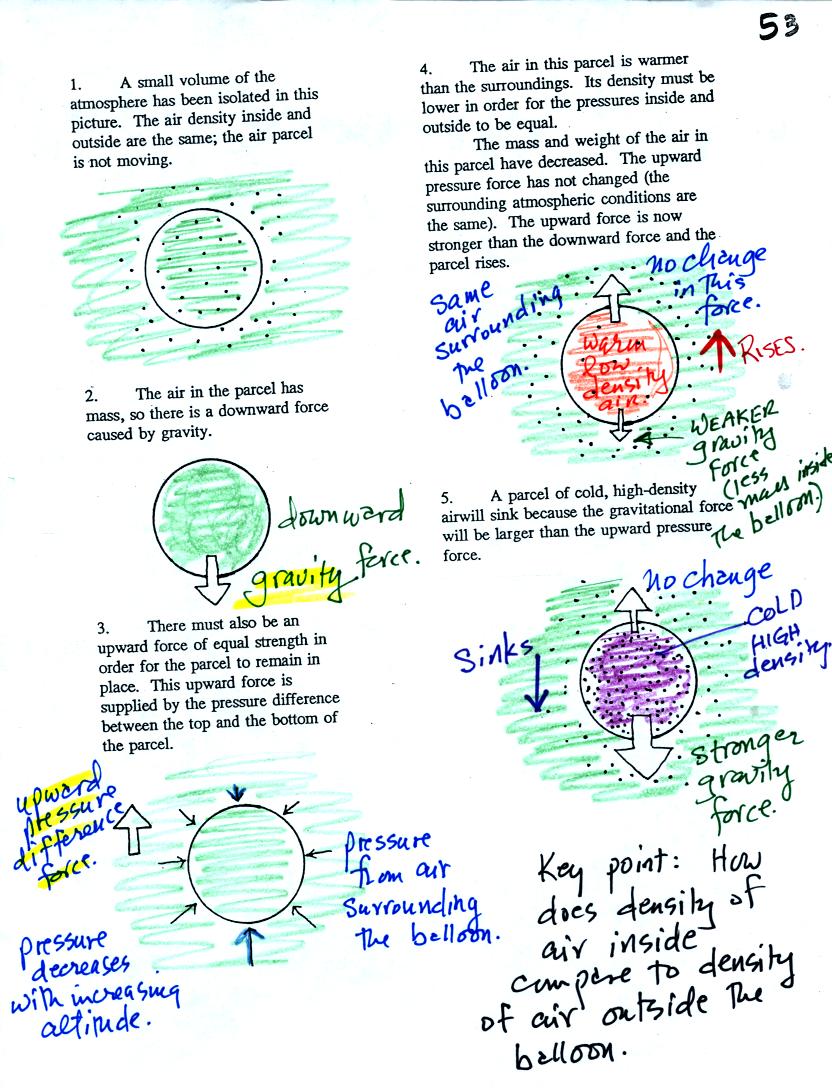
Air has mass and weight When an air parcel has the same
temperature, pressure, and density as the air around it, the parcel
will remain stationary. With gravity pulling downward on the air,
there must be another force pointing upward of equal strength.
The upward force is caused by pressure differences between the bottom
(higher pressure pushing up) and top of the balloon (slightly lower
pressure pushing down on the balloon).
If the balloon is filled with warm, low density air the gravity force
will weaken (there is less air in the balloon so it weighs less). The
upward pressure difference force (which depends on the
surrounding air) will not change. The upward force will be
stronger than the downward force and the balloon will rise.
Conversely if a balloon is filled with cold low density air, gravity
will strengthen and the balloon will sink.
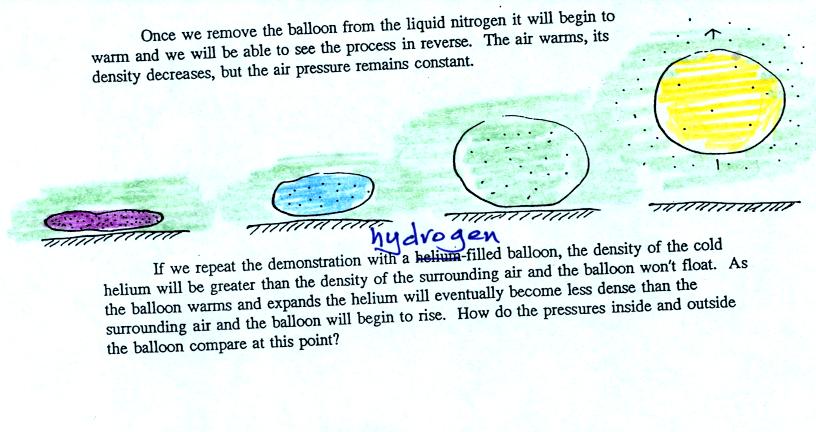
We modified the earlier demonstration somewhat (see bottom
of p. 54 in the
photocopied class notes). We used a balloon filled with hydrogen
instead of air. Hydrogen is less dense than air even when the
hydrogen has the same temperature as the surrounding air. A
hydrogen
filled balloon doesn't need to warmed up in order to rise.
We dunked the hydrogen filled balloon in some liquid nitrogen to cool
it
and to cause the density of the hydrogen to increase. When
removed
from the liquid nitrogen the balloon can't rise, the gas inside is
denser than the surrounding air (the purple and blue balloons in the
figure above). As the balloon warms and expands
its density decreases. The balloon at some point has the same
density as the air around it (green above) and is neutrally
bouyant. Eventually the balloon becomes less dense that the
surrounding air (yellow) and floats up to the ceiling.
You might have a look at the material on Archimedes' Law on pps 53a and
53b in the photocopied Class Notes. That explains this same
material in a slightly different way, a way that you might be better
able to relate to.
Now back
to surface weather maps. Weather data has been plotted onto the
surface weather map below using the station model notation.
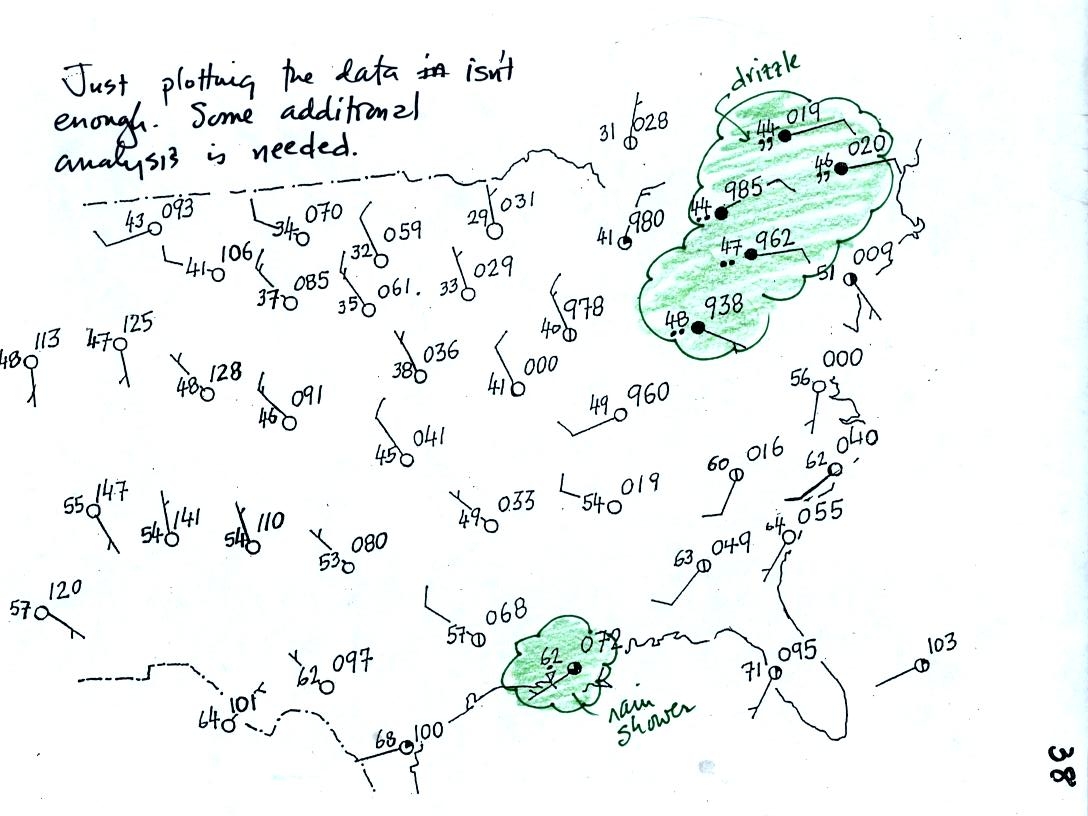
Plotting the surface weather data on a map is just the
beginning.
For example you really can't tell what is causing the cloudy weather
with rain and drizzle in the NE portion of the map above or the rain
shower at the location along the Gulf Coast. Some additional
analysis is needed. A meteorologist would usually begin by
drawing some contour lines of pressure to map out the large scale
pressure pattern. We will look first at contour lines of
temperature, they are a little easier to understand.

Isotherms, temperature contour lines, are drawn at 10 F
intervals.
They do two things: (1) connect points on the map that all
have the same temperature, and (2) separate regions that are warmer
than a particular temperature from regions that are colder. The
40o F isotherm highlighted in brown above passes through
one city
reporting a temperature of exactly 40o (highlighted in
yellow). Mostly it goes
between pairs of
cities: one with a temperature warmer than 40o and the other
colder
than 40o. Temperatures generally decrease with
increasing
latitude.
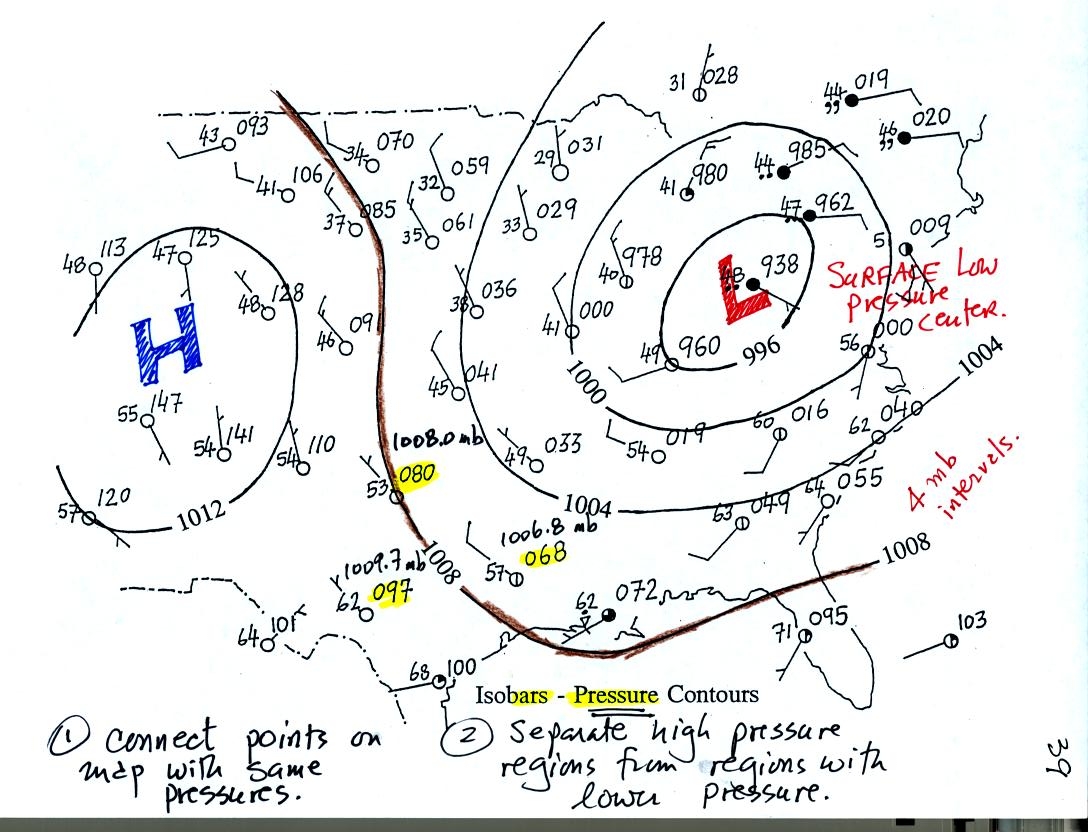
Now the same data with isobars drawn in. Again they
separate
regions with pressure higher than a particular value from regions with
pressures lower than that value.
Isobars are generally drawn at 4 mb intervals. Isobars also connect points on the map
with the same pressure. The 1008 mb isobar (highlighted in
brown) passes through a city where the pressure is exactly
1008.0 mb (highlighted in yellow). Most of the time the isobar
will pass between two
cities. The 1008 mb isobar passes between cities with pressures
of 1006.8 mb and 1009.7 mb. You would
expect to find 1008 mb about halfway between
those two cites, that is where the 1008 mb isobar goes.
Next Monday we'll look at what you can expect to see in the vicinity of
centers of Low and High pressure.