![]()
![]()
![]()
![]()
Hurricanes are extremely energetic storms with very warm cores, high winds and low central pressures. To fuel these storms, hurricanes must somehow tap into an enormous energy source. That energy source is the latent heat of water. We can estimate the amount of energy released by a hurricane knowing approximately how much rainfall a hurricane generated. Remember that for each gram of water vapor that is condensed, 590 calories of energy are released to heat the atmosphere. For comparison, TNT (Trinitrotoluene) releases 1000 cal/g in an explosion. So condensing a gram of water vapor to liquid at normal temperatures releases about 60% of the energy that detonating a gram of TNT would.
Now we want to take rainfall and estimate the latent heat energy released. Remember that
1 gram of liquid water takes up a volume of 1 cubic centimeter. So rainfall of 1 cm depth
means that above every 1 square centimeter of surface, 1 cm of liquid water has condensed and
fallen out. So in every 1 cm square air column, 590 calories of latent heat has been released.
Consider a 100 meter by 100 meter area that received 1 inch = 2.5 cm of rainfall.
The area is 10,000 cm by 10,000 cm = 100,000,000 square centimeters.
The total volume of condensed water that fell
as rainfall was 100,000,000 square centimeter area x 2.5 cm depth = 250,000,000 cubic cm.
Therfore the mass of water condensed 250,000,000 cubic cm x 1 gram/cubic cm = 250,000,000 grams.
Therefore the total latent heat energy released into the air by the rainfall over the 100 meter
by 100 meter
area is 590 cal per gram of water x 250,000,000 gram of water = 150,000,000,000 calories =
150 billion calories.
So, to calculate the latent heat energy released into the air by a hurricane we need to know
ENERGY RELEASED BY HURRICANE = total volume of rainfall x
density of liquid water x
latent heat release per gram water
The rainfall information we need can be estimated from satellite data. Katrina provides a nice example.
Katrina was a very large and intense hurricane that released a huge amount of energy.
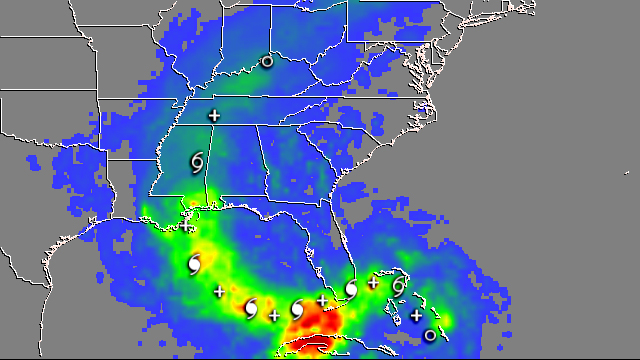 |
| Figure 3: Katrina rainfall |
NOTE: Conversion between different energy units: 1 calorie = 4.184 joules = 0.004 btu.
Let's put this into perspective with some comparisons...
Power generator: Given that Katrina lasted about a week, its rate of energy production (= "power") over that week
was approximately 3x10⁸ megawatts. The power generation of a typical
nuclear generator is about 1,000 megawatts, or 300,000 times less than Katrina!
US annual power consumption vs. Katrina: We can also
compare the energy released by Katrina with the entire annual energy consumption by the United States.
According to the DOE figure below, the U.S. energy consumption for 2004 was 100,000,000,000,000,000 btu
= 100 Quadrillion btu = 1017 btu, less than half of the energy Katrina released in a week.
 |
| Figure : US energy consumption from DOE 2004 Annual Energy Review |
The energy source for hurricanes is latent heat. This must come from evaporation off the ocean surface which will remove energy from the surface and therefore cool the ocean surface. We can see this effect in the following two images that show the sea surface temperature anomaly before and after Katrina came ashore. Anomaly means the difference between the actual sea surface temperature and the typical sea surface temperature for that date. It is clear that the passage of Katrina cooled the ocean surface temperature by approximately 2 °C.
|
| Figure: SST anomaly as Katrina came ashore along the Gulf coast |
|
| Figure: SST anomaly after Katrina came ashore (9/2/2005) |
To understand this ocean cooling effect, recall an exercise we did earlier in class about the energy required to heat a gram of water ice until it was boiling. There were two rates of energy that are relevant here:
| 590 cal/gm x 1 gm/cm3 x 15 cm = 8850 cal/cm2. |
So Katrina evaporatively removed approximately 9000 calories from each square centimeter of ocean
surface along its path. The surface layer of the ocean is quite churned up by the hurricane's winds
so the layer that is cooled extends to a significant depth. Let's try and figure out approximately what
that depth is. So let's ask the question, if the surface layer of the ocean were cooled by 2°C by the
evaporation, how deep would the cooled layer be?
According to the energy transfer in item 1 above, cooling a gram of liquid water by 1°C causes
the water to lose 1 calorie of energy. So if each gram of water in the layer cools by 2°C and
therefore loses 2 calories, how many grams of water are needed to supply the 9000 calories of energy
evaporatively removed from the surface? The answer is 9000/2 = 4500 grams per square centimeter of
ocean surface.
So for each square cm of the ocean surface, 4500 grams of water must be cooled 2°C. Since the water
has a density of 1 gm/cm3 and the surface area is 1 cm2, the depth of the
layer that is cooled by 2°C must be 4500 cm or 45 meters deep. Note that if the layer had cooled by
only 1°C, the layer would have been twice as deep or 90 meters.
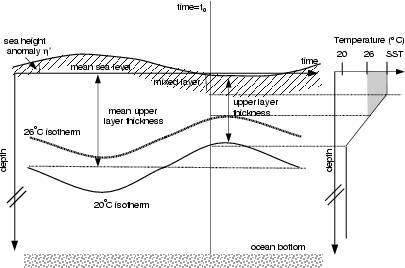
The crucial point is that it is NOT just the sea surface temperature that matters, it is the depth
or thickness of the warm surface layer at the top of the ocean that stores the energy that fuels the
hurricane intensity development and evolution. If the layer of warm water in front of the hurricane
is shallow then the hurricane will weaken as it passes over that layer of water.
|
| Figure: TCHP explanation cartoon |
In an attempt to measure the amount of energy in the near surface ocean layer available to hurricanes, the Tropical Cyclone Heat Potential (TCHP) was created. TCHP is a measure of the integrated vertical temperature between the sea surface temperature and the estimate of the depth of the 26¯C isotherm. 26¯C is used because 26¯C is the magic temperature above which hurricanes form. The TCHP units are energy per surface area (typically kiloJoules/cm2 where 1 kJ = 239 calories). The variation in the vertical thermal structure of the ocean is shown in the cartoon to the right. This material is taken from a NOAA Tropical Cyclone Heat Potential website.
Example TCHP calculation: Note the grey area on the upper right of the figure which closely
reflects our example calculation here.
Suppose the ocean temperature at the surface ("sea surface
temperature" is SST) is 28°C and this temperature extends to 50 m depth. The
ocean temperature then decreases linearly with depth and reaches 26°C at a depth of 100 meters.
TCHP is defined using the temperature minus 26°C which is 2° from the surface to a depth of 50 m
and then decreases linearly to 0° at 100 m depth.
Approximate energy available to the hurricane
| Energy available ~ (temperature-26°C) x heat capacity of water x water density x depth of warm layer |
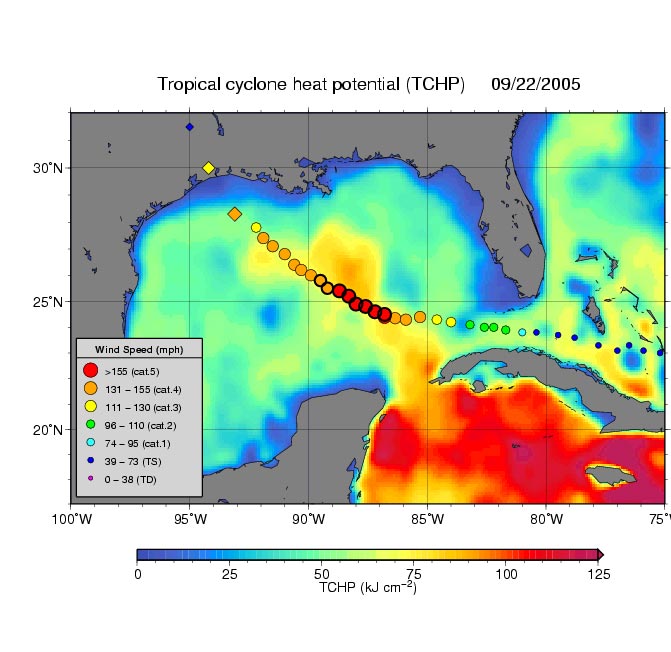
The TCHP is estimated from satellite data. Key satellite variables are the SST and the height of the ocean. Warming the ocean causes it to expand slightly which causes its height to increase. The height is measured by orbiting altimeters. The figure below shows the TCHP estimated for the Gulf of Mexico at the time of hurricane Rita. Notice how closely the TCHP is related to the intensity of Hurricane Rita. It appears that the sharp intensification of Rita over the middle of the Gulf was related to Rita passing over a region of high TCHP. The decrease in Rita's strength as it neared the Texas/Louisiana coast was apparently related to its passing over a region containing less energy (TCHP) in the ocean surface layer in comparison with that in the middle of the Gulf of Mexico.
|
| Figure:Tropical Cyclone Heat Potential and Rita's path and intensity. Tropical Cyclone Heat Potential field in the Gulf of Mexico during September 22, 2005. The path of Hurricane Rita is indicated with circles spaced every 3 hours with their size and color representing intensity (see legend). This hurricane intensified to category 5 as it traveled over the Loop Current and a warm core eddy (the finger of red and yellow). Rita diminished to category 3 as its path went over a region of lower TCHP (and cooler waters) outside the Loop Current and ring. The diamonds indicate the National Hurricane Center predicted track and intensity as it makes landfall, and are spaced by 24 hours. Altimeter data on NASA's Jason-1, the US Navy's GFO, and the European Envisat satellites provide sea surface height data used in generating the TCHP fields. from NASA Rita webpage |
Just as evaporation cools the ocean, the latent heat release into the atmosphere by the water vapor condensation warms the atmosphere. We estimate the atmospheric warming in a manner analogous to the ocean cooling. The heat capacity of air is 0.24 cal/degree/gram(air). The mass of atmosphere in a column is given by the surface pressure divided by gravity. 1000 mb is equivalent to an atmospheric column mass of 1000 grams per square cm.
| Latent heat energy released in an air column = air temperature increase x heat capacity of air x column air mass |
Rearranging and solving for the increase in air temperature gives
| Air temperature increase = Latent heat Energy released in air column / (heat capacity of air x column air mass) |
Plugging in numbers using the average latent heat Katrina released into a column of 9000 calories for
each square centimeter, yields an air temperature increase of
9000 cal/cm^2 / 0.24 cal/degree/gram(air) / 1000 g/cm2
= 36°C.
Now, the air temperature does not actually increase by this much because as the air is warmed it becomes
buoyant and rises and flows out from the top of the hurricane horizontally. As a result the air column is
replaced at least twice as the hurricane passes by (based on the rainfall being roughly twice the water
vapor the air column can hold). Therefore the rise in air column
temperature in the hurricane is no more than half the amount above or <18°C. In terms of absolute
temperature in Kelvin which is degrees Celsius plus 273.15, a typical hurricane surface air temperature of
27°C is 300K in absolute temperature. This increase in the absolute temperature of the air column
can approach 10% near the center of the hurricane. The tremendous decrease in density associated with
this warming is responsible for much of the ~10% decrease in surface pressure at the center of a 900 mb
storm like Katrina and Rita.
Several factors are considered in providing seasonal forecasts of hurricane numbers, intensities and number of landfalling hurricanes. Among the main ones are forecasts of SST and wind shear in the hurricane regions. El Nino and La Nina substantially influence the number of hurricanes in the north Atlantic and northeastern Pacific.
As discussed previously, hurricanes have trouble forming and intensifying in the presence of wind shear. Vertical wind shear refers to the change in winds with height. Hurricanes require low vertical wind shear (less than 8 ms-1). Dr. Gray at the Colorado State University found that El Niþo and La Niþa affect the hurricane season. Specifically El Niþo contributes to more eastern Pacific hurricanes and inhibits Atlantic hurricanes while La Niþa does just the opposite. The influence of El Niþo is particularly evident in the relative low number of Atlantic hurricanes in the strong El Nino years of 1983 and 1997.
 |
| Figure 9: The number of hurricanes (separated by category) in the Atlantic basin each year from 1944 to 2006. |
![]()
![]()
![]()
![]()