Wednesday Feb. 08, 2006
Distribution of the Expt. 2 materials began today. Collect your
data as soon as you can, return the materials, and pick up the
supplementary information sheet. Reports are due on Monday, Feb.
27.
The Quiz #1 Study Guide is now available
online. The quiz is on Wednesday next week. Remember Quiz
#1 will cover material on the Practice Quiz
Study Guide also.
It isn't
enough to use the station model notation to plot weather data on a
surface map. Some additional analysis of the data is
needed. Drawing in contour lines of pressure, isobars, is
probably most useful. Before we look at isobars we will look at
isotherms, contours of temperature.
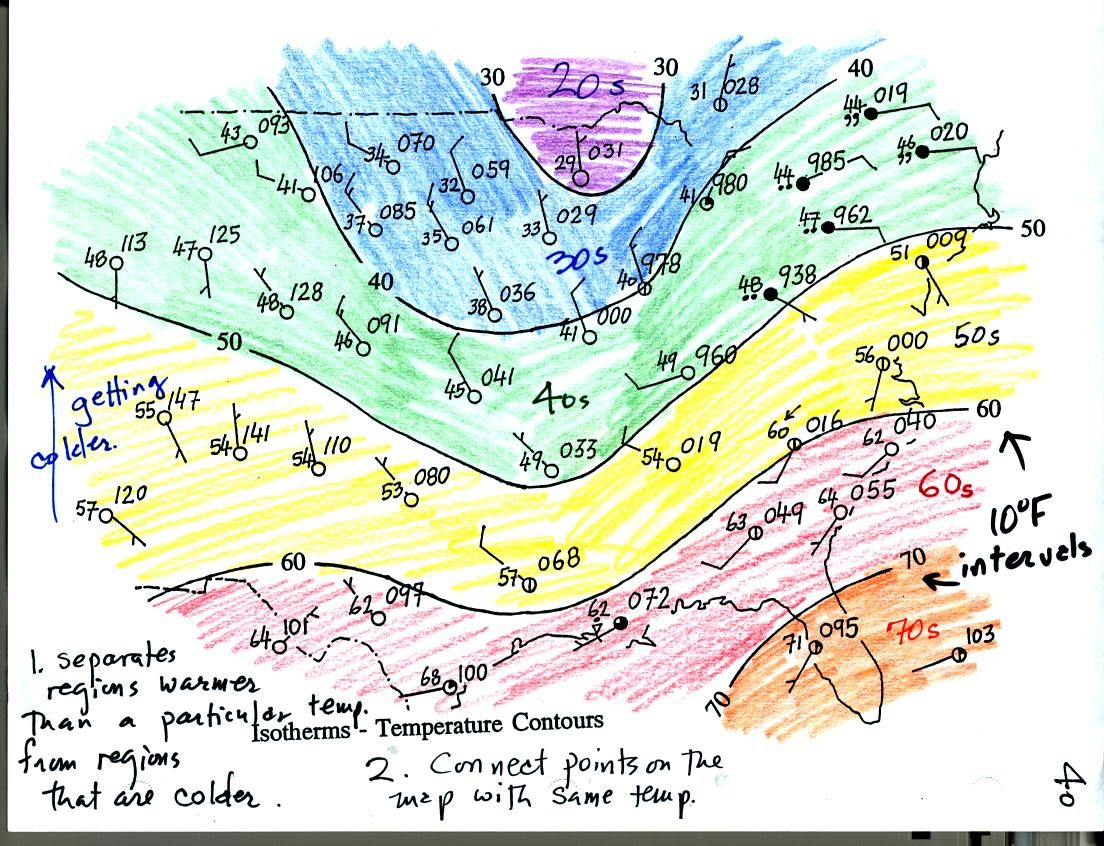
The isotherms, temperature contour lines, are drawn at 10 F intervals.
They do two things: separate regions warmer than a particular
temperature from regions colder than that temperature. The 70 F
isotherm separates the orange (temperatures in the 70s) and red
(temperatures in the 60s) regions on the map. Isotherms also
connect points on the map that have a temperature of exactly 70 F.
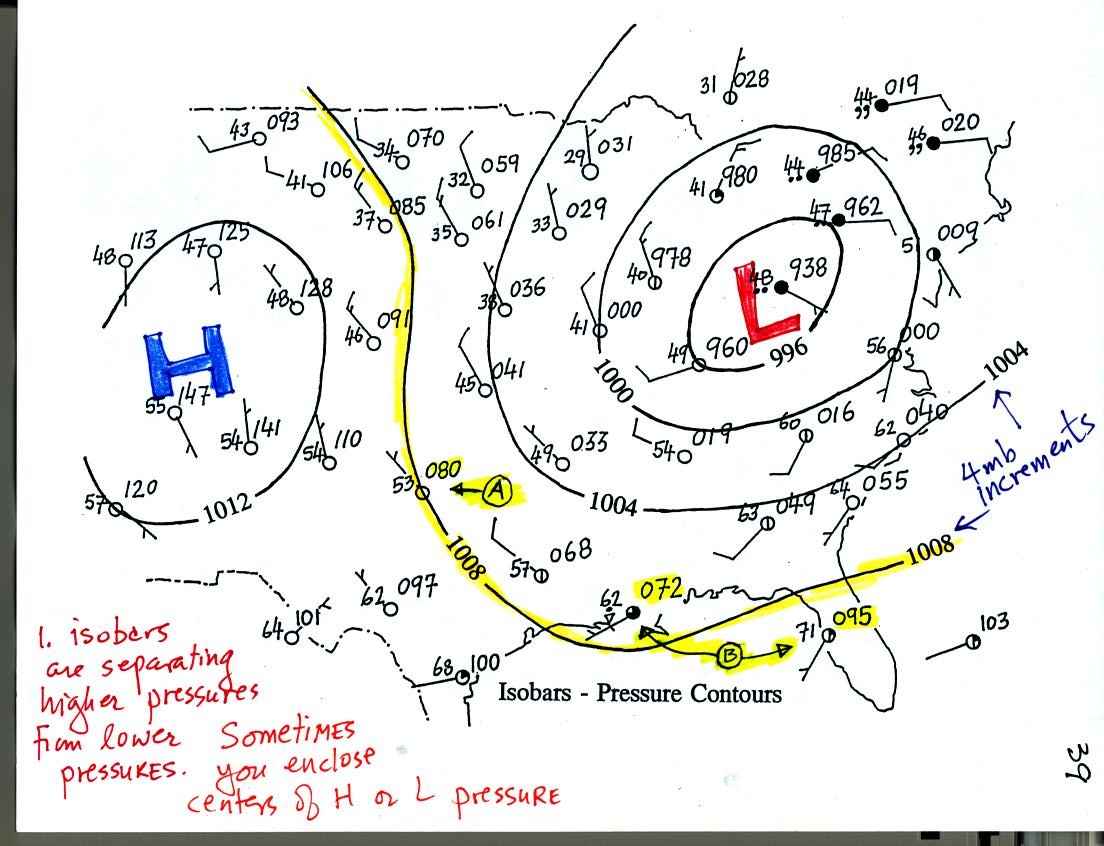
Now the same data with isobars drawn in. Again they separate
regions with pressure higher than a particular value from regions with
pressures lower than that value.
Isobars are generally drawn at 4 mb intervals. Isobars also connect points on the map
with the same pressure. The 1008 mb isobar (highlighted in
yellow) passes through a city at Point A where the pressure is exactly
1008.0 mb. Most of the time the isobar will pass between two
cities. The cities indicated by B have pressures of 1007.2 mb and
1009.5 mb. You would expect to find 1008 mb about halfway between
those two cites, that is where the 1008 mb passes.
OK now
that you have plotted the weather observations and drawn in some
isobars to reveal the large scale pressure pattern. What can you
learn about the weather.
1. The isobars often completely
enclose a relatively circular LOW or HIGH pressure center.
Here are three or four different representations of the winds
associated with surface low pressure centers:
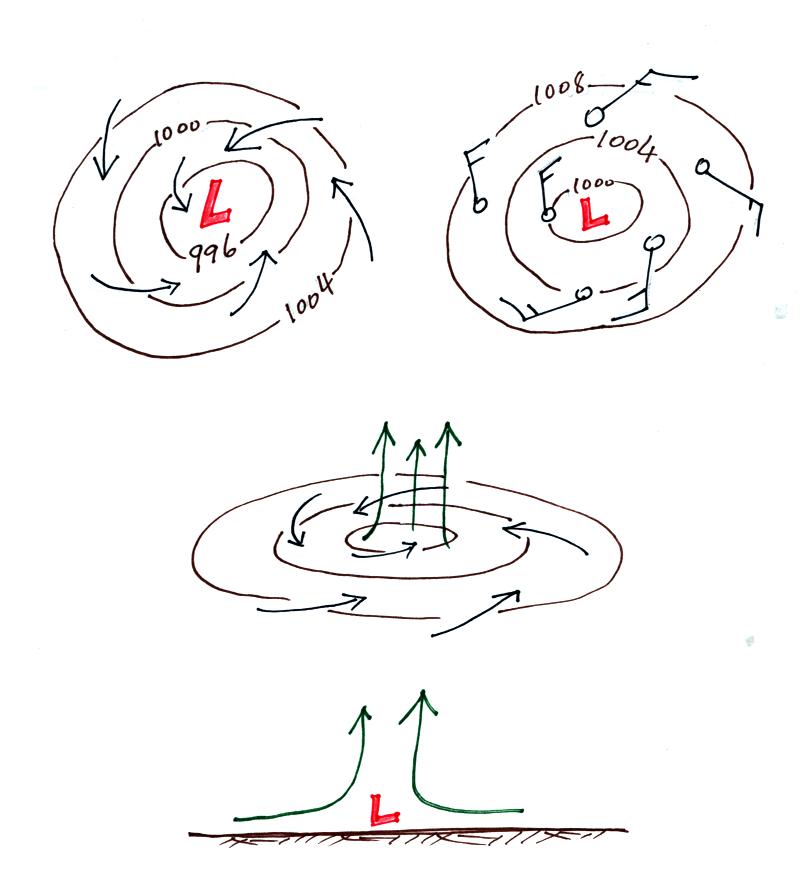
And here are some of the things you can say about horizontal
and
vertical winds motions associated with a surface low
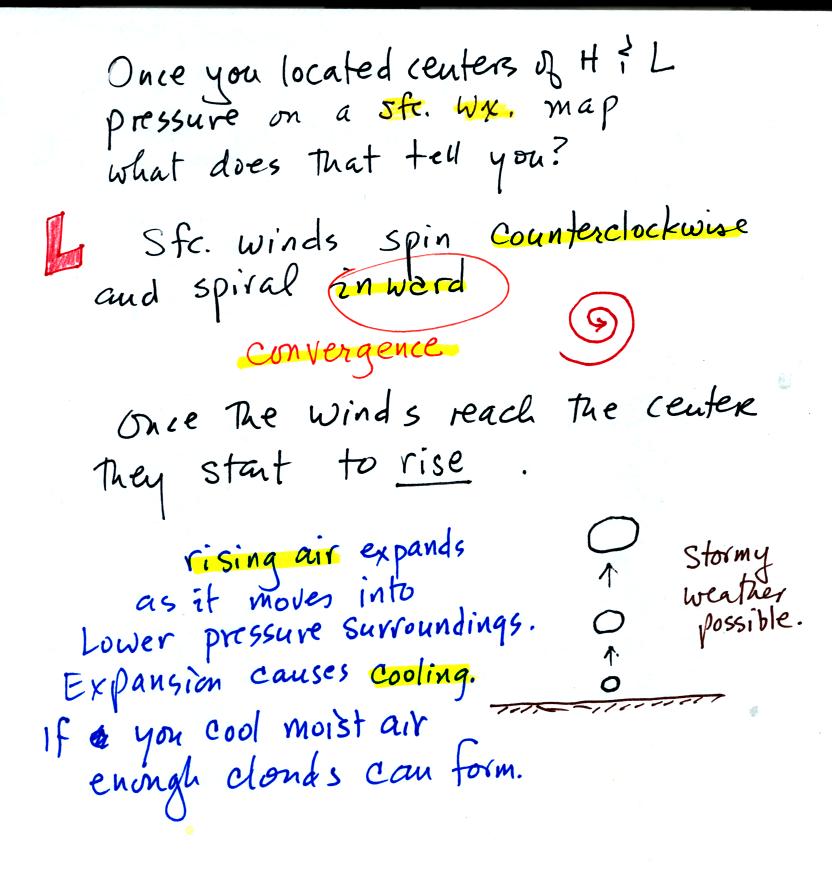
Surface winds converge into surface low pressure
centers. The air
in the center of the low rises. Rising air cools. Cooling
is what you need to make clouds. Thus cloudy stormy weather is
found with surface lows.
Here's what a surface high pressure center looks like:
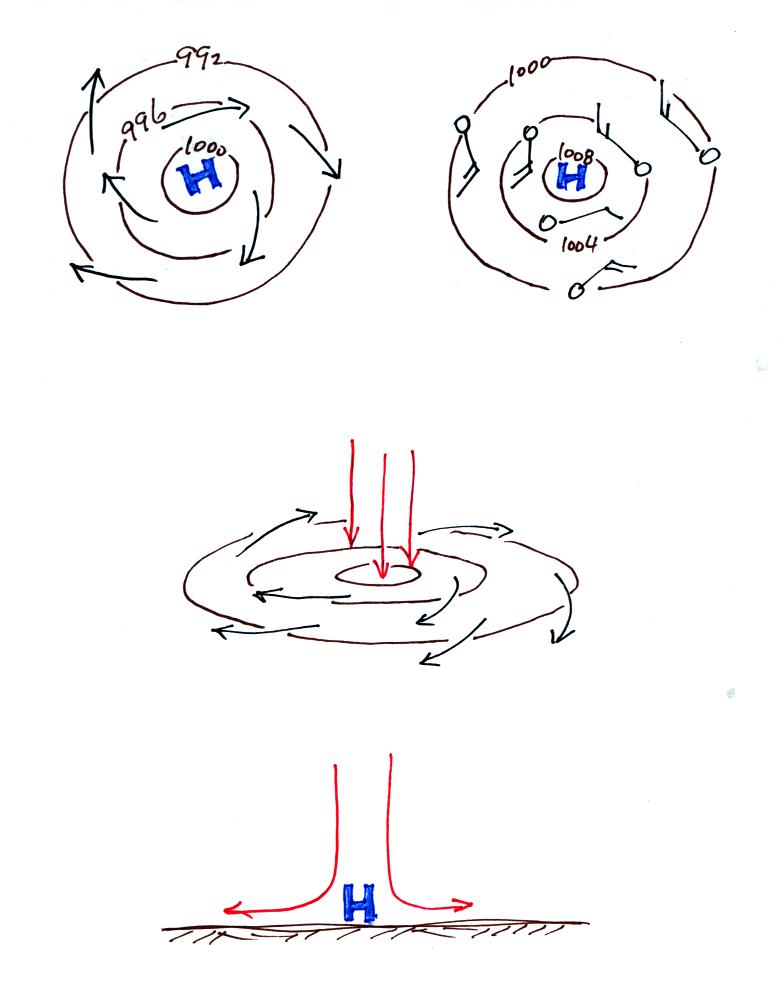
And here's what you would expect to find in the vicinity of
a high.
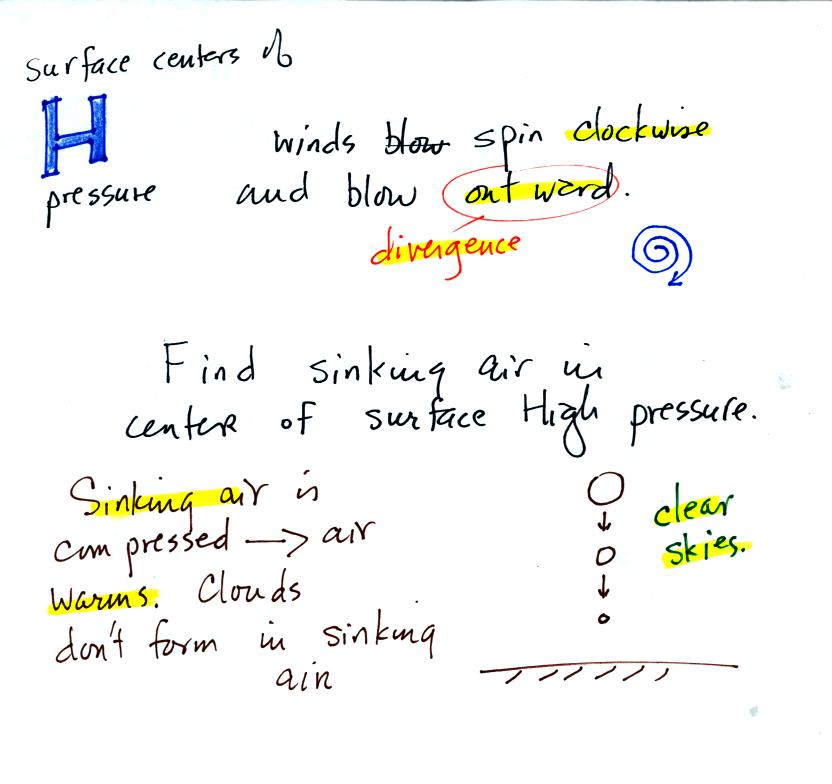
Sinking air motions in the center of a surface high
generally mean
clear skies.
2. Spacing of the isobars - strong and weak pressure gradients
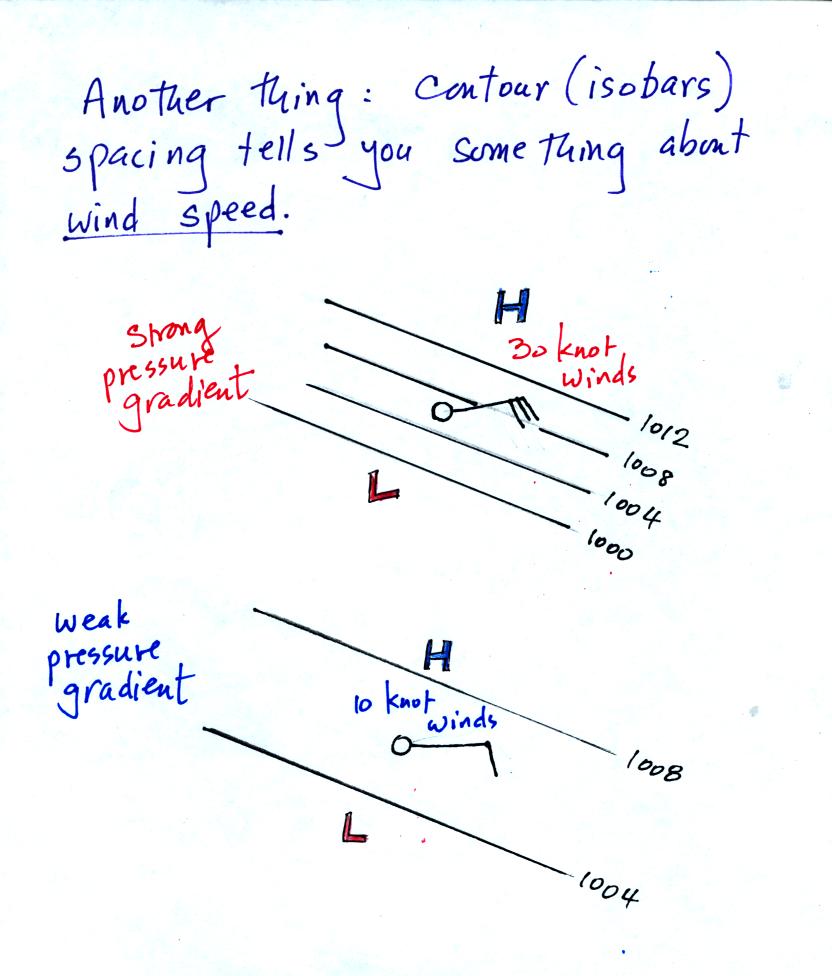
The figure above was not shown in
class. Closely spaced isobars indicate the pressure is
changing rapidly with distance. This is called a strong pressure
gradient. Conversely, widely spaced isobars mean a weak pressure
gradient and slower winds.
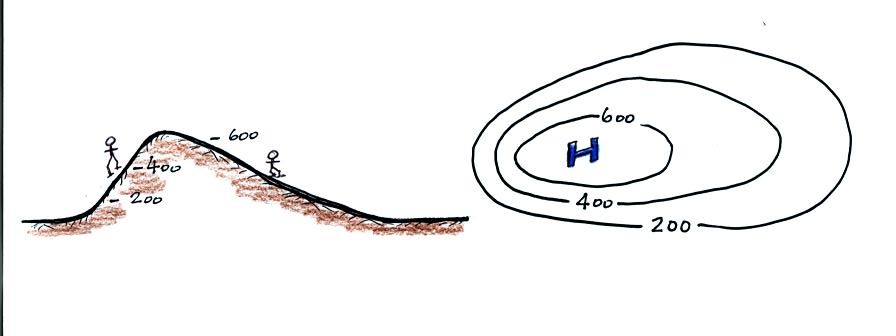
In some respects weather maps are like topographic maps. The map
above at right represents the hill at left. Closely spaced
contours on the topographic map correspond to a steep slope on the
hill. Widely spaced contours depict the gradual slope on the
right side of the hill. If you were to trip and roll downhill,
you would roll faster on the steep slope than on the gradual
slope.
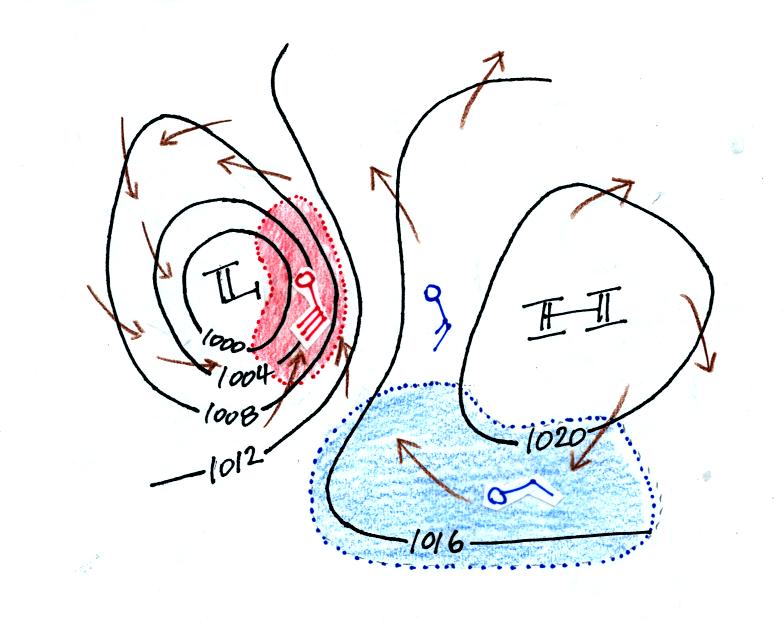
Here's a more complex weather map example. The brown arrows
indicate the directions of the winds (clockwise and outward around the
high, counterclockwise and inward around the low). Fast 30 knot
winds are found in the strong pressure gradient region shaded
red. Slower 10 knot and 15 knot winds are shown in the blue weak
pressure gradient region.
3. Temperature patterns, warm and cold fronts
The pictures below are somewhat
different from and are hopefully a little clearer than those shown in
class.
Winds can affect the surface temperature pattern. The following
picture shows a band of cold air in the north and a band of warm air in
the southern part of the map. This is the kind of temperature
pattern you might expect to see if the wind wasn't blowing (boundaries
between air masses of different temperatures would lie parallel to the
lines of latitude.
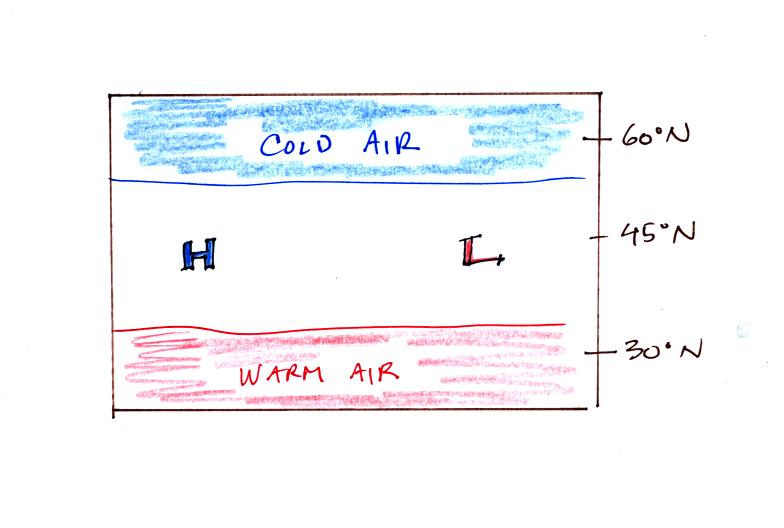
Now we will add the winds spinning around the H and L pressure centers
in the middle of the picture. First the H pressure:
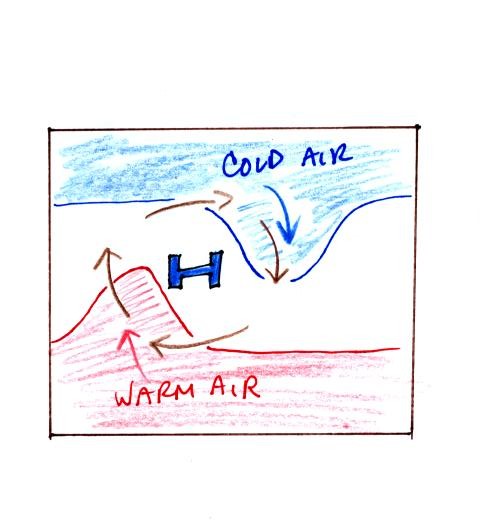
The clockwise spinning winds move warm air to the north of the western
side of the HIGH. Cold air moves toward the south on the eastern
side of the high.
In the case of LOW pressure:
The temperature pattern is the opposite, cold air moves southward
on the western side of the low and warm air moves northward on the
eastern side of the low.
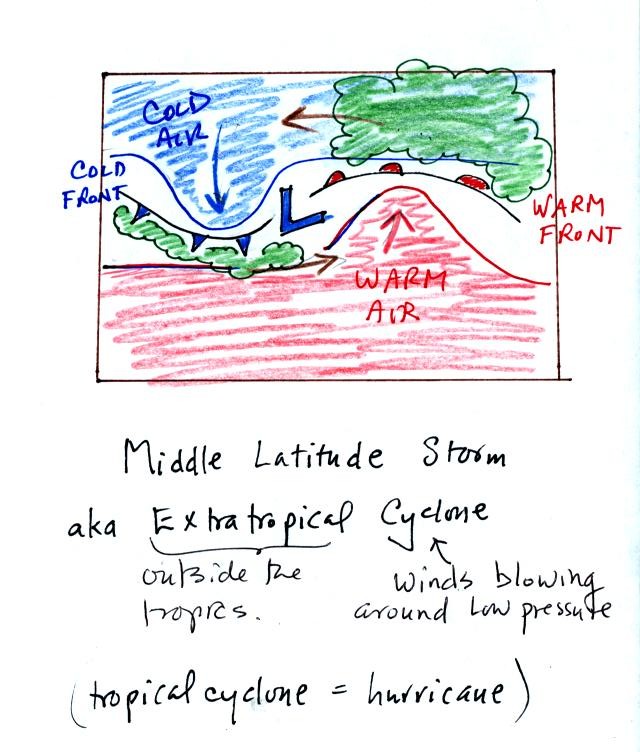
Surface winds converge in toward the center of low pressure.
Sharp boundaries form beween the air masses with different temperatures
as they are brought into contact with each other. A cold front is
low ahead of the advancing mass of cold air on the left side of the
picture. Note the points on the frontal boundary that identify it
as a cold front and show its direction of motion. A warm front is
shown on the eastern side of the LOW and is identified with half
circles).
A low pressure center with fronts is a type of large scale storm system
called a middle latitude storm or an extratropical cyclone.
The following two pictures weren't
shown in class on Wednesday, I've borrowed the following two pictures
from the Sect. 48 Thursday morning class. The picture
below is a crossectional view of a cold front:
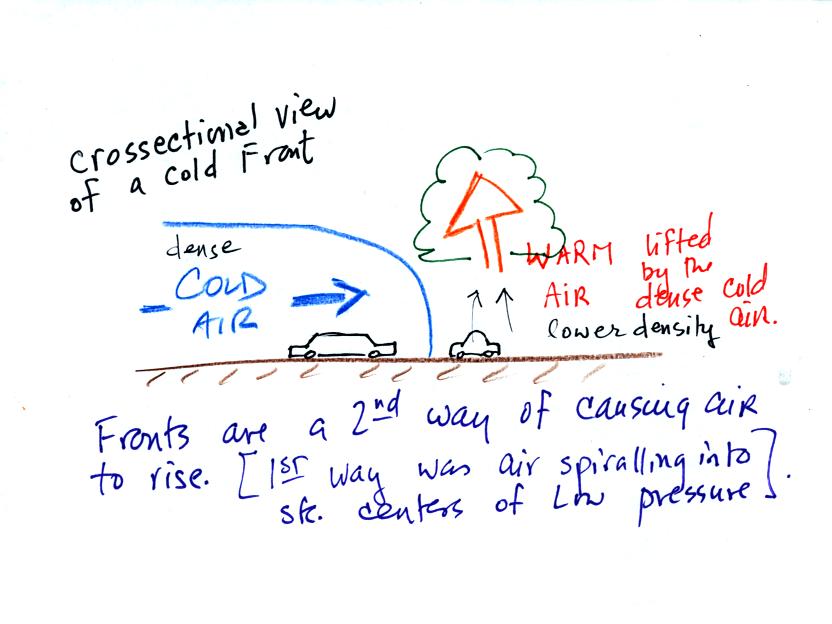
Cold dense air on the left is advancing into warmer lower density air
on the right. The warm low density air is lifted out of the way
by the cold air. Fronts are another way of causing rising air
motions in the atmosphere. Rising air cools and if the warm air
is moist, clouds and precipitation can form
Here's what a warm front looks like:
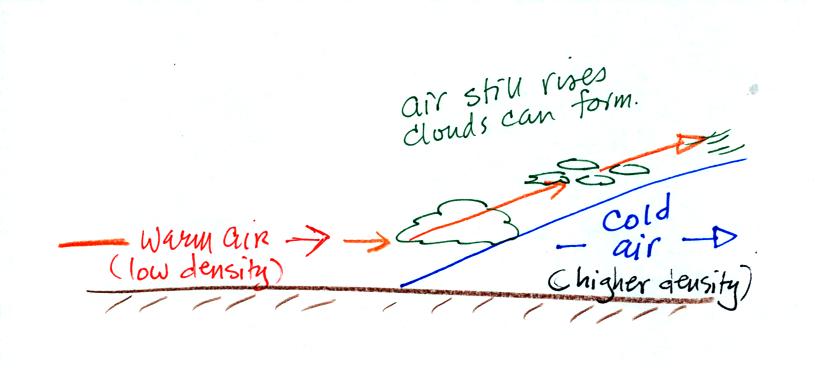
Warm air is advancing into colder air. The warm air is less dense
than the cold air and can't lift the cold air out of the way.
Rather the warm air overrides the cold air. Air is still rising
and cooling, so clouds and precipitation can still form. Clouds
often spread out over a large area ahead of a warm front than ahead of
a cold front.
If you refer back to the map view of the middle latitude storm you will
see clouds drawn in ahead of the cold and warm fronts.