Wed., Apr. 19, 2006

Today was the second day you could turn in an Assignment #3 1S1P report.  We'll get these graded and returned to you as soon as we can.


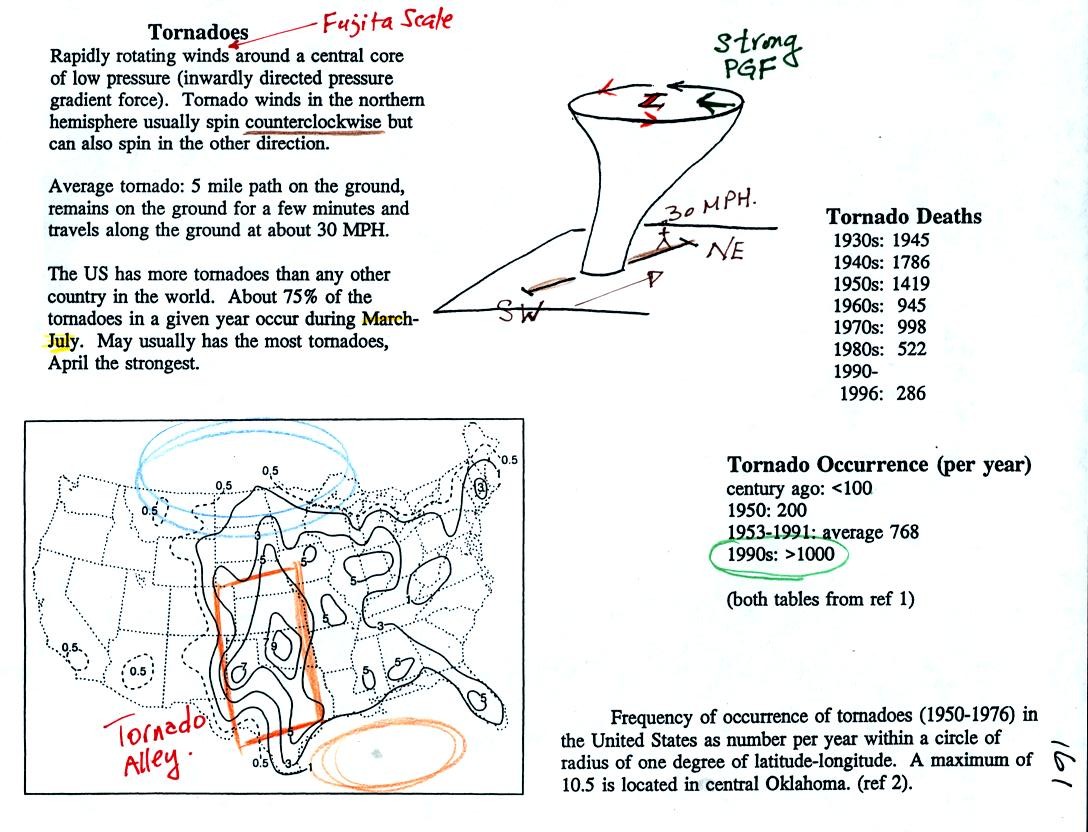
This gives some general information about tornadoes.  Most tornadoes last only a few minutes and leave a path a few miles long on the ground.  There are of course exceptions.  One is discussed below.


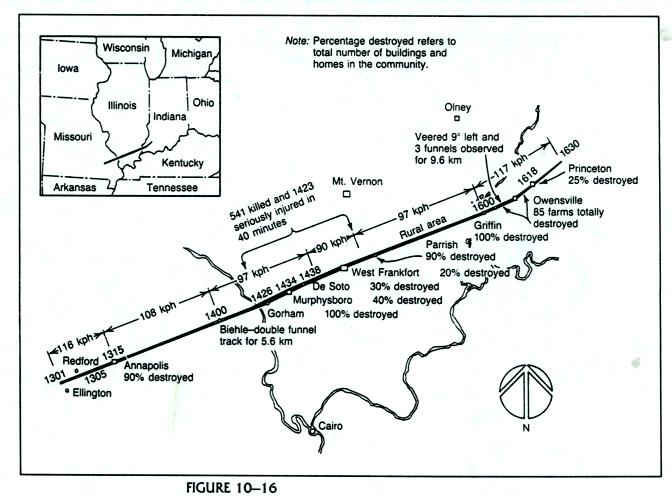
The path of the 1925 "Tri-State Tornado" is shown above.  The tornado path was 219 miles long, the tornado last about 3.5 hours and killed 695 people.  It is the single deadliest tornado ever in US history.


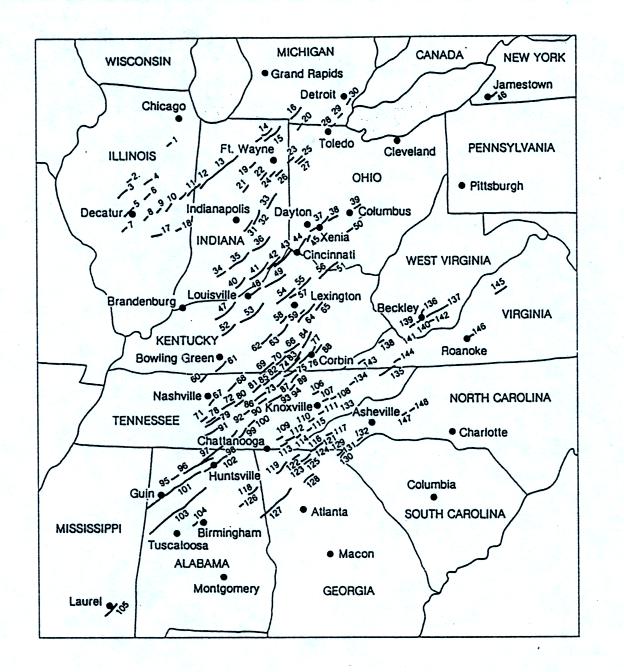
Tornadoes often occur in "outbreaks."  Paths of 148 tornadoes during the April 3-4, 1974 "Jumbo Tornado Outbreak" are shown above.  Note the first tornadoes were located in the upper left corner of the map.  The tornadoes were produced by thunderstorms forming along a cold front.  During this two day period the front moved from the NW part toward the SE part of the figure.  Note that all the tornado paths have a SE toward NE orientation.


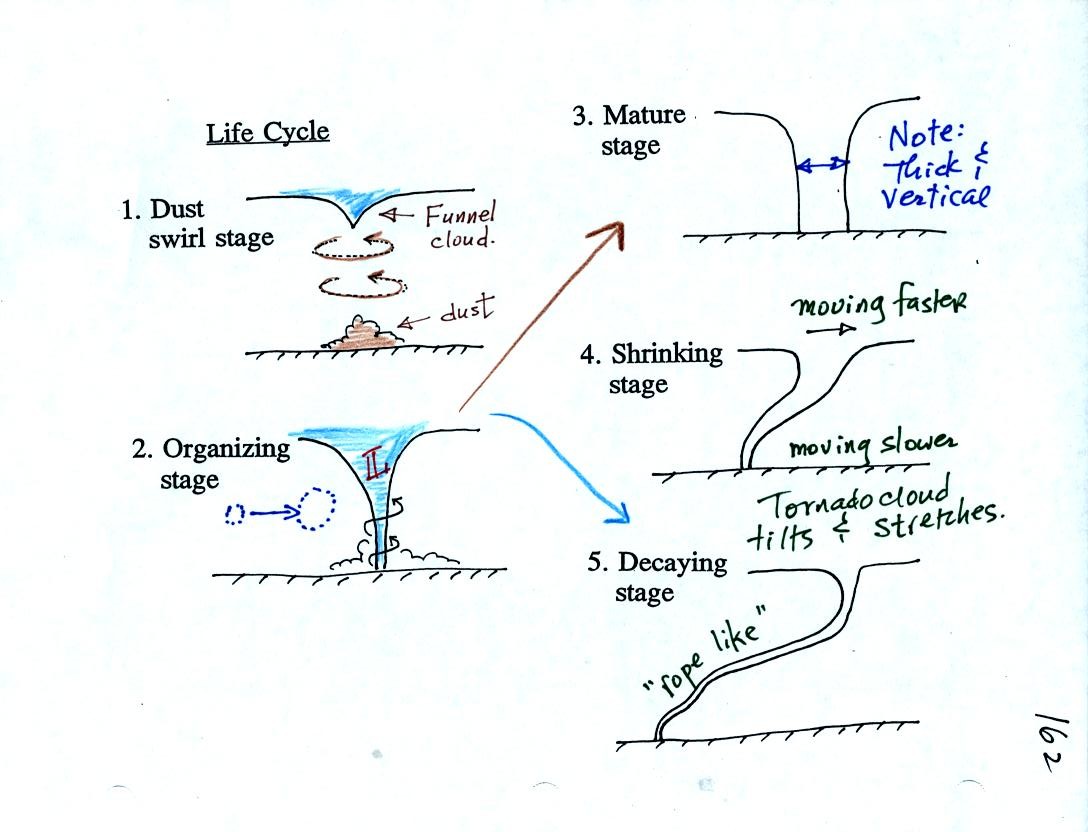
Tornado life cycle (don't worry about learning the names of the various stages).  Tornadoes begin and descend from a thunderstorm.  You might see a funnel cloud dropping from the base of the thunderstorm.  Spinning winds will probably be present between the cloud and ground before the tornado cloud becomes visible.  The spinning winds can stir up dust at ground level.  The spinning winds might also be strong enough at this point to produce some minor damage.

In Stage 2, moist air moves horizontally toward the low pressure in the core of the tornado.  This sideways moving air will expand and cool just as rising air does.  Once the air cools enough (to the dew point temperature) a cloud will form.  The tornado is colored blue above just to reinforce the fact that it is a true cloud and isn't just composed of dust  (dust may mix with the cloud and turn the tornado brown)

Tornadoes can go from Stage 2 to Stage 3 (this is what the strongest tornadoes do) or directly from stage 2 to stage 5.  Note a strong tornado is usually vertical and thick as shown in Stage 3.

The thunderstorm and the top of the tornado will move faster than the surface winds and the bottom of the tornado.  This will tilt and stretch the tornado.  The rope like appearance in Stage 5 is usually a sign of a weakening tornado.


The first of several tornado video tapes was showed at the end of class.  This video (a tornado that formed near Luverne Oklahoma on May 15, 1991) illustrated well the first three stages of the tornado life cycle.  The tornado was given an F3 rating.  This refers to the Fujita Scale used to rate tornado strength or intensity.  

A second video tape showed short recordings of several tornadoes.  They are summarized in the table below

54a
F3
Grand Island, NE
Mar. 13, 1990
tornado cloud is pretty thick and vertical
61f
F3
McConnell AFB KS
Apr. 26, 1991
this is about as close to a tornado as you're ever likely to get.  Try to judge the diameter of the tornado cloud.  What direction are the tornado winds spinning?
52
F5
Hesston KS
Mar. 13, 1990
Watch closely you may see a tree or two uprooted by the tornado winds
51
F3
North Platte NE
Jun. 25, 1989
Trees uprooted and buildings lifted by the tornado winds
65
F1
Brainard MN
Jul. 5, 1991
It's a good thing this was only an F1 tornado
57
F2
Darlington IN
Jun. 1, 1990
Tornado cloud without much dust
62b
F2
Kansas Turnpike
Apr. 26, 1991
It's sometimes hard to run away from a tornado.  Watch closely you'll see a van blown off the road and rolled by the tornado.
47
F2
Minneapolis MN
Jul. 18, 1986
Tornado cloud appears and disappears.


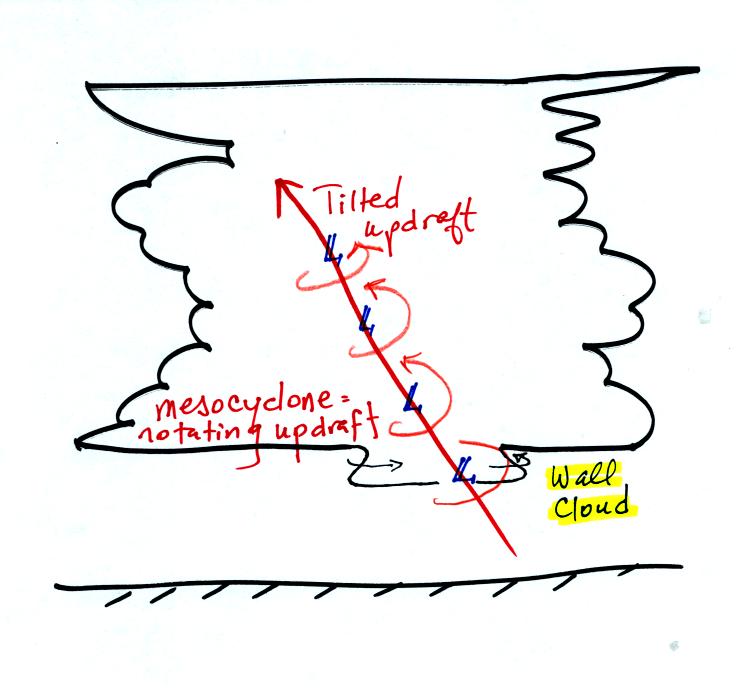
Tornadic thunderstorms have rotating updrafts called mesocyclones (cyclone refers to winds spinning around low pressure, meso means medium size scale).  Air moving into toward the low pressure core of the mesocyclone will expand and cool. The cloud that extends below the cloud base and surrounds the mesocyclone is called a wall cloud.  The largest and strongest tornadoes will generally come from the wall cloud.

The next two figures weren't shown in class.
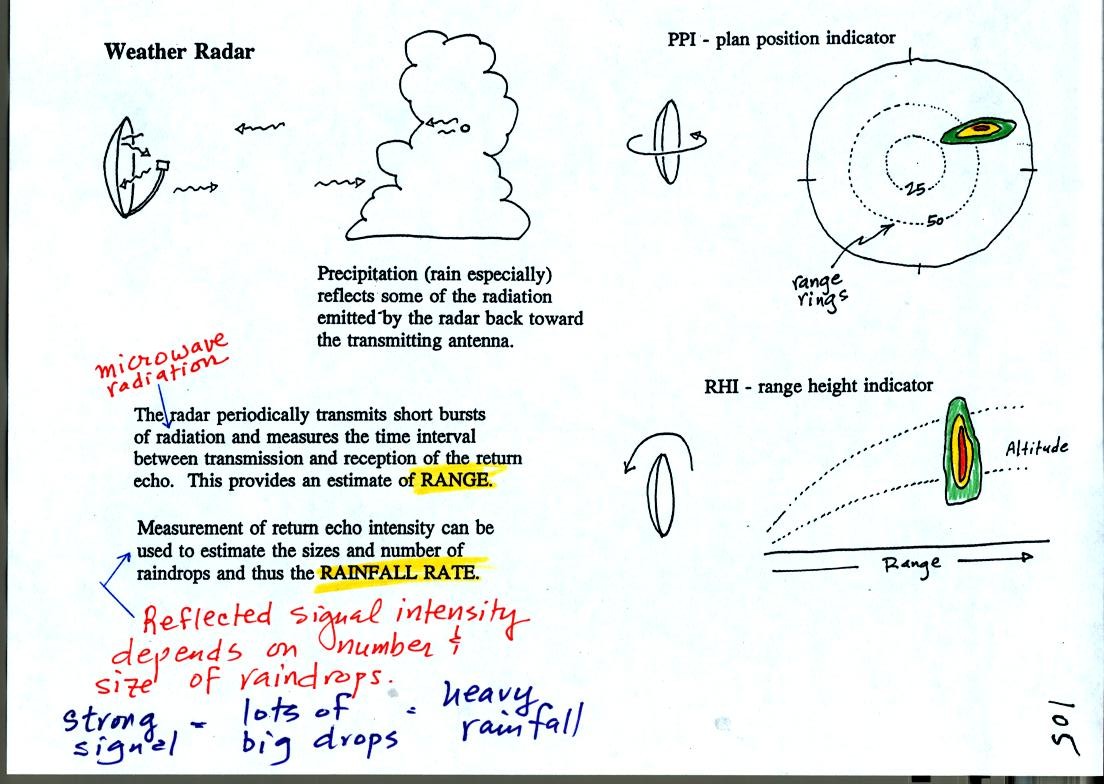
Weather radar plays an important role in spotting and warning of severe thunderstorms and thunderstorms that could potentially produce a tornado.  It is worth reviewing briefly how radar works. 


An ordinary radar can first locate a thunderstorm (direction and distance from the radar antenna).  It can also provide an estimate of rainfall intensity and can be used to warn of flash flooding.  Once a radar has located a storm the radar can scan vertically through the storm (range height indicator mode above).

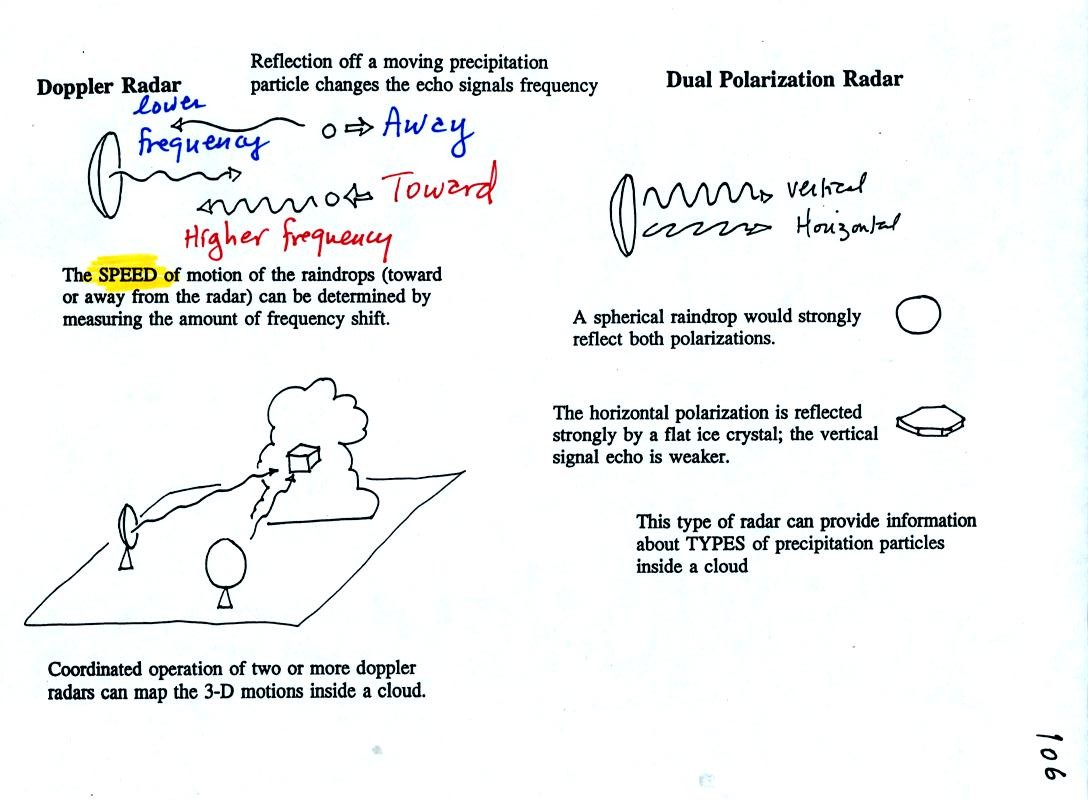
A second type of radar, Doppler radar, is explained below

A Doppler radar doesn't just measure the strength of the reflected signal but also detects any change in the frequency in the return signal.  In this way it can measure how quickly precipitation particles in the storm cloud are moving toward or away from the radar antenna.  Since the precipitation is moved by the cloud's winds you are really able to get a picture of the interior wind motions of the thunderstorm.

Small mobile doppler radars mounted on trucks can drive to a storm and get close enough to be able to measure the rotating winds in tornadoes.


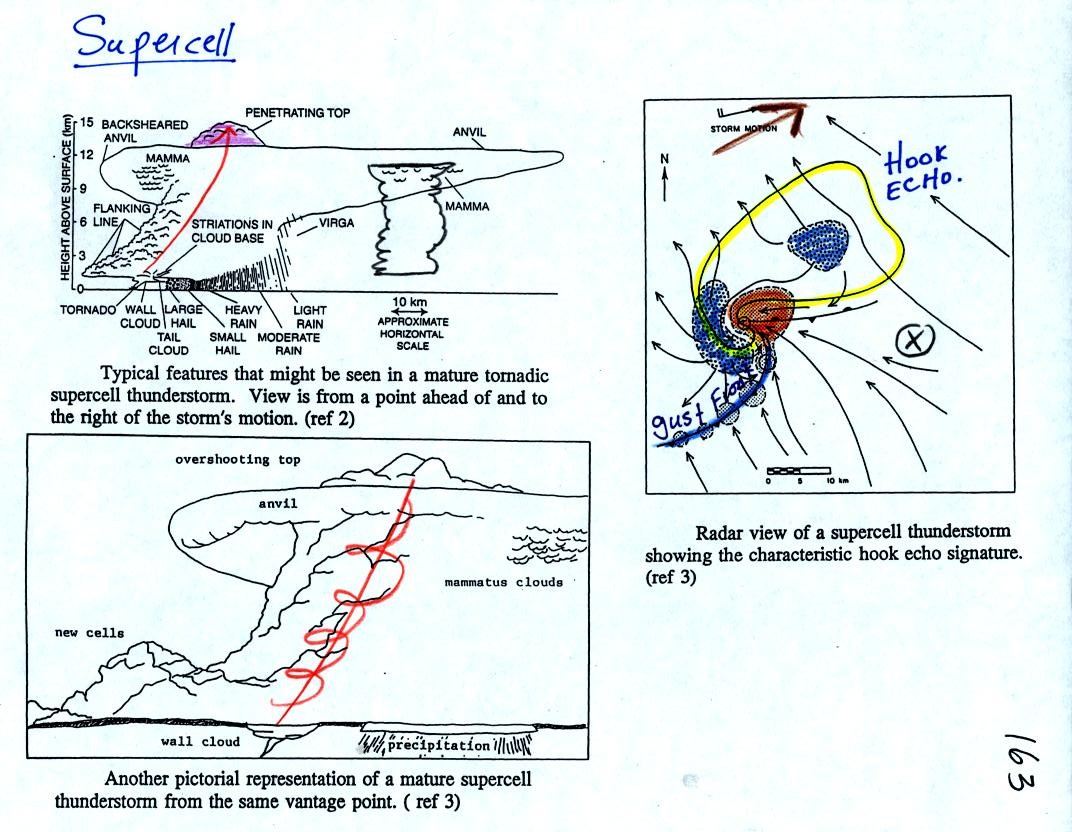
Before viewing the third video tape of the day, which shows supercell thunderstorms, it is worth learning about some of the characteristic features on a supercell thunderstorm.

Supercells are first of all much larger than ordinary air mass thunderstorms (see comparison in top left figure above).  In ordinary thunderstorms the updraft is unable to penetrate into the very stable air in the stratosphere.  The upward moving air just flattens out and forms an anvil.   In a supercell the updraft is strong enough to penetrate into the stratosphere a little ways. This produces the overshooting top or dome feature above.  Walls clouds are shown at the bottoms of both of the sketches above at left.  The flanking line is a line of new cells trying to form alongside the supercell thunderstorm.

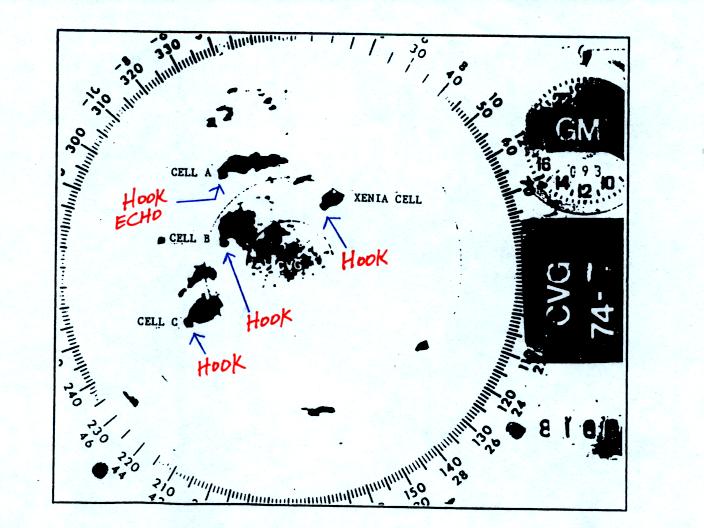
A radar picture of a supercell thunderstorm will often have a characteristic hook shape.  The hook is caused by spinning motions inside the thunderstorm  An example of a hook echo is shown in the figure above at right.  The orange shaded area is the thunderstorm updraft, the mesoscylone.  Blue shaded areas shown where precipitation falls out of the cloud.  The flanking line of new cells is forming along a gust front produced when cold downdraft air from the thunderstorm collides with prexisting winds.  Weak tornadoes can sometimes form along the gust front.  The largest and strongest tornadoes come from the mesocylone and wall cloud.


Here is an actual radar display.  Four thunderstorms with hook echo signatures have been identified.


There was just enough time at the end of class for a 3rd video tape. 

The beginning of the video segment showed the April 26, 1991 Andover KS tornado again (it was seen in two of the segments on the 2nd tape shown earlier).  This tornado had a 45 mile long path, winds that reached 260 MPH, and killed 17 people. 

This was followed by several views of supercell thunderstorms and wall clouds, and a computer simulation showing the complex wind motions inside a supercell thunderstorm.