![]()
![]()
![]()
![]()
![[tornado]](tornado.jpg)
|
| Tornado with condensation | funnel |
![[tornado]](tornado2.jpg) |
| Tornado with debris funnel |
Although tornadoes can happen almost anywhere on Earth, the United States is by far the tornado capital of the world. Around 75% of all reported tornadoes are in the United States. Each year, tornadoes take the lives of many people. The yearly global average is about 100 deaths (80 deaths in the United States alone, along with over 1500 injuries per year), though the numbers can be highly variable from year to year. It is not all that uncommon for over 100 people to die in a single day when conditions are favorable for strong tornadoes to develop. The deadliest tornadoes are those that occur in families; that is, different tornadoes all spawned within a region with favorable atmospheric conditions for tornado development.
When a large number of tornadoes (typically 6 or more) forms over a particular region, this constitutes a tornado outbreak. One of the most violent occurred on April 3 and 4, 1974. During a 16 hour period, 148 tornadoes cut through parts of 13 states, killing 307 people, injuring more than 6000, and causing an estimated $600 million in damage.
An extreme tornado outbreak occured in the southeastern United States from April 25 - 28, 2011. There were 359 confirmed tornadoes in 21 states. A record number of 208 tornadoes were observed on April 27 alone and four of those have been classified as EF-5 tornadoes, the strongest category for tornadoes. A record number of 335 people were killed by tornadoes on April 27, 2011, the most tornado deaths recorded in a single day. About one month later on May 22, the devastating EF5 Joplin tornado struck Joplin, Missouri, killing 155 people. This was the deadliest single tornado to strike the US since 1947. (The 335 deaths on April 27 were attributed to many different tornadoes). Throughout 2011, there were 1897 tornadoes reported in the United States, the second highest annual total since records began in 1953. Thus, 2011 will go down as one of the worst tornado years in US history.
More recently, there was a tornado outbreak on December 10 and 11, 2021. Two long track EF4 strength tornadoes were observed. The states of Kentucky, Tennessee, Missouri, and Arkansas had the largest impacts. The outbreak killed 90 people and resulted in devastaing property damage.
Many in the media have tried to connect the strong 2011 tornado season in the United States with global warming or climate change. Some predicted even more tornadoes in 2012 and beyond. However, a quick study of the historical tornado data in the United States does not indicate a trend torward more or stronger tornadoes in recent decades or years (see figures below). The figure on the left side shows the total annual number of tornadoes reported in the United States for the years 2005 through 2022. The highest annual counts happened in 2008 and 2011 with 1692 and 1691 reported tornadoes respectively. There is a lot of variability from year to year, though. After the severe 2011 tornado season, the following three years had low numbers of tornadoes. In fact 2014 had the lowest annual number of US tornadoes (886) since counting officially began in 1953. The annual tornado count remained below the 2005 to 2022 average for five years after 2011. Starting in 2017, the annual tornado count has fluctuated each year from above to below average. Last year (2022), there were 1195 reported tornadoes, which is above the avearage of 1213 per year.
The figure on the right side shows the number of strong to violent tornadoes, which are defined as torndoes of category EF3 or higher with winds over 135 mph (miles per hour) [218 kmh (kilometers per hour)]. Tornado classification by wind speed is described in the next section. These EF3 and stronger tornadoes are responsible for the majority of the total death and damage costs due to tornadoes even though they are far less common than weaker tornadoes. If there were a trend toward stronger torndoes, then we would see it in the figure on the right. The deadly and destructive 2011 tornado season stands out with 83 strong tornadoes. However, there was not another above average year for strong tornadoes in the seven years following 2011. In fact 2018 had the lowest number of strong US tornadoes (only 12) since record-keeping began in 1954. The string of years with below average strong tornadoes ended in 2019 as there were 36 reported strong tornadoes. However, the reported number of strong tornadoes in 2020 - 2022 were 24 each year, which is again below the 2005 to 2022 average. By the way, 1974 had the highest number of strong tornadoes with an amazing 137 reported that year. So, if anything, there have been perhaps fewer violent tornadoes in recent decades, though this would have to be tested for statistical significance. While these recent years are not proof that climate change will not result in more and/or stronger future tornadoes, it does cast some doubt on predictions of increasing tornado activity as a result of recent global warming.
Note that while the December 2021 tornado outbreak was deadly and destructive, the 2021 season totals for the number of reported tornadoes and strong tornadoes do not stand out as extremely high when viewing the 2005 to 2022 graphs above. The outbreak was the worst tornado outbreak in the month of December since official records have been kept. Though we need to keep in mind that deadly tornadoes can strike during any month of the year. There have been many articles recently that try to tie the Decenber 2021 tornado outbreak to climate change, but statistics of annual tornado numbers do not support a strong connection.
![[UStornado]](US_tornadoes_2022.png) |
![[UStornadoF3]](US_strong_tornadoes_2022.png) |
| The Total number of reported tornadoes in the United States each year from 2005 to 2022. The red line shows the average annual number of tornadoes over this time period, which is 1213. Data obtained from NOAA tornado statistics. | Number of strong and violent tornadoes in the United States (category EF3 or higher) each year from 2005 to 2022. The red line shows the average annual number of tornadoes over this time period, which is 31.2. Data obtained from NOAA tornado statistics. |
In spite of the fact that recent tornado data that does not indicate a significant trend in either the number or intensity of tornadoes in the US, there seems to be a common misconception that tornadoes are becoming more common and severe. One reason may be that there is a significant increase in the number of reported tornadoes from 1950 into the 1990s. However, this is entirely due to an increase in the number of reported weak tornadoes. The increase was in EF0 tornadoes, which is the weakest category of tornadoes with wind speeds of 65 to 85 miles per hour (see section on tornado winds below). The reason for this increase is simple ... Prior to the 1990s many weak tornadoes went undetected. Today, with Doppler Radar, which detects tornadoes remotely, higher population densities, and a more tornado-aware public, which includes storm chasers, few, if any, tornadoes go undetected. The past underreported tornadoes seem to have been primarily the weakest tornadoes. Most of the strong tornadoes were probably detected back to the 1950s.
Take a look at this figure, which all reported tornado tracks from 1950 - 2016. Note the little graph in the lower left of the image, which shows the number of tornadoes per year, color coded by the tornado intensity scale. Note the obvious increase in EF0 tornadoes from 1950 to the early 1990s (light green shading) with no discernable trends in stronger category tornadoes. Here is a similar figure, which shows all EF4 tornado tracks from 1950 - 2016. Note the graph in the lower left corner down not show an increase in these stronger tornadoes. Since the majority of damages and deaths are associated with the stronger category tornadoes, possible trends in these violent tornadoes is most important when considering impacts to people. Despite what you may have heard in the "news", the available data on US tornadoes does not indicate that climate change is resulting in either stonger or more tornadoes.
The strong winds of a tornado can destroy buildings, uproot trees, and hurl all sorts of lethal missiles into the air. Our earlier knowledge of the furious winds of a tornado came mainly from observations of the damage done and the analysis of motion pictures.
In the late 1960s, the late Dr. T. Theodore Fujita, a noted authority on tornadoes at the University of Chicago, proposed a scale (called the Fujita scale) for classifying tornadoes according to their rotational wind speed based on the damage done by the storm. The way this scale has been used is that a tornado's windspeed is estimated based on the damage caused by the tornado (after the fact). The Fujita scale has six categories for tornadoes, labeled F0, F1, F2, F3, F4, and F5, where F0 is the weakest category and F5 the strongest category. Later research has shown that the Fujita scale overestimates the actual windspeeds in tornadoes. For example, it was once believed that the strongest tornadoes produced winds of 300 mph or greater. New research estimates that the strongest tornadoes produce winds of around 250 mph.
Starting February 1, 2007, the National Weather Service revised the original Fujita scale linking tornado damage to windspeed. The new scale is called the enhanced Fujita scale (EF scale). There are still 6 categories for tornadoes (now EF-0 through EF-5). The new EF scale was developed to improve the estimation of windspeed based on the damage by better considering the structural integrity of different building types.
The majority of tornadoes (74%) have peak winds of 100 mph or less and are classified as EF0 or EF1 tornadoes. These tornadoes are responsible for only about 4% of all tornado deaths. On the other end of the scale, only about 1% of all tornadoes are classified as EF4 or EF5 tornadoes with winds over 165 mph. However, these strong tornadoes are responsible for about 67% of all tornado deaths.
Tornadoes occur in many places of the world, but no country experiences more tornadoes than the United States, which averages more than 1300 annually. Roughly 75% of all tornadoes reported worldwide occur in the United States. Canada is a distant second, with around 100 per year. Other locations that experience frequent tornado occurrences include northern Europe, western Asia, Bangladesh, Japan, Australia, New Zealand, China, South Africa, and Argentina. Most tornadoes are classified as weak with the strongest winds under 100 miles per hour. Within the United States, 77% of tornadoes are classified as EF0 and EF1. While these weak tornadoes make up the majority of reported tornadoes, they account for a small percentage of the total damages and deaths from tornadoes. The majority of the damages and deaths are associated with relatively rare, violent tornadoes. In fact, the strongest categories, EF4 and EF5 combined, account for about 1% of the total number of tornadoes, but 67% of all tornado deaths.
![[Conditions leading to severe thunderstorms in central U.S.]](airmass.gif)
| Conditions favorable for tornadoes in the central US. Warm moist air from the Gulf of Mexico in the lower troposphere combined with cold air above provides unstable conditions. In addition, there is vertical wind shear since the warm and cold air are coming from different directions. |
While tornadoes have occurred in every state, the greatest number or tornadoes occur in the central and eastern United States. The figure on the left shows the basic reason why this region of the Earth experiences the greatest number of tornadoes. This area is unique on Earth. A warm ocean surface lies to the south and a large continental land mass to the north with no mountainous barriers (east of the Rocky Mountains) to prevent the clash of warm, humid air masses from the south and very cold, dry air masses from the north (See figure on left). This also explains why this region experiences high numbers of severe thunderstorms as well. We are going to focus on the locations where violent tornadoes are most common, since these are the tornadoes that cause the majority of damages and deaths.
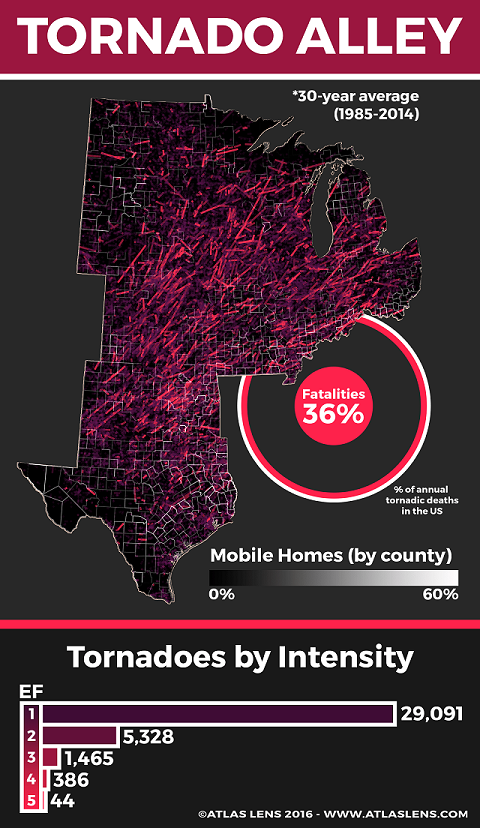
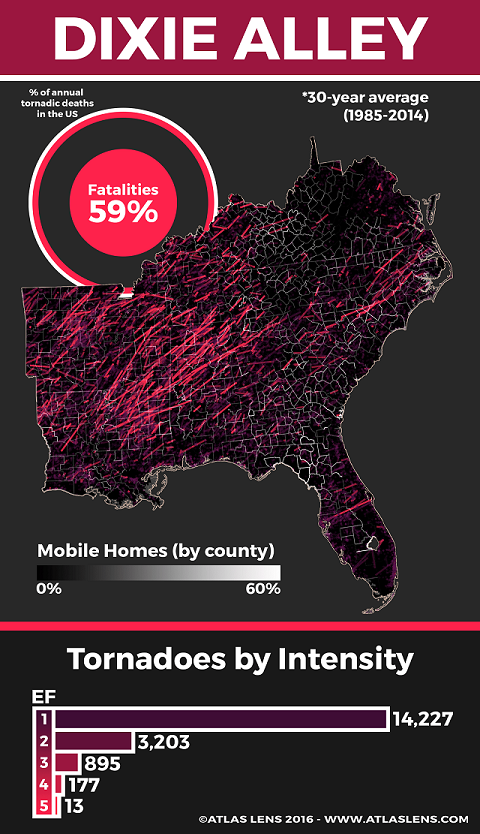
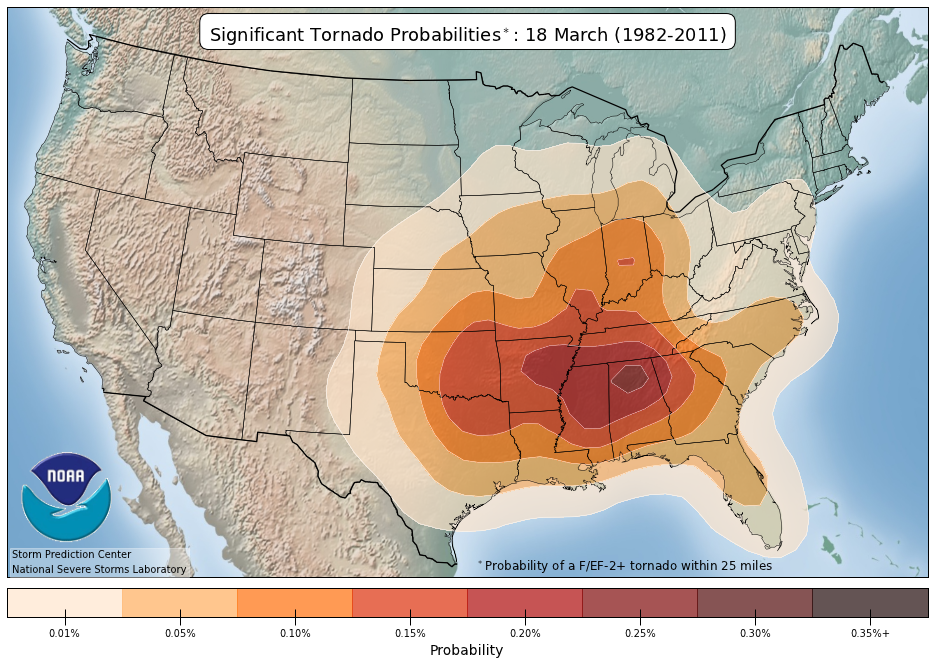
There are two regions within the United States where violent tornadoes form most often with large impacts to people. By far, these regions experience the most violent tornadoes of anywhere on Earth. These regions are commonly referred to as "Tornado Alley" and "Dixie Alley." While these names are used often, there is really no agreed upon boundaries for these regions. Tornado alley definitely includes the central and southern plains from central Texas and Oklahoma northward through Kansas and Nebraska. The figure below on the left includes much of the midwestern states within tornado alley as well, a region with a long history of violent tornado impacts. According to the figure, there have been over 7,200 tornadoes with intensities of EF2 and higher in tornado alley over the 30 year period from 1985 - 2014. The figure below on the right indicates the region in the southeastern United States known as Dixie Alley. According to the figure, there have been over 4,200 tornadoes with intensities of EF2 and higher in Dixie Alley from 1985 - 2014. Thus, there are more strong and violent tornadoes in Tornado Alley, and this region can continue its worldwide reputation as the place with the most spectacular and violent tornadoes. Much of tornado alley is over flat geography with many criss crossing roads, which makes it a great area to observe and photograph tornadoes. Storm chasers from around the world invade the area every spring and early summer hoping to view spectacular tornadoes. Despite the well deserved notarity surrounding tornado alley, a larger number of tornado fatalities have occurred in Dixie Alley over the period from 1985 - 2014. According to the figures below, 59% of US tornado fatalities occurred in Dixie Alley compared with 36% in tornado alley. Most likely, the biggest reason there are more deaths from fewer violent tornadoes in Dixie Alley is that the population density is greater in the Dixie Alley region compared with the tornado alley region. Tornado fatalities are much less common in the other areas of the United States. Only 5% of all tornado deaths in the US from 1985 - 2014 took place in the northeastern states that are not included within either tornado or Dixie alley. There were no tornado fatalities over this period in the region west of tornado alley, which includes the areas from the Rocky Mountains to the Pacific Ocean.
 |
 |
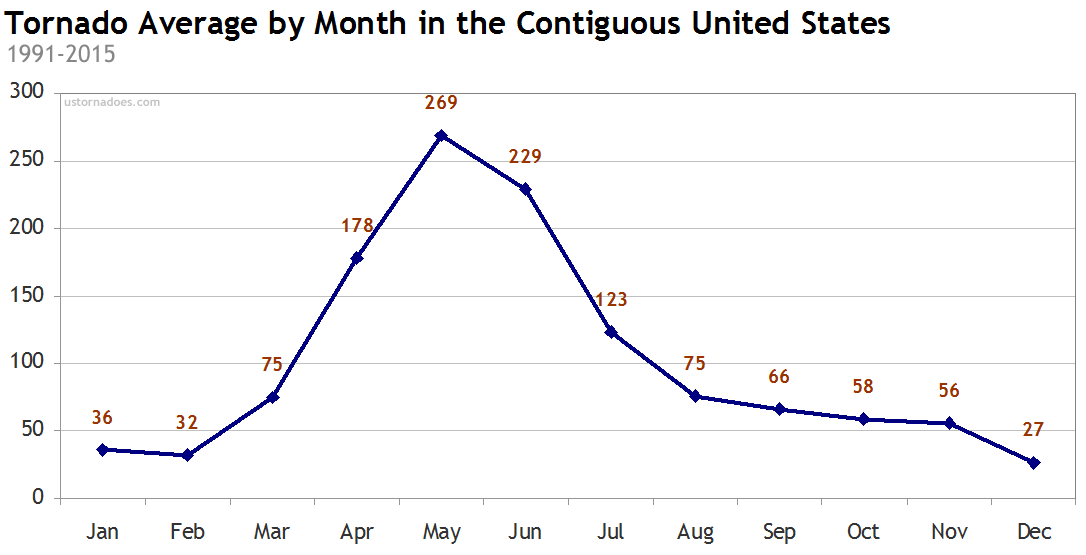
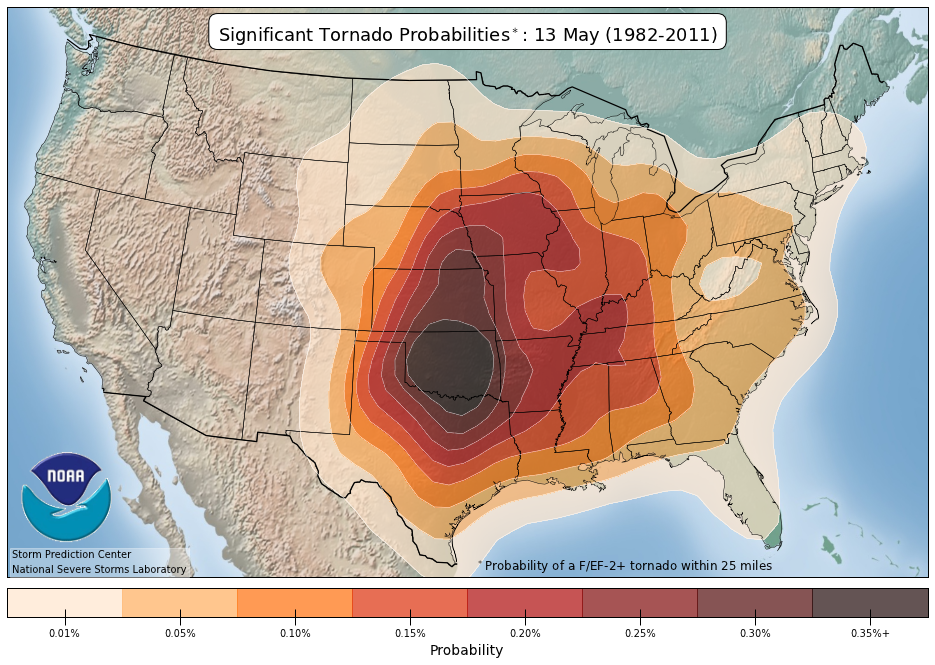
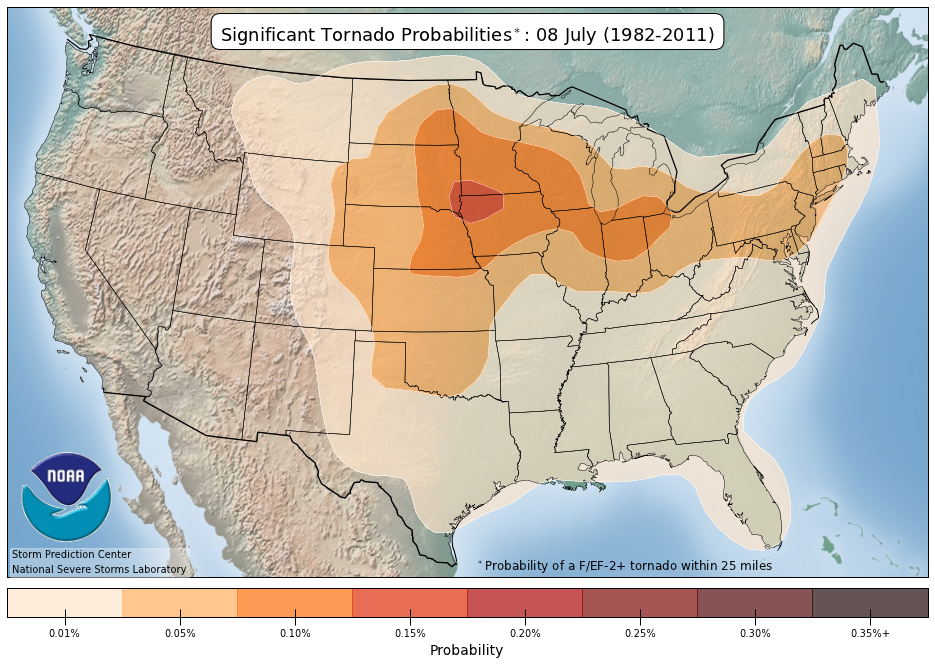
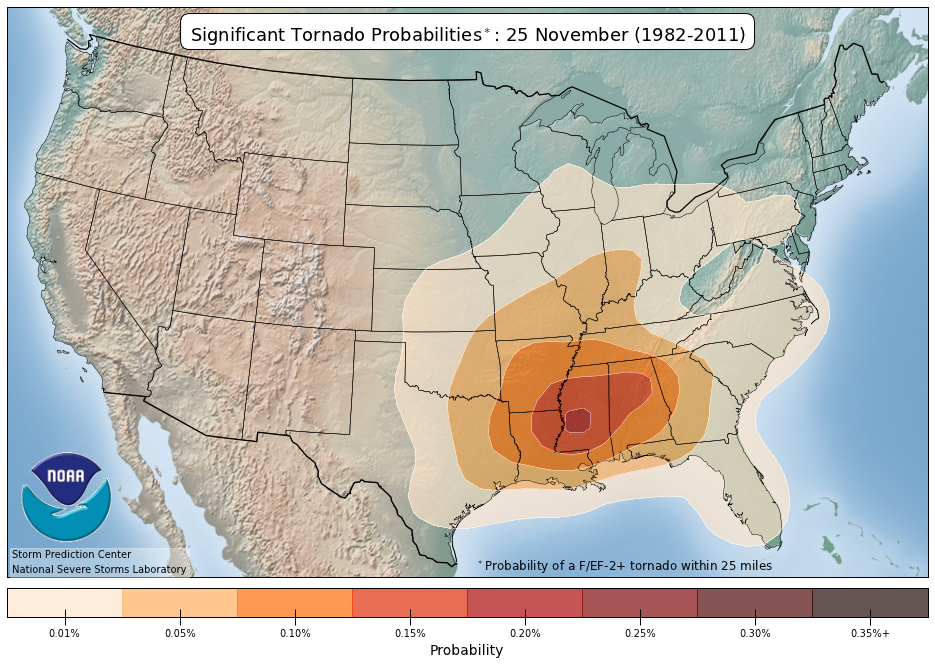
Although tornadoes can and do form anytime of year, there is a distinct seasonality. Link to figure showing average number of US torndoes each month. Most torndoes occur from early April through the middle of July with the peak during the month of May. The late spring and early summer season is time of year when cold air from the north most often clashes with warm and humid air from the south providing favorable conditions for tornado formation. There is also a seasonality with respect to where strong to violent tornadoes are most likely to form. Here is a interesting link from NOAA that allows you to view a movie that shows where significant tornadoes (categories EF2 and higher) are most likely over the United States over the year. Click the start button in the upper left to start the movie. Here are a few highlights.
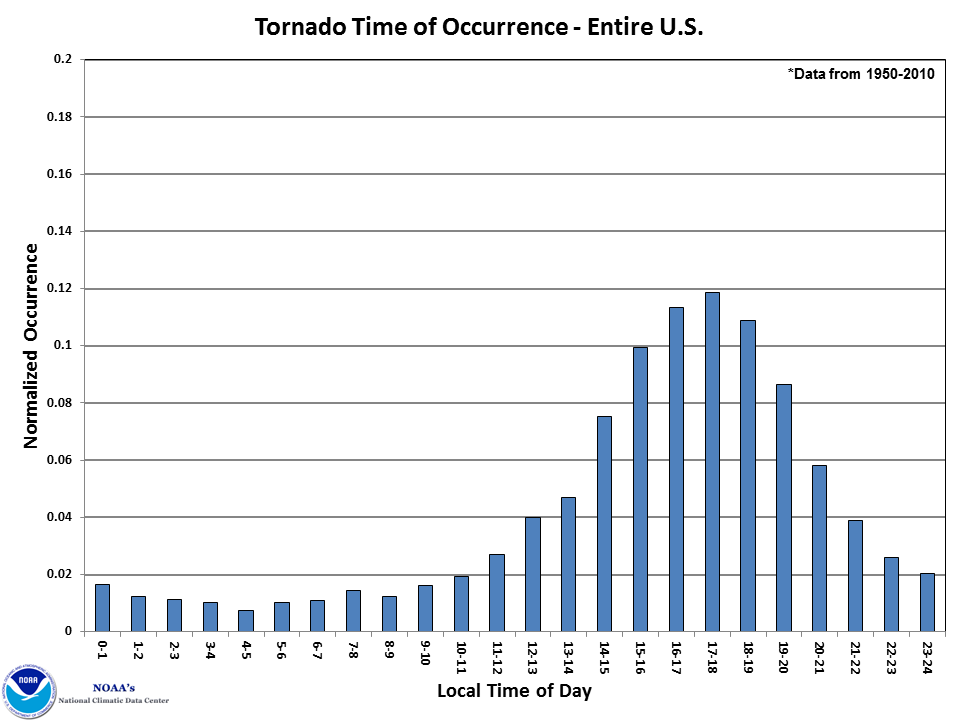
While tornadoes can and have formed all times of the day and night, the peak time for tornado formation is in the late afternoon, see Tornado Time of Occurrence. Late afternoon is typically when the ground surface temperature is warmest and the atmosphere is most unstable. Over one-third of all US tornadoes form between 4 and 7 PM local time.
| Characteristic | Most Common | Extreme / Possible |
|---|---|---|
| Location on Earth | United States | Nearly Anywhere |
| Time of year (USA) | April - July | Any month |
| Time of day | 4 - 7 PM | Any time |
| Size (diameter) | 50 yards | > 1 mile |
| Movement-speed | 30 mph | 0 - 70 mph |
| Movement-direction (USA) | Toward Northeast | Any Direction |
| Length of Ground Path | < 2 miles | > 300 miles |
| Time on Ground | < 5 minutes | > 6 hours |
| Wind Speed | < 100 mph (EF0,EF1) | > 200 mph (EF5) |
Most tornado-related deaths and injuries are caused by flying debris, so the most important consideration is to shelter yourself from flying debris. If possible go to a sturdy structure. Your best bet is to move into a basement or underground storm shelter. If these are not available go to an interior closet away from windows. Cars and mobile homes are not sturdy structures and are dangerous locations to wait out a tornado. If you are caught outside, you want to get as low to the ground as possible. Your best bet is to lie flat in a ditch or depression in the ground.
You Tube video of cars tossed around by a tornado in Alabama
Ingredients necessary for tornado formation:
1. An unstable atmosphere that is capable of producing strong thunderstorm updrafts and downdrafts.
2. A lifting force. The most common lifting forces are heating of air near the surface and weather fronts.
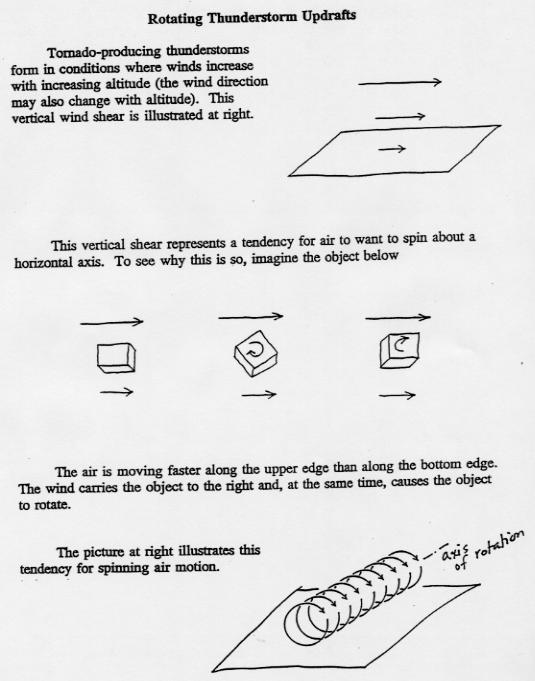
3. Vertical wind shear to provide rotation.
The exact sequence of events that lead to tornadoes are not fully understood. Although meteorologists can locate regions where the conditions are more favorable for tornado development (based on the ingredients above), the exact location and time cannot be predicted accurately. When favorable conditions are present over a particular region, a tornado watch may be issued.
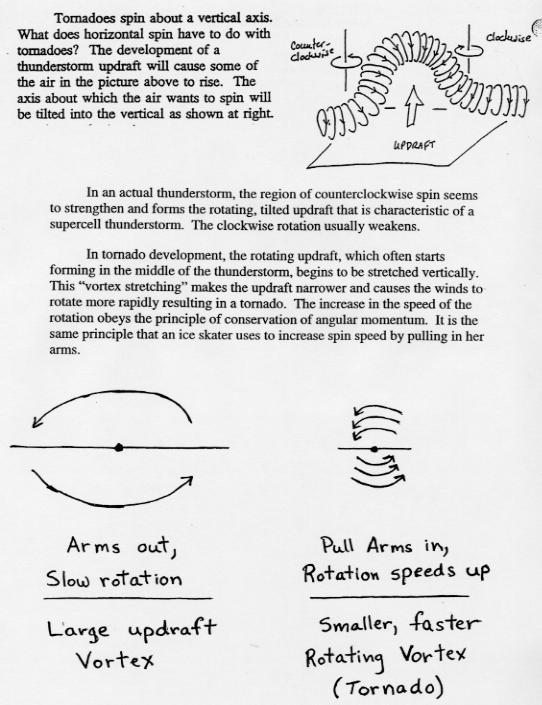
There seem to be several mechanisms that can lead to tornado formation, none of which are fully understood. One proposed mechanism of tornado formation involves rotating thunderstorm updrafts. A simple description is provied in the following two linked pages: ( formation page 1, formation page 2). The mechanism described on the pages above is probably not the mechanism typically responsible for tornado formation in supercell thunderstorms, though. The proposed explanations for tornado formation in supercells is too complex to cover in this class.
ATMO 336 Students: There will not be any homework or exam questions about the tornado formation mechanism described above. You should be familiar with the necessary ingredients listed at the beginning of this section.
Tornadoes come and go so quickly and are so small that predicting where and when one will hit more than 15 to 30 minutes ahead of time is not possible. The average warning time for a tornado with winds of 158 miles an hour or faster - the type that accounts for most deaths - is 18 minutes. Of course if the tornado forms right on top of you, then in some cases no warning can be given. Tornadoes can be detected with Doppler Radar and when they are, tornado warnings are issued. All weather radars work by measuring the reflected (or more correctly backscattered) radiation coming from large particles such as raindrops and hail. Doppler radars can also detect whether the reflecting particles are moving toward or away from the radar site. Thus, the rotating winds around a tornado can show up very well on Doppler Radars. Sometimes the rotation can be observed at cloud level,and a tornado warning issued, before the tornado circulation touches down on the ground.
Why is the favored region for strong tornado formation in the central plains states (often referred to as TORNADO ALLELY)? Severe tornadoes often form when three very different types of air come together in a particular way. Near the ground surface southerly or southeasterly transport warm, humid air from the Gulf of Mexico into the Plains.
![[capmap]](capmap2.jpg) |
The existence of the mid-level convective cap, which will also be referred to as an inversion layer, can be another key ingredient in the formation of strong supercell thunderstorms. An inversion layer is a layer in the atmosphere where the air temperature increases with increasing height. Remember that most of the time, the air temperature is warmest near the ground and decreases (gets colder) with increasing height above the ground. An inversion layer is a thin layer in which the temperature change is the opposite ... the air temperature is increasing (getting warmer) with increasing height above the ground. An inversion layer is extremely stable for rising motion. Why? Rising parcels expand and cool as they rise upward. For a rising parcel to become unstable it must become warmer than the environmental air surrounding the parcel. In a temperature inversion, the environmental air is getting warmer as you move upward, while the rising air parcel is cooling. Therefore, rising parcels will remain colder than the surrounding air when rising through a temperature inversion and will not become unstable, which is required for thunderstorm formation. When an inversion layer forms in the middle of the atmosphere, it can act to stop (or put a "cap" on) rising parcels of air. Parcels cannot rise through the "cap" and thus thunderstorms are prevented from forming, even if the atmosphere above the cap is unstable.
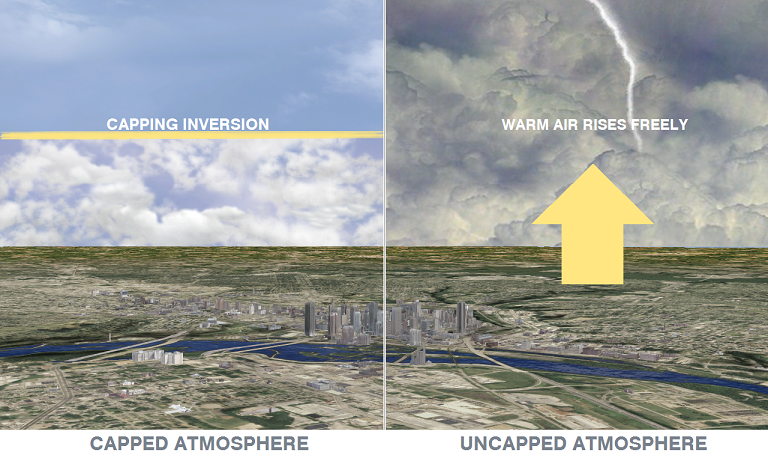
Look at the images below. The image on the left depicts a temperature inversion layer in yellow, which is labeled as a "capping inversion." The capping inversion layer prevents the formation of thunderstorms. The image in the center shows that without the capping inversion layer, tall cumulonimbus clouds, i.e., thunderstorms would have formed. The image on the right shows that unstable air rising into the inversion layer (or capping layer) hits a virtual ceiling as it becomes colder than the surrounding air and sinks back down. Some of the condensed cloud material evaporates as it mixes with this warmer, dry air, which further cools the cloudy air helping to push it back down. The cap stops air parcels from moving upward, which prevents thunderstorms from forming. On many days, the cap holds all day and thunderstorms do not form. However, on other days the cap weakens during the day, only delaying thunderstorm formation, until rising parcels are able to violently break through the cap resulting in the formation of supercell thunderstorms.
 |
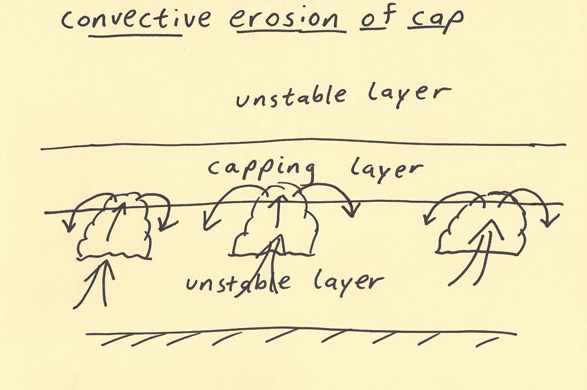 |
| Left and center images taken from Putting a "cap" on severe weather. Right image taken from HABYTIME MINI-LECTURE 79: CONVECTIVE EROSION OF CAP. | |
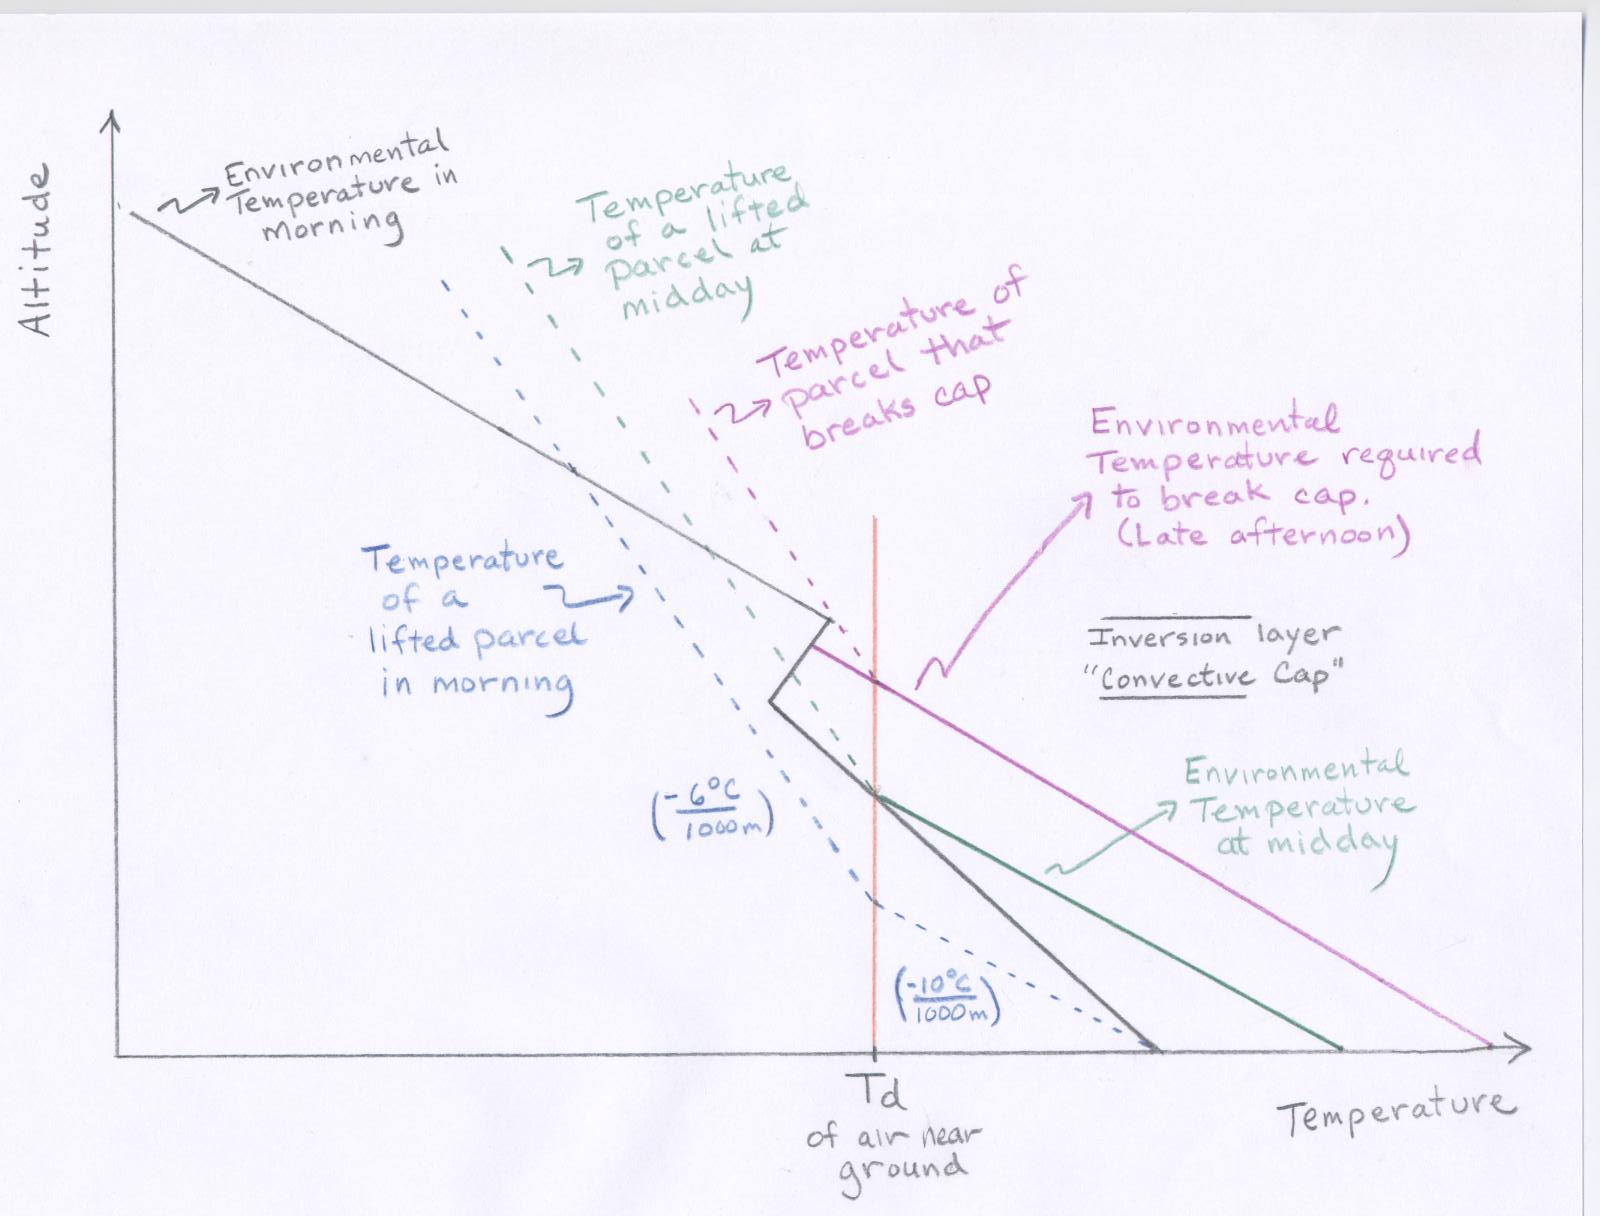
At first an inversion layer will inhibit thunderstorm formation because rising parcels from the surface will not be able to penetrate through this layer. However, as the day progresses and the atmosphere gradually warms from below the inversion layer erodes away, and surface parcels become warm enough to "break through" the old inversion layer and reach the unstable atmosphere above. All day the sun's energy was used to heat the lower atmosphere and increase the water vapor content by evaporation essentially adding more energy to the lower atmosphere. When parcels are finally able to "break through", it is like blowing the lid off of a pressure cooker. A schematic of how the environmental air temperature changes during the day is shown in following diagram: Click here to view the diagram. Without an inversion layer or cap, it is more likely than many small thunderstorms form, which slowly releases the potential energy available from the unstable atmosphere as it develops throughout the day. The cap holds back the release of this energy, causing it to build during the day. In late afternoon after there has been enough solar heating (and additional evaporation) to break the cap, it is so unstable (there is so much potential energy) that the air violently pushes through opening in the cap forming one large thunderstorm (the supercell) and releasing a lot of energy at once, rather than releasing the energy slowly with many weaker thunderstorms as happens without a convective cap.
A comprehensive web page covering the formation and occurence of tornadoes is given in the NOAA web page: Tornado Basics
Another informative guide (updated in Jan 2015), which includes answers to freuqently asked questions about tornadoes and includes links to historical tornadoes, is hosted by the US STORM PREDICTION CENTER is available fom The Online Tornado FAQ.
![]()
![]()
![]()
![]()