![]()
![]()
![]()
![]()
There is quite a bit of variation in the number of Atlantic Ocean hurricanes from year to year. This is indicated in figure 9 below, which shows the numbers of major and non-major hurricanes in the north Atlantic Ocean each year from 1851 to 2022. An interesting question is whether or not there are temporal patterns in the occurrence of Atlantic Hurricanes (pattern of changes in time) and, if so, what might be the cause.
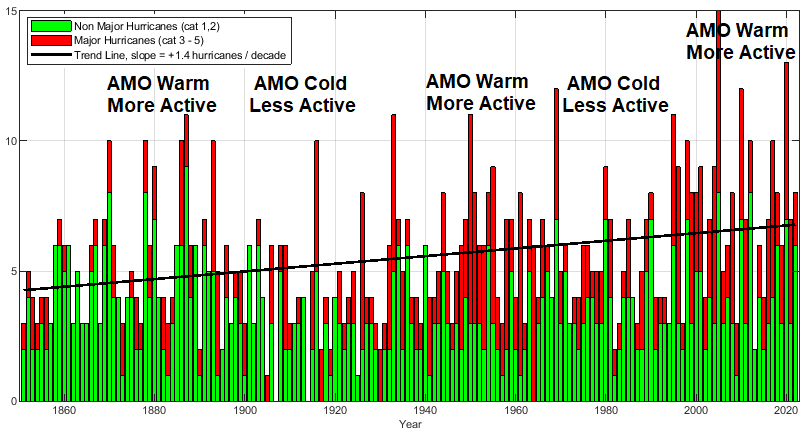 |
| Figure 9: The number of hurricanes in the Atlantic basin each year from 1851 to 2022. Green bars indicate the number of non major hurricanes (categoies 1 and 2) each year, and red bars indicate the number of major hurricanes (category 3 and higher)each year. These are added together to get the total number of hurricanes each year. The black line shows the linear trend in the total number of Atlantic hurricanes from 1851 to 2022. |
There is a well known climate cycle in Atlantic Ocean sea surface temperature pattern known as the Atlantic Multidecadal Oscillation (AMO). Without getting into details, the AMO is a naturally occurring cycle with a full period of about 60 - 80 years. It is most often identified by monitoring changes in the north Atlantic sea surface temperature. Within each cycle, there is a warm phase and a cold phase. One representation of the AMO is shown below. We only have measured evidence for the AMO over the last 150 years, however, paleoclimate proxies, such as tree rings and sediment cores, have indicated that these oscillations have been occurring for at least the last 1000 years.
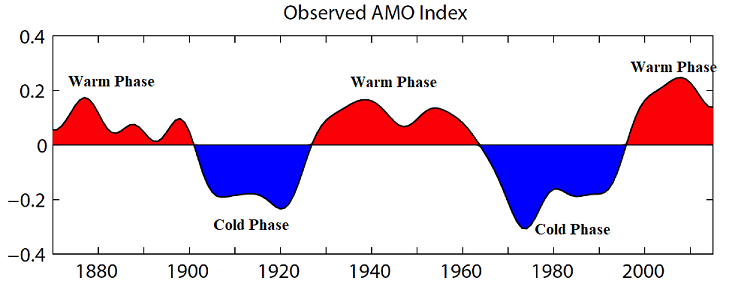 |
| Observed AMO index, defined as detrended 10-year low-pass filtered annual mean area-averaged SST anomalies over the North Atlantic basin (0N-65N, 80W-0E), using HadISST dataset (Rayner et al. 2003) for the period 1870-2015. (Source. Trenberth, Kevin, Zhang, Rong & National Center for Atmospheric Research Staff (Eds). Last modified 03 Mar 2017. "The Climate Data Guide: Atlantic Multi-decadal Oscillation (AMO)." Retrieved from https://climatedataguide.ucar.edu/climate-data/atlantic-multi-decadal-oscillation-amo. |
Although it may be difficult to notice from a quick glance at figure 9, many researchers have found evidence for and concluded that there is a multi-decadal cycle of hurricane activity in the north Atlantic Ocean, consisting of 20 - 40 year periods of increased hurricane activity followed by 20 - 40 year periods of decreased hurricane activity, which is correlated with the AMO. During the warm phase of the AMO, there is increased hurricane activity, with generally more storms and more intense storms (major hurricanes). During the cool phase of the AMO, there is decreased hurricane activity, with generally fewer storms and fewer major hurricanes. The warm and cool phase periods since 1850 are indictated in figure 9. If you closely examine the figure, you can see that there is a tendency for there to be more hurricanes, especially major hurricanes, during warm periods. One reason that it may be difficult to visualize the relationship is that there is still a lot of year to year variability on top of the multidecadal cycle. Thus, during warm periods, there is a tendency to have some very active hurricane years, but there are also some years with rather low activity. During cold periods, there is a tendenacy to have less active hurricane years, but ther are also some years with high activity within the cold period. This simply indicates that there are also other factors, beside the AMO, which modulate hurricane activity from year to year. These other factors make it difficult to accurately forecast the number of hurricanes that will form each year.
We are currently in the warm phase of the AMO, which began around 1995. Previous to the current warm phase, there was a cool that lasted from about 1970 to 1995. It is fairly obvious in figure 9 that there has been a tendency for more major hurricanes during the recent warm phase compared with the previous cool phase. Again you can see that there remains a great deal of variability from year to year even within this more active period. The 2005 hurricane season had a record breaking 28 named storms, with 15 reaching hurricane strength and 7 reaching major hurricane strength happened during this current period of high activity. But so did the 2013 hurricane season, which had only 2 hurricanes and had no major hurricanes. In fact 2013 - 2015 were all relatively down years for Atlantic hurricanes. 2017 was an active year with 6 major hurricanes in the Atlantic. The year 2020 broke the record for the number of named storms in a single season with 30. Of these 30 named storms, 13 reached hurricane strength and 6 reached major hurricane strength. The 2021 Atlantic hurricane season was also active in terms of named storms with 21. However, the number of named 2021 storms that reached hurricane strength (7) and major hurricane strength (4) were only moderately above average numbers and much lower than the 2020 season. The 2022 Atlantic hurricane season ended with 14 named storms, 8 hurricanes, and only 2 major hurricanes, all of which are near average for the North Atlantic.
Another piece of evidence for the existence of a multi-decadal cycle in Atlantic Hurricanes is shown in figure 10 below. The figure presents a metric called Accumulated Cyclone Energy (ACE). ACE measures the total wind energy realized over the entire life cycle of all storms in a tropical season. ACE factors in storm intensity, frequency, and duration. Put simply, a long-lived very powerful Category 3 hurricane may have more than 100 times the ACE of a weaker tropical storm that lasts for less than a day. The ACE index for each year is determined by adding the ACE values for all storms that formed over that year. ACE indicates that the total wind energy generated by all Atlantic tropical cyclones each year and is thus a better measure of hurricane activity than just counting numbers of hurricanes. ACE values are available back to 1950. We see generally high annual ACE values during the active period from 1950 to 1969, followed by generally low annual ACE values from 1970 to 1994, then generally high after 1995. The black line on the graph indicates the average annual ACE over the entire period from 1950 to 2022. Based on this information, it is believed that the north Atlantic basin is still in a more active hurricane period that began in 1995 and we can expect that there will be a tendency for very active years in the near future. While 2020 was a well above average year for ACE, the 2020 ACE ranks far below the total ACE for the 1995, 2004, 2005, and 2017 Atlantic hurricane seasons. The 2021 season was the sixth consecutive year with above average ACE relative to the 1950 to 2021 average. However, the 2022 Atlantic Hurricane season ended with slightly below average ACE ending the streak of years with above average ACE. Note that it has been over 25 years since the last shift to the warm phase of the AMO. Based on historical patterns, the next cool phase may be near. Unfortunately, we are not yet capable of predicting exactly when the AMO will switch. We probably will not know for sure until we are several years into the next cold phase. One thing we can say with certainty (based on historical evidence) is that the AMO will shift back to the cool phase at some point with a corresponding decrease in hurricane activity in the north Atlantic.
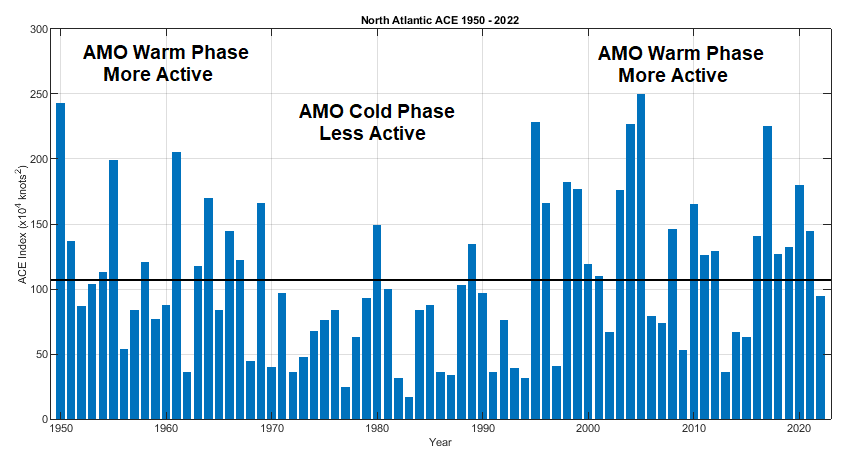 |
| Figure 10: Seasonal Accumulated Cyclone Energy (ACE) index for the North Atlantic Ocean basin from 1950 - 2022. The black line indicates the average ACE over this period (source NOAA http://www.ncdc.noaa.gov/sotc/tropical-cyclones/). |
What about the trend line in figure 9 above, which indicates that the number of reported Atlantic hurricanes has been increasing at a rate of 1.4 hurricanes per decade? Some have used figures like this to conclude that climate change has caused increasing numbers of Atlantic hurricanes. In reality, the trend can be largely explained by changes in the way we observe hurricanes, rather than a real trend of increasing hurricanes since the 1800s. Long ago, when populations were smaller and there were fewer people making observations, there were undoubtedly storms that were simply missed and not counted. In recent decades, no storm will be missed. Thus, scientists and statisticians need to make adjustments for storms that were completely missed. Another factor is that there has been a large increase in the number of short duration storms in recent decades, where a short duration storm is one that lasts two days or less. Since the beginning of the satellite era, we have significantly improved our observations of hurricanes from space. Short duration storms that went undetected (and uncounted) in the past are more easily detected and counted today. The figure below indicates the increase in short duration Atlantic storms, which is responsible for much of the trend shown in figure 9. The figure below also shows that there has been no significant change in moderate duration storms from 1880 to 2010 after accounting for the long ago missed storms. These results show that the increase in Atlantic storms in figure 9 is an artifact of the way we have observed storms, rather than a real climate change toward more Atlantic hurricanes.
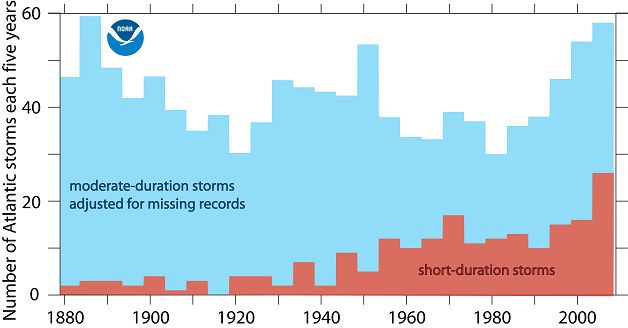 |
| Total number of short duration Atlantic storms (red) and moderate duration storms (blue) for each 5 year period from 1880 to 2010. Short duration storms are those that last two days or less. The moderate duration storms have been adjusted to account for missed storms in the past. (source NOAA GFDL https://www.gfdl.noaa.gov/historical-atlantic-hurricane-and-tropical-storm-records/). |
While variations in the total number of hurricanes in the Atlantic Ocean is interesting, keep in mind that most people only remember the ones that cause death and destruction on the coast. Many Atlantic hurricanes stay out at sea or are relatively weak when they make landfall. Only a small percentage of all North Atlantic hurricanes will make landfall as major hurricanes, categories 3, 4, and 5. From 1900 to 2021 there have been about 80 total major hurricane landfalls on the continental US. Keep in mind that we are talking about the numbers of hurricanes that strike the US coastline as category 3, 4, 5 storms (major hurricanes) and not counting major hurricanes that remain offshore or weaken below category 3 strength before striking a coastline. The table below on the left shows the number of major hurricanes to strike the US coastline each decade. Interestingly, you can see evidence of the multi-decadal cycle in landfalling major hurricanes. Note the relatively high numbers in the 1930s, 1940s, and 1950s (8, 10, and 8 respectively), which corresponds with a high point in the cycle, compared to the relatively low numbers in the 1970s, 1980s, and 1990s (4, 4, and 4 respectively), which corresponds with a low point in the cycle. The fact that major hurricanes hit the mainland U.S. so infrequently from 1970 to 1995 caused people living during that time to become desensitized to the potential devastion of hurricanes and developed a false sense of security. This desensitization may have played a role in the large number of deaths attributed to hurricane Katrina in 2005 as many coastal residents ignored evacuation orders. There were 7 major landfalling hurricanes in the first decade of the 2000s, which corresponds with another high point in the cycle. While the decade of the 2010s was within the active cycle, there has been only 4 major landfalling hurricanes that struck the US coastline, which is probably less than expected based on the historical data. The relative lack of major US landfalling hurricanes after 2005 is discussed below.
                 Number of major landfalling hurricanes
Time Period       Cat. 3    Cat. 4    Cat.5     Total

1891 - 1900          5         1                   6
1901 - 1910          5         1                   6
1911 - 1920          3         2                   5
1921 - 1930          3         2                   5
1931 - 1940          6         1         1         8
1941 - 1950          9         1                  10
1951 - 1960          5         3                   8
1961 - 1970          4         1         1         6
1971 - 1980          4         0                   4
1981 - 1990          3         1                   4
1991 - 2000          3         1                   4
2001 - 2010          4         3                   7
2011 - 2020          0         3         1 (2018)  4
2021 - 2022	     0	       2         0	   2
|
|
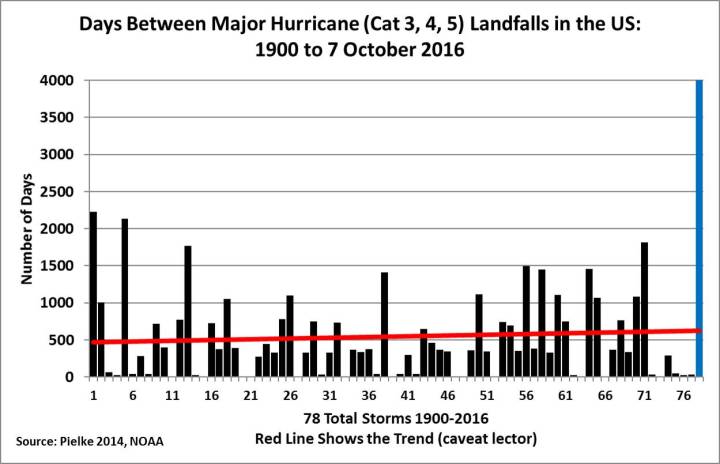
Interestingly, even though the Atlatic Ocean is currently within an active part of the multi-decadal cycle, there was a long stretch from October 2005 to August 2017 without a single major landfalling hurricane in the US. Although Hurricane Sandy was large and destructive, it was classified as a category one hurricane just before it transitioned to a post-tropical cyclone and made landfall in New Jersey. This is by far the longest stretch without a major landfalling hurricane to hit the United States since at least 1900. The figure above on the right, which was produced in October 2016, shows the number of days between each major hurricane landfall on the continental US coastline. It ended up being over 4300 days between the 78th and 79th major landfalling hurricane strikes on US coastlines, when Hurricane Harvey made landfall on August 25 as a catgory 4 storm in Texas. It was just more than two weeks later that Irma, another category 4 storm made landfall in Florida. In October 2018, hurricane Michael made landfall in the Florida panhandle as a category 5 storm with 155 mph winds. There were no major landfalling hurricanes in 2019. In the active 2020 Atlantic season, only hurricane Laura made landfall in the US at major hurricane strength (category 4 in Louisiana). Please ignore the red trend line on the figure as its meaning is unclear. It is difficult to ascribe a reason for this other than chance. It would be incorrect to conclude that climate change was the reason for the record long stretch without a major hurricane, just as it is incorrect to conclude that climate change is the reason for the 6 major (and destructive) landfalling hurricanes from 2017 through 2022. Despite the information just presented, the "news" media commonly invoke global warming (or climate change) as the reason for all recent (and future) major hurricane impacts in spite of the fact that major hurricanes have struck the US coastline throughout recorded history. For historical perspective, here is a figure showing the number of major Atlantic landfalling US hurricanes from 1900 - 2010 by county produced by the National Hurricane.
Public attention for hurricanes is primarily driven by lanfalling hurricanes that result in death and destruction, rather than fluctuations in the number of hurricanes in the Atlantic or around the globe. In 2004, four hurricanes (three major hurricanes) hit the state of Florida, followed in 2005 by Katrina, the most costly natural disaster in United States history, as well as three other major landfalling hurricanes, Dennis, Rita, and Wilma. In fact, the 2005 Atlantic hurricane season was record-breaking. The 28 named tropical storms broke the old record of 21; 15 of those tropical storms became hurricanes, breaking the old record of 12; 4 hurricanes made landfall over the United States at category 3 or higher breaking the old record of 3 set in 2004. A good summary of the record breaking hurricane season of 2005 is given in the article: 2005: A Hurricane season 'On Edge'. The result is that hurricanes were under public scrutiny. And anytime a weather disaster happens, you can be sure that someone will try to link it to global warming. The debate about a possible link between global warming and hurricanes cooled down as the years following 2005 were not destructive hurricane seasons. The debate heated up again in the aftermath of the deadly and damaging storms hurricane Sandy in 2012 and Typhoon Haiyan in 2013. A web search of the terms "hurricane sandy tyhpoon haiyan global warming" will locate many articles that attempt to link these storms to global warming or climate changes resulting from human emissions of greenhouse gases. This debate heated up again during and after the 2017 Atlantic hurricane season as three landfalling major hurricanes, Harvey, Irma, and Maria, made landfall in Texas, Florida, and Puerto Rico in rapid succession. The debated quieted some as the 2018 and 2019 seasons were less active than 2017. The active 2020 Atlantic hurricane season, which had a record 30 named storms, has reintensified the spirited debate about a possible connection between global warming and hurricanes.
A link between global warming and hurricanes is plausible. The basis for a link to global warming is as follows ... As humans add greenhouse gases to the atmosphere, the average surface temperature of the Earth should increase. Exactly how much and how fast it may warm is a matter for debate. One consequence is that global sea surface temperatures will increase. Reconstructions of global average sea surface temperature from 1850 to present do show that the global average sea surface temperature is about 1.0°C warmer than it was around the year 1900 with the recent years being the warmest in the measured record. Therefore, since hurricanes feed off warm ocean water, one could argue that global warming will result in more and stronger hurricanes around the globe. No one is making the argument that hurricanes don't happen without global warming, but many, including several respected scientists, believe that global warming has made recent hurricanes stronger and more destructive.
While the above argument seems plausible, it cannot be scientifically proven at this time based on observations of hurricanes over the time period of the warming. As mentioned above, recent increases in Atlantic hurricanes after 1995 can be better explained as a continuation of the multi-decadal cycle. The 2004, 2005, 2017, and 2020 hurricane seasons are not overly abnormal when viewed in the context of hurricane cycles over the last 100 years and beyond. The multi-decadal cycle itself certainly cannot be attributed to global warming. Furthermore, hurricane development requires more than just warm sea surface temperatures -- how are these other development factors influenced by global warming? While we cannot say with certainty that global warming has had no influence on hurricane development, it cannot be scientifically proven that global warming has had a large impact on the 2004, 2005, 2017, and 2020 North Atlantic hurricane seasons. Instuctor's note. To my knowledge, there have been no studies that have proven a statistically significant increase in either hurricane numbers or intensity related to the increase in sea surface temperature.
Perhaps the most damaging evidence against a direct link between global warming and hurricane intensity is based on examining changes in worldwide (global) ACE values as shown in Figure 11 below. Please note that figure 11 shows global ACE (all tropical storms in all oceans), while the previous figure of ACE (figure 10 above) was only for north Atlantic Ocean tropical storms. Atlantic Ocean ACE has been relatively high since 1995 mainly because we are in the warm phase of the AMO, which increases hurricane activity in the Atlantic. There is no discernible trend in global ACE as shown below, though there is certainly variability. Apparently, there are factors that influence global ACE and hurricane variability that dominate over any possible connection with increasing sea surface temperature. Note especially, the period from 2008 - 2014 was near the lowest over the time of this record in spite of the continuing increase in sea surface temperature. Note also that while North Atlantic ACE has been above average in 2020 and 2021, global ACE has plummeted in 2021. If increasing global sea surface temperature is the reason for the recent increase in Atlantic hurricanes, then why has there lower ACE in other ocean basins, such that the total global ACE dropped significantly in 2021? Below is a quote taken from NOAA Tropical Cyclones Annual 2021 report:
Both the eastern and western North Pacific basins were generally less active than normal. In the East Pacific, the 19 named storms and eight hurricanes were both near normal. However, only two storms became major hurricanes, which is less than half of normal. The ACE was also about 30% below normal. Similarly, the 23 named storms in the West Pacific was near normal, but the ten typhoons and five typhoons were both among the five lowest years since 1981. The ACE was also about 30% below normal in the West Pacific.In spite of the relatively high global average sea surface temperature, global hurricane activity was again low in 2022. Below is a quote taken from NOAA Tropical Cyclones Annual 2022 report:
A total of 88 named storms occurred across the globe in 2022, which was near the 1991-2020 average. Of those, 40 reached tropical cyclone strength (=74 mph), and 17 reached major tropical cyclone strength (=111 mph). Both of these counts were below their 1991-2020 averages. The global accumulated cyclone energy (ACE: an integrated metric of the strength, frequency, and duration of tropical storms) was the lowest since 2010 and the fourth lowest since 1981. No basin was more active than normal in terms of ACE.
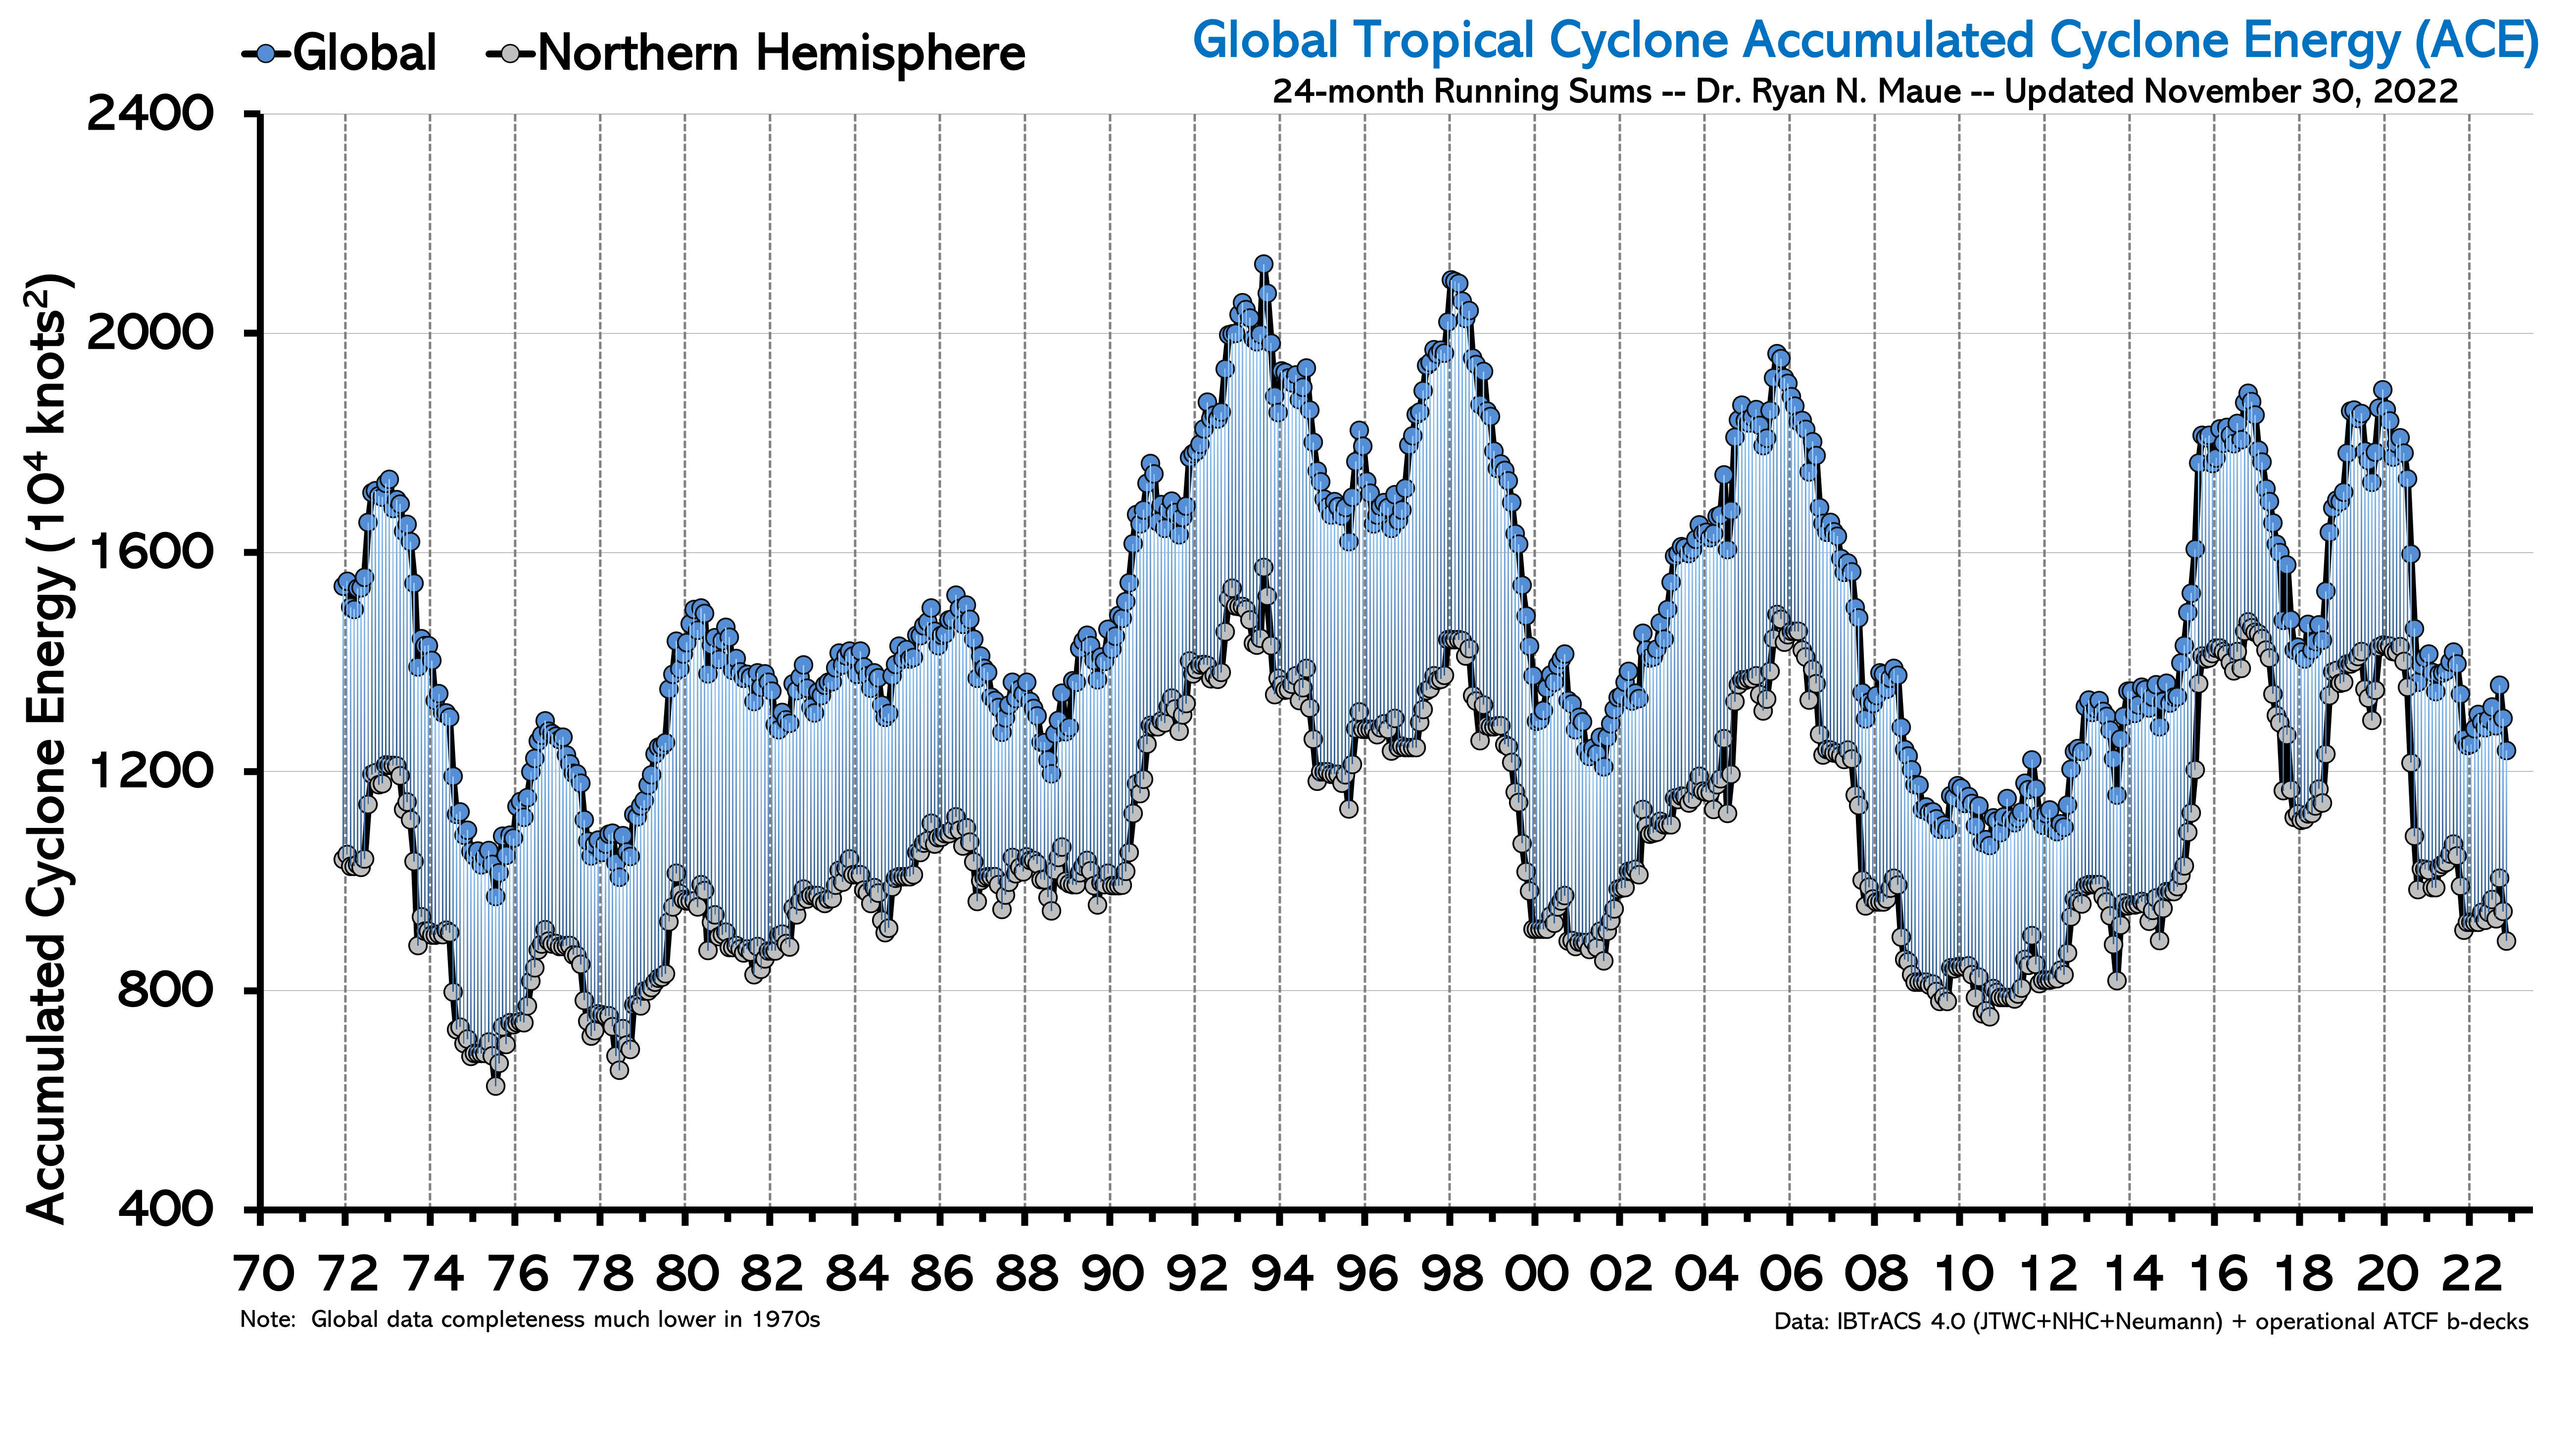 |
| Figure 11: Seasonal global Accumulated Cyclone Energy (ACE) index for all ocean basins combined from 1972 - 2022. The black dots are for the Northern Hemisphere only, which accounts for the majority of hurricanes. Each dot represents a 24 month running sum ( Source Ryan Maue). |
While this evidence does not rule out a link between higher sea surface temperatures and hurricane intensity, it does appear that the link is currently weak at best. Through the period of this record, natural variations (or trends) in global ACE are larger than possible variations (or trends) related to increases in sea surface temperature. If global hurricane activity were largely controled by changes in sea surface temperature, then we would expect the varitions in global ACE to match with variations in sea surface temperature, but this is not the case. Global sea surface temperaure has increased significantly since 1980, while during that same period global ACE has fluctuated up and down. Obviously, the early predictions based on the perceived connection between higher sea surface temperature and hurricane formation and strength, which predicted stronger and more frequent hurricanes following the devastating Atlantic storms of 2004 and 2005, have not happened. We can probably make a statement like this: The impact of global warming on hurricane activity (if there is an impact) in today's climate is probably small compared to the variations of hurricane strength by natural climate factors, i.e., since 1970 the natural variations are much larger than any long-term trend that may be due to global warming. Consider the two figures below. Figure 13 shows the total number of hurricanes and major hurricanes each year from 1980 through 2022. This figure does not indicate a clear connection between the increase in sea surface temperature and hurricane frequency. In fact, at the end of 2022, both total hurricane and major hurricane frequencies are relatively low considering the last 40 years of data. Figure 14 shows the number of global hurricane landfalls each year from 1970 to 2021. (I was not able to locate an updated figure). There is certainly no obvious indication of a recent trend toward more landfalling global hurricanes through the period of this record (1970 - 2021).
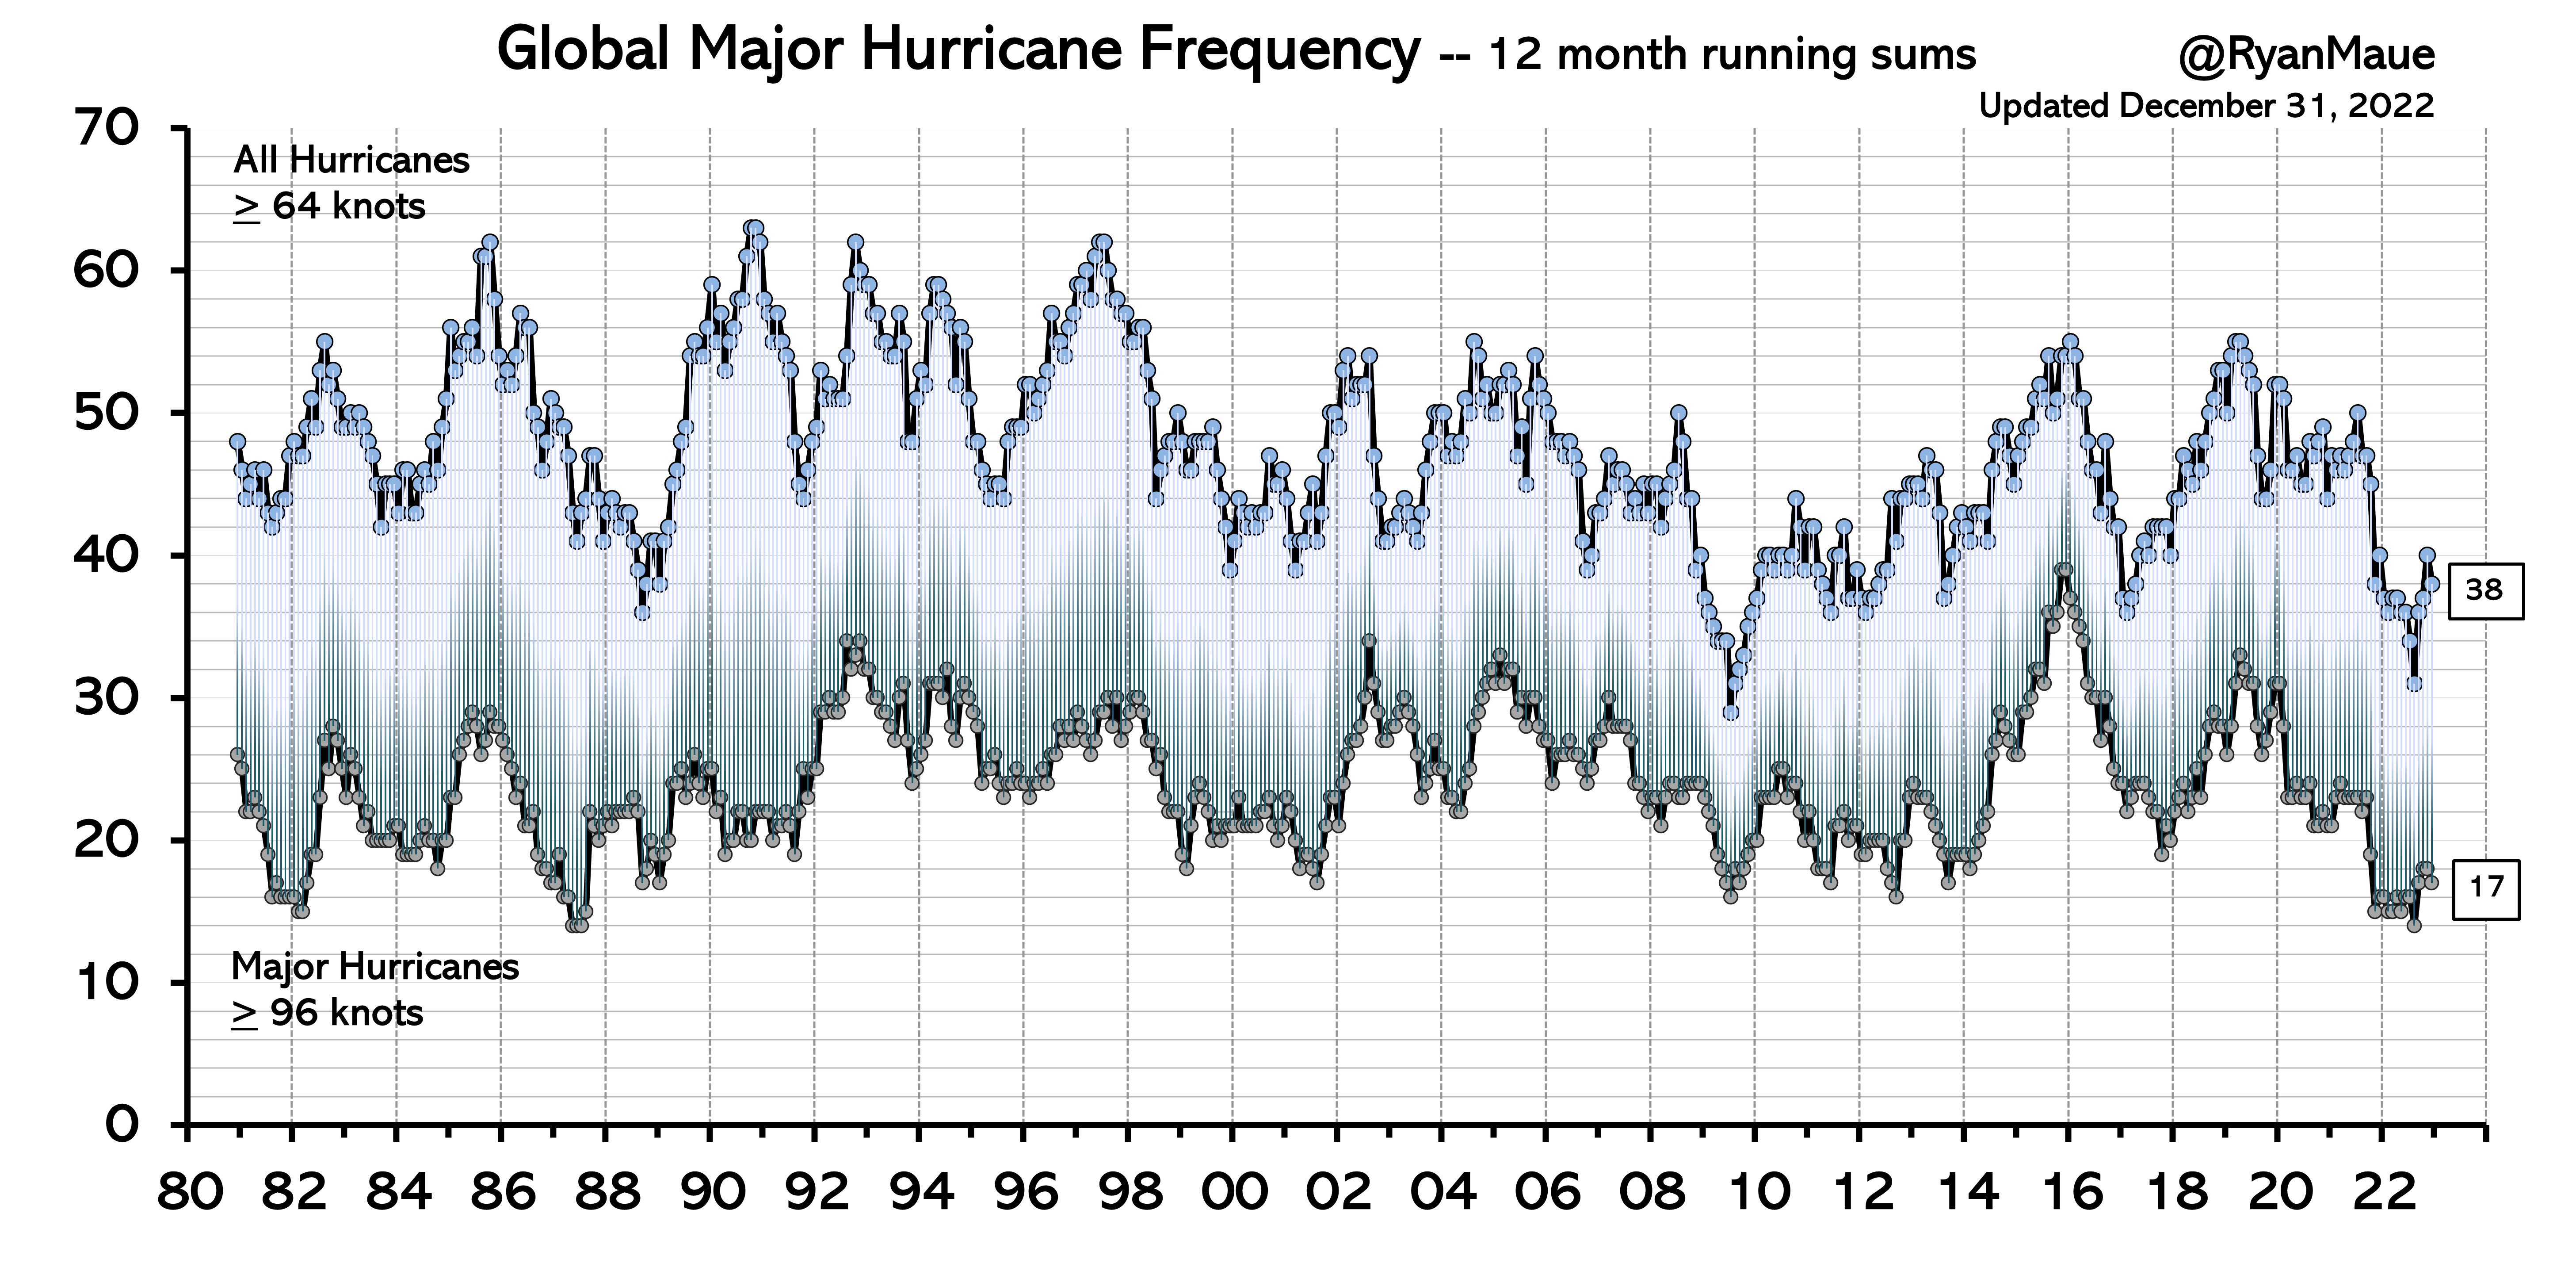 |
| Figure 13: Total number of hurricanes and major hurricanes observed over the Earth each year from 1980 through 2022. ( Source Ryan Maue). |
 |
| Figure 14: Total number of landfalling hurricanes observed over the Earth each year from 1970 through 2021 (Link to Original Reference and Update.) |
The evidence presented above does not mean that a connection between global warming and hurricane intensity is just wild speculation. There are respected research scientists who are convinced of a strong connection. There have been recent modeling studies that indicate hurricanes will become stronger if sea surface temperatures continue to increase, however, the models are not reality and cannot be used as scientific proof. There are other modeling studies that do not show a strong connection between global warming and hurricanes. There is no doubt that higher sea levels, associated with warming temperatures, will make coastlines more vulnerable to hurricane damage, regardless if the warming is actually caused by human activity or just part of a natural cycle in the Earth's climate system, but this does not address the debate about whether or not hurricanes have become or will become stronger. Some recent studies have indicated that recent powerful storms like Katrina, Sandy, Harvey, Irma, and Maria would not have been as strong had they formed in past decades when the sea surface temperature was lower, but as discussed above there has been no systematic increase in hurricane ACE in response to the measured increase in global aveage sea surface temperature. There are also many respected scientists who do not believe there is a strong connection between global warming and hurricanes, so this issue is far from being settled. However, it does seem that the news media is much more likely to report on a possible negative impact of global warming, such as a possible increase in destructive hurricanes, rather than presenting an honest evaluation of all current scientific evidence and uncertainty. In fact, there have been a glut of "news" stories recently, which make claims, often unsupported, that global warming has caused recent storms to be stronger than they otherwise would have been. A simple search will reveal many of articles. Instructor's note. I found a couple of Blogs written by Professor Cliff Mass provide well-reasoned responses to some of the unfounded claims: This post after Hurricane Harvey in 2017 and This post after Hurricane Ida in 2021.
In spite of the lack of scientific proof, many in the media flock to those who make assertations about influence of global warming on United States hurricanes, for example, See Germany's Environment Minister, Juergen Trittin, cites greenhouse gas emissions as cause for Katrina. In my opinion, the German minister (among others) used the Katrina weather disaster to further his agenda to reduce emissions of greenhouse gases for fear of global climate change. While this may be a noble agenda, he should base his arguments on sound scientific evidence, not scare tactics. Furthermore, one of the reasons often given as to why we must act immediately to prevent the devastating consequences of continued human-caused global warming is that hurricanes will become more powerful and perhaps more common. This is often reported as if it were a fact, not a theory, with no mention of the uncertainty. You should realize that recent observations do not clearly support this theory.
This debate has been going on for many years. Arguments for and against a link between global warming and increased hurricane intensity are summarized in this short video segment produced during the 2005 hurricane season by PBS: Is global warming making hurricanes more intense? The points made on both sides are still relevant and discussed today.
Much of the material presented in this section is taken from
Normalized Hurricane Damage in the United States: 1900-2005
authored by Pielke, Jr. et al., published in Natural Hazards Review, Vol. 9, No. 1, February 1, 2008.
A summary of their work, taken from the paper's abstract is provided below:
After more than two decades of relatively little Atlantic hurricane activity, the past decade saw
heightened hurricane activity
and more than $150 billion in damage in 2004 and 2005.
This paper normalizes mainland U.S. hurricane damage from 1900-2005 to 2005 values ...
A normalization provides an estimate of the damage that would occur if storms from the past made
landfall under another year's societal conditions. Our methods use changes in inflation
and wealth at the national level and changes in
population and housing units at the coastal county level. Across both normalization methods,
there is no remaining trend of increasing
absolute damage in the data set, which follows the lack of trends in landfall frequency or
intensity observed over the twentieth century.
The 1970s and 1980s were notable because of the extremely low amounts of damage compared to other
decades. Instructor's note: This is an important point. If we only compare post 1995 Atlantic
hurricanes with the period from 1970-1995, essentially ignoring historical hurricane seasons prior
to 1970, then how can we be certain that activity since 1995 has been abnormally high ... perhaps
the 1970 through 1995 period had abnormally low activity.
The decade 1996 to 2005
has the second most damage among the past 11 decades, with only the decade 1926 to 1935 surpassing its costs.
The most
damaging single storm is the 1926 Great Miami storm, with $140-157 billion of normalized damage:
the most damaging years are 1926
and 2005. Of the total damage, about 85% is accounted for by the intense hurricanes
Saffir-Simpson Categories 3, 4, and 5 , yet these
have comprised only 24% of the U.S. landfalling tropical cyclones.
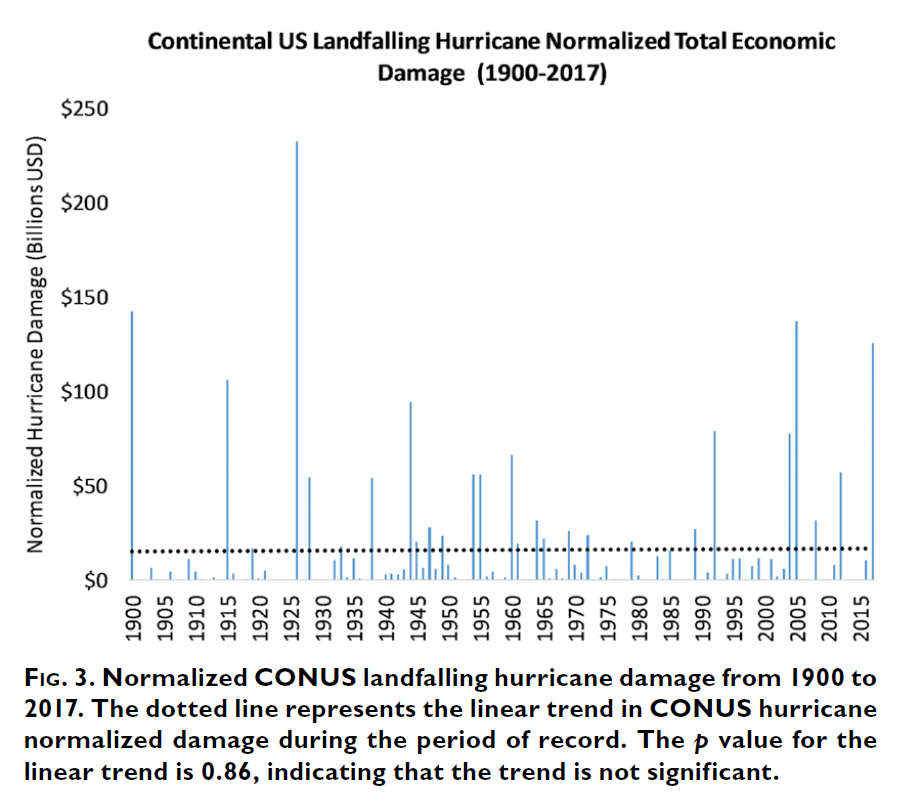
The study normalizes property damages over the years by making three major adjustments: one to account for inflation, one for growth in wealth (to account for fact that people generally have more "stuff" today as compared to the past and the real value of all this "stuff" has increased), and one to account for overall population growth along affected coastlines. It is very important to consider all three adjustments. Several past works have only considered the inflation adjustment and end up with a plot like figure 3 (from Pielke 2008), which shows that even after adjusting for inflation, total property loses in the US from tropical cyclones continues to follow an upward trend through 2005. However, this is very misleading, since much of the increased costs can be attributed to increases in wealth and population density. Some have even used a plot like figure 3 as evidence that global warming is resulting in stronger hurricanes in the US.
The US coastal populations are certainly more vulnerable to property damage today compared to
past times due to the rapid population increases, especially along the "warm weather coasts"
(see figure 2, Pielke 2008), as well as the tendency for building more lavish structures on the
coasts. After considering these factors, Pielke finds no trend with time in the absolute damage
caused by US landfalling hurricanes. The following summary and warning for the future is taken
from the conclusion:
it
should be clear from the normalized estimates that while 2004
and 2005 were exceptional from the standpoint of the number of
very damaging storms, there is no long-term trend of increasing
damage over the time period covered by this analysis. Even Hurricane
Katrina is not outside the range of normalized estimates for
past storms. The analysis here should provide a cautionary warning
for hurricane policy makers. Potential damage from storms is
growing at a rate that may place severe burdens on society. Avoiding
huge losses will require either a change in the rate of
population growth in coastal areas, major improvements in
construction standards, or other mitigation actions. Unless such
action is taken to address the growing concentration of people and
properties in coastal areas where hurricanes strike, damage will
increase, and by a great deal, as more and wealthier people
increasingly inhabit these coastal locations.
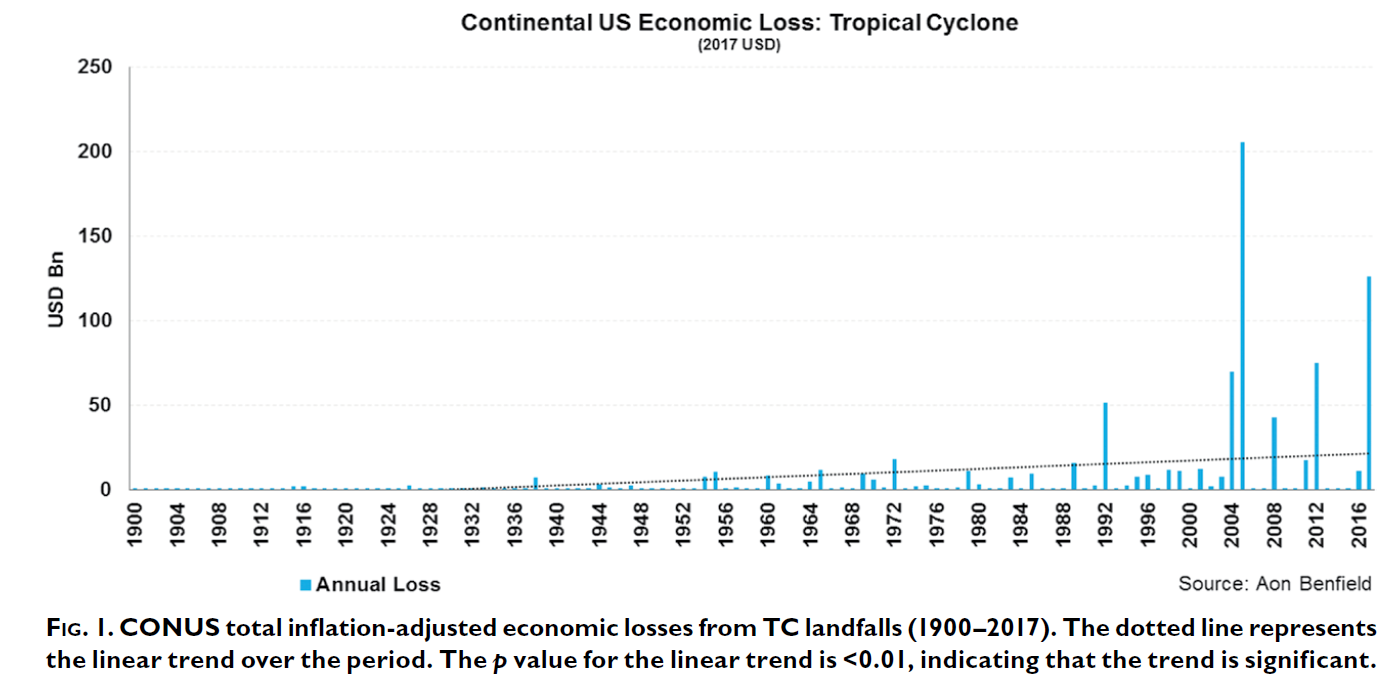
While the study referenced above ends with the 2005 Atlantic hurricanes, the points made are just as valid today. In fact newer studies using similiar normalization methods are available. One is a paper published in July 2018 in the The Bulletin of the American Meteorological Society (BAMS) titled, CONTINENTAL U.S. HURRICANE LANDFALL FREQUENCY AND ASSOCIATED DAMAGE. Below are a couple of figures from the paper. This study comes to the same conclusions as in the earlier paper referenced above. Figure 1 from the paper shows the inflation-adjusted US economic damage from hurricanes in 2017 dollars. When only inflation is considered there is an increasing trend of hurricane damage. However, that is misleading because it does not consider the other two normalizing factors, which are the increases in overall wealth and population along US coastlines. When all three normalization factors are considered, as in figure 3 from the paper, there is no significant trend in economic damage from hurricanes. The point is ... While 2005 and 2017 had powerful and costly hurricanes for the US, there would be more damage and costs if there were repeats of the 1900 or 1926 hurricane seasons on today's coastline. According to these studies, it is incorrect to conclude that hurricane damages and costs in the US have been trending upward in recent years due to a systematic increase in hurricane activity or intensity. This is in contrast to the often stated claim that hurricane activity is becoming more common and severe due to recent climate change.
 |
 |
| Figure taken from CONTINENTAL U.S. HURRICANE LANDFALL FREQUENCY AND ASSOCIATED DAMAGE | Figure taken from CONTINENTAL U.S. HURRICANE LANDFALL FREQUENCY AND ASSOCIATED DAMAGE |
Jessica Weinkle is the lead author of another updated study published in December 2018 in the journal Nature Sustainability, Normalized hurricane damage in the continental United States 1900 - 2017 that comes to the same conclusions. Below are a couple of excerpts from the conclusion of the paper.
Landfalling hurricanes contribute significantly to disaster losses both in the CONUS and globally. Large loss years such as 2017 remind us of the magnitude of losses that are possible when several major hurricanes make landfall in a single year. However, our normalization analyses suggest that the losses in 2017 are far from a worst-case scenario. Losses from a single storm striking the CONUS, analogous to the Great Miami hurricane of 1926, could result in twice the total direct economic loss amounts of 2017, totalling well over US$200 billion.
As growth continues, the United States should thus expect much greater hurricane damage in its future. Understanding the role of societal changes in loss potential, how such changes evolve over time and the role of disaster mitigation policies that might address loss potentials is essential to the design and implementation of effective actions under the targets of the Sustainable Development Goals.
The second point indicates that the United States can expect increasing hurricane damage costs in the future simply due to growth along hurricane prone coasts even if there is no change in the number or intensity of hurricanes. There need to be discussions about whether or not we as a society should continue to build-in and populate hurricane prone areas. Given that people desire to live right on warm water coasts and the very high short-term value available to investors and politicians, it would seem very unlikely to me that we as a society will stop building new and more lavish structures on coastlines that are vulnerable to hurricanes. Another possibility is to regulate through building codes that all structures be able to withstand the worst possible hurricane, but this is quite costly as well. We will probably have to accept that hurricanes will cause major property damage from time to time. One thing that should not be ignored is that urban areas on coastlines should not become so densely populated and congested that evacuations in a reasonable time become impossible. Urban planners need to have reliable evacuation plans.
Should hurricane damaged areas be rebuilt? Who should pay for the rebuilding? Current practice is for the federal government to reimburse people for their losses due to natural disasters. Thus most rebuild in the same disaster-prone area. In a sense the federal government encourages people to rebuild at a large cost to taxpayers. My opinion is that government should not outlaw building in hurricane prone areas, but the people that build in these areas have to assume the risks involved, that is, find private insurance or risk losing everything, i.e., don't expect to be bailed out with tax money. On the other hand, there are those who believe hurricane damages should be a shared public risk assumed by all taxpayers.
Another paper, Historical Global Tropical Cyclone Landfalls by Jessica Weinkle, Ryan Maue, and Roger Pielke Jr. comes to the same conclusions with respect to trends in worldwide tropical cyclone damage, i.e., economic damage from tropical cyclones has increased sharply in recent decades, and this can be explained by societal changes, not by changes in the frequency or intensity of tropical storms. Here is the abstract from the paper: "In recent decades, economic damage from tropical cyclones (TCs) around the world has increased dramatically. Scientific literature published to date finds that the increase in losses can be explained entirely by societal i changes (such as increasing wealth, structures, population, etc) in locations prone to tropical cyclone landfalls, rather than by changes in annual storm frequency or intensity. However, no homogenized dataset of global tropical cyclone landfalls has been created that might serve as a consistency check for such economic normalization studies. Using currently available historical TC best-track records, we have constructed a global database focused on hurricane-force strength landfalls. Our analysis does not indicate significant long-period global or individual basin trends in the frequency or intensity of landfalling TCs of minor or major hurricane strength. This evidence provides strong support for the conclusion that increasing damage around the world during the past several decades can be explained entirely by increasing wealth in locations prone to TC landfalls, which adds confidence to the fidelity of economic normalization analyses." The link to the article may not work if you using a computer outside of the University of Arizona network.
Although tropical storms and hurricanes continue to be the most costly type of severe weather for the United States in terms of economic damage, in general they have been responsible for relatively small numbers of deaths in recent decades compared with the early decades of the 1900s. The explanation for the decreasing trend in deaths is simple ... In the early part of the century before satellite imagery and sophisticated forecasting methods, people had little warning of an approaching hurricane, and many were killed. In fact the Galveston, Texas hurricane of 1900 still ranks as the most deadly in U.S. history with from 8 to 12 thousand deaths. In modern times, people are warned of an approaching storm and either evacuate or make necessary preparations.
Hurricane Katrina in 2005 was an exception to this trend. Katrina forced us to reconsider the long-held belief that hurricanes will not cause many deaths in the United States because we have such a great hurricane monitoring system and no storm will catch anyone by surprise. Sure property damage was high, but we have come to expect that. The question here is Even with the ample warning provided by the National Hurricane Center, why did so many people die as a result of Katrina? The final death count is over 1800 people. This is the most deaths related to a single hurricane since 1928. There are several reasons for the large loss of life from Katrina. Undoubtedly the vulnerability of the New Orleans area to levee failure and flooding was a strong contributing factor and had Katrina hit somewhere else there would have been less loss of life. New Orleans actually sits below sea level and is protected on all sides by levees. When levees fail or water pours over the top, the bowl in which New Orleans sits begins to fill with water. However, the biggest contributing factor was the decisions made by many people to ignore evacuation warnings and remain home for the storm. The National Hurricane Center's forecasts made 72 hours prior to Katrina making landfall were almost perfect.
Yes, federal and local government screwed up in their response to the disaster, but the only sure way to save lives is for people to evacuate before the storm hits. One reason heard over and over from survivors is that they did not leave because they didn't think things could get that bad. This reaction is probably due to the several factors: (1) major hurricanes don't strike very often; (2) many residents were either new to the gulf coast or never experienced a major hurricane before; (3) some had stayed and lived through other hurricanes, thinking that they are no big deal; and (4) some had evacuated for previous storms that may have missed their house or turned out to be not that severe, so they refused to leave this time; (5) some did not want to leave their possessions unattended; and (6) some had difficulty finding transportation to safer locations. There were undoubtedly other contributing factors and personal excuses as well. In my opinion, individuals need to educate themselves and make responsible decisions for themselves, their families, and anyone else who relies on them. People living in hurricane prone areas need to understand the devastion that hurricanes can cause, keep informed on hurricane activity in their area, and be prepared to make intelligent decisions. People in New Orleans had the additional responsibility to understand the vulnerability of their city to the possibility of levee breaks whenever a major storm is near. On the other hand, others believe that government should take on more of the responsibility to make sure that people evacuate.
Unfortunately, a Katrina-type disaster was foreseen by many people. In fact a New Orleans newspaper published an article in 2001 about a devasting senario very close to what actually happened. Others just warned about how the people living in hurricane-prone areas seemed unware of the potential damage that can occur when major hurricanes make landfall and would not take appropriate action. Quoting the sumarizing statement from a report generated by the National Hurricane Center (which was prepared prior to the 2004 and 2005 monster hurricane seasons):
"In virtually every coastal city of any size from Texas to Maine, the present National Hurricane Center Director, Max Mayfield, has stated that the United States is building toward its next hurricane disaster. The population growth and low hurricane experience levels of many of the current residents, form the basis for this statement. The areas along the United States Gulf and Atlantic coasts where most of this country's hurricane related fatalities have occurred are also now experiencing the country's most significant growth in population. This situation, in combination with continued building along the coast, will lead to serious problems for many areas in hurricanes. Because it is likely that people will always be attracted to live along the shoreline, a solution to the problem lies in education, preparedness and mitigation.
The message to coastal residents is: Become familiar with what hurricanes can do, and when a hurricane threatens your area, increase your chances of survival by moving away from the water until the hurricane has passed! Unless this message is clearly understood by coastal residents through a thorough and continuing preparedness effort, disastrous loss of life is inevitable in the future."
We can be otpimistic about the well organized and rather smooth evacuations that have taken place for hurricanes that have made landfall on the US coastine after hurricane Katrina. Hopefully, we will never have another hurricane death toll like Katrina ever again. Lanfalling hurricanes are powerful and potentially deadly storms. Even with better preparation and evacuations, 106 US residents were killed as a result of hurricane Sandy in 2012, 88 by Harvey in 2017, 73 by Irma in 2017, and 96 by Ida in 2021 across 9 US states. Few of these deaths seemed to have resulted from people not taking the storm seriously, as was the case for Katrina. However, if we go through another slow period in Atlantic hurricanes, like 1970-1994, will people again forget how potentially deadly hurricanes can be?
![]()
![]()
![]()
![]()