![]()
![]()
![]()
![]()
 A "Parcel of Air" is an iminaginary body of air about the size
of a large balloon that is used to explain the behavior of air.
We will describe what is meant by the relative humidity and dew
point temperature of air in a parcel. The parcel concept is used
because we often would like to know what will happen to air as it
moves in the atmosphere, and air tends to move together in blobs about
the size of parcels (not molecule by molecule). The parcel concept
will be extemely important in describing cloud and thunderstorm formation.
For one thing, we will want to keep track of the relative humidity in
an air parcel as it moves up and down in the atmosphere.
A "Parcel of Air" is an iminaginary body of air about the size
of a large balloon that is used to explain the behavior of air.
We will describe what is meant by the relative humidity and dew
point temperature of air in a parcel. The parcel concept is used
because we often would like to know what will happen to air as it
moves in the atmosphere, and air tends to move together in blobs about
the size of parcels (not molecule by molecule). The parcel concept
will be extemely important in describing cloud and thunderstorm formation.
For one thing, we will want to keep track of the relative humidity in
an air parcel as it moves up and down in the atmosphere.
The relative humidity in an air parcel is defined as the ratio of the amount of water vapor actually in the air to the maximum amount of water vapor required for saturation at a particular temperature
| water vapor content | ||||
| Relative humidity | ≡ | RH | = | |
| water vapor capacity |
For example, air with a 50 percent relative humidity actually contains one-half the amount of water vapor required for saturation. Air with a 100 percent relative humidity is said to be saturated because it is filled to capacity with water vapor.
One way to compute relative humidity is to use the concept of vapor pressure that was discussed on the previous reading page. The vapor pressure is used to keep track of the amount of water vapor in the air, and the saturation vapor pressure is used to keep track of the capaity for water vapor or the maximum possible amount of water vapor. Thus, the fraction {water vapor content} / {water vapor capacity} would be RH = {vapor pressure} / {saturation vapor pressure} or RH = e/es using the symbols defined on the previous page for vapor pressure and saturation vapor pressure.
However, following meteorological convention, we will use something called Mixing Ratio to keep track of the amount of water vapor in the air (instead of vapor pressure) and something called Saturation Mixing Ratio to keep track of the capacity or maximum possible amount of water vapor in the air (instead of the saturation vapor pressure}.
Below is the definition of the mixing ratio, which will be represented by the symbol capital U. Please do not be concerned or scared by the definition. The mixing ratio is just another way to specify the amount of water vapor in the air. It is used in the same way as the vapor pressure.
| actual (measured) mass of water vapor (in parcel) in grams | ||||
| Mixing Ratio | ≡ | U | = | |
| mass of dry (non water vapor) air (in parcel) in kilograms |
Below is the definition of the saturation mixing ratio. We will use the Saturation Mixing Ratio, which will be represented by the Symbol capital U with a subscript s (Us) to keep track of the maximum possible amount of water vapor that can be in the air.
| mass of water vapor required for saturation (in parcel) in grams | ||||
| Saturation Mixing Ratio | ≡ | Us | = | |
| mass of dry (non water vapor) air (in parcel) in kilograms |
| actual (measured) water vapor content | U | |||||
| Relative Humidity | ≡ | RH | = | = | ||
| maximum possible water vapor amount (saturation) | Us |
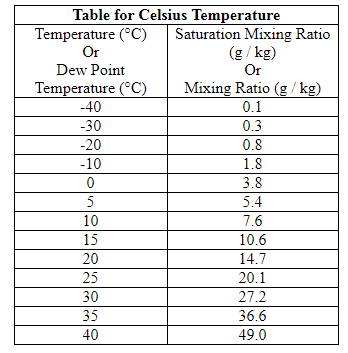
You are expected to know this equation for relative humidity and to be able to use it to solve simple problems. Just as with saturation vapor pressure, the saturation mixing ratio, which specifies the maximum amount of water vapor that can be in the air, is determined by the air temperature ... the higher the air temperature, the greater the saturation mixing ratio. We will use pre-computed tables of saturation mixing ratio to help solve problems. You should open the tables and make sure you understand the relationship between air temperature and the saturation mixing ratio, which is, as the air temperature increases, the saturation mixing ratio increases rapidly (exponentially). When using these tables make sure to use the correct temperature table, Fahrenheit or Celsius.
Let's go through an example.
A. What is the RH of an air parcel with a temperature of 25°C and a water vapor mixing ratio of U = 8 g/kg?
B. Continuing the example. What will the RH of the air in the parcel be if the parcel is cooled to T = 15°C with no change in the water vapor content?
Most people use Relative humidity to describe the water vapor content of the air, but it is widely misunderstood. Relative humdity in itself does not indicate the actual amount of water vapor in the air because it depends on temperature. For example, an air parcel at a temperature of 10°C with RH = 100% contains less water vapor than an air parcel at a temperature of 25°C with RH = 50%. You should be able to convince yourself of this by using the relative humidity equation and the table of saturation mixing ratios.
The dew point temperature (Td) is defined as the temperature to which an air parcel would have to be cooled (with no change in its water vapor content) in order for it to be saturated with water vapor. It is determined by the amount of water vapor in the parcel, i.e., as the mixing ratio, U, increases, the dew point temperature, Td increases. If you know the actual mixing ratio in an air parcel, you can use the table of saturation mixing ratios to get the dew point temperature.
The dew point temperature is the answer to this question: "Given the amount of water vapor that is in a parcel, what would the air temperature have to be for the parcel to be saturated with that amount of water vapor?" The dew point temperature does indicate the actual vapor content of the air: the higher the dew point, the more water vapor in the air. You should realize that the dew point temperature is not something that is measured with a thermometer. It is really used to indicate the amount of water vapor that is in the air.
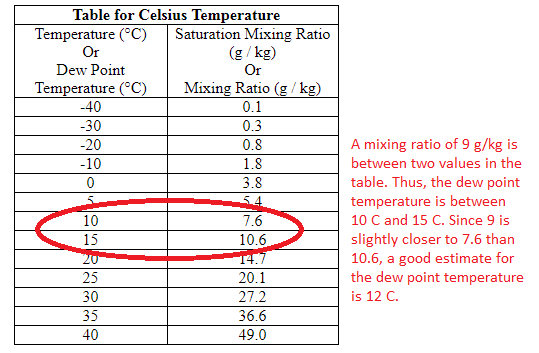
You are expected to be able to use the Relative Humidity equation and the table of saturation mixing ratios to perform simple calculations of dew point temperature. So far we have used the saturation mixing ratio tables to correspond air temperature in the left hand column with the saturation mixing ratio in the right hand column. The saturation mixing ratio tables are also be used to correspond the dew point temperature, Td in the left hand column with the mixing ratio, U, in the right hand column. In other words the actual amount of water vapor in the air can be specified using the mixing ratio or the dew point temperature.
Dew point temperature calculation example.
If the air temperature is T = 10°C and the relative humidity is RH = 50%, what is the dew point temperature, Td?
The difference between air temperature and dew point temperature can indicate whether the relative humidity is low or high.
As mentioned, the dew point temperature is a measure of the amount of water vapor that is in the air. So if you wanted to compare the amount of water vapor in the air at two different locations, the one with the higher dew point temperature has the greater water vapor content. A graph of the dew point temperature with time indicates how the amount of water vapor in the air changes at a fixed location. Often there is an increase in dew point temperature just before and after a rain event.
A couple of links to dew point information:
dew point temperature and relative humidity on the Univ. of Arizona campus over the last 24 hours. Click on the weekly or monthly plots at the bottom of the page to see a longer time series of changes in dew point temperature. Look at how the dew point temperature and relative humidity change on days when precipitation was measured on campus.
U.S. map of current dew-point temperature. The locations on the map with the higher dew point temperatures have more water vapor in the air. However, the map does not indicate much about the relative humidity around the United States. Why not? What other information would you need to be able to determine values of relative humidity?
Normally, near the Earth's surface, the relative humidity is less than 100%, therefore, net evaporation is occurring since the rate of evaporation is faster than the rate of condensation. To convince yourself of this, leave out an uncovered glass of water. The water will eventually evaporate. In fact the lower the relative humidity, the faster the rate of net evaporation. Once evaporated from the surface, water vapor moves around with the rest of the air.
Occasionally, there may be net condensation occurring near the Earth's surface. If air near the ground is cooled below its original dew point temerature, fog will result. Fog is nothing more than a cloud at ground level. We will talk more about clouds soon. Beside fog, are there ever situations near the Earth's surface when net condensation occurs? ANSWER: Yes, dew and frost. When the surface temperature of an object becomes colder than the dew point temperature of the surrounding air, water vapor from the air will condense onto the surface of the object, since the rate of evaporation is slower than the rate of condensation at the object's surface. This will be seen as condensed water on the surface of the object.
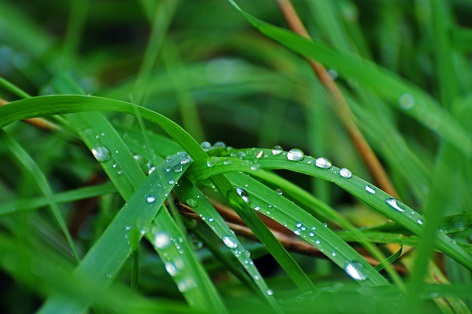
Dew on grass |
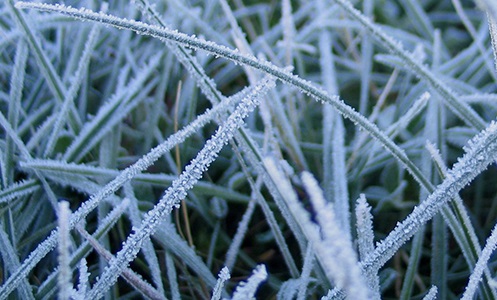
Frost on grass |
You should understand the points made below. You can apply these points to explain what will happen under conditions where the relative humidity is known.
ATMO 336 students are expected to be able to perform two types of calculations. Examples of each type are shown below.
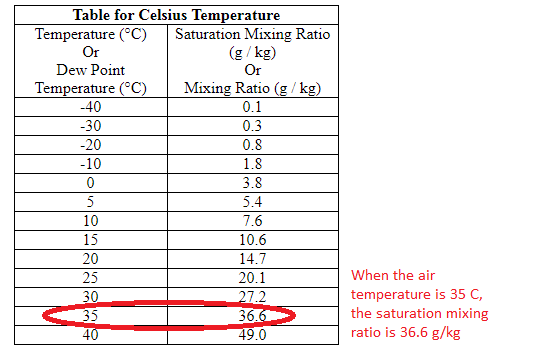
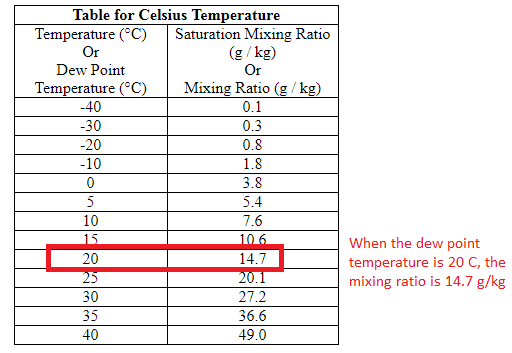
If the air temperature is 35°C and the dew point temperature is 20°C, determine the relative humidity.
If the air temperature is 30°C and the relative humidity is 33%, determine the dew point temperature.
![]()
![]()
![]()
![]()