Maps for the Weather Forecasting Project for Fall 2021

Click on the thumbnails below to open larger images of each map in another window or tab.

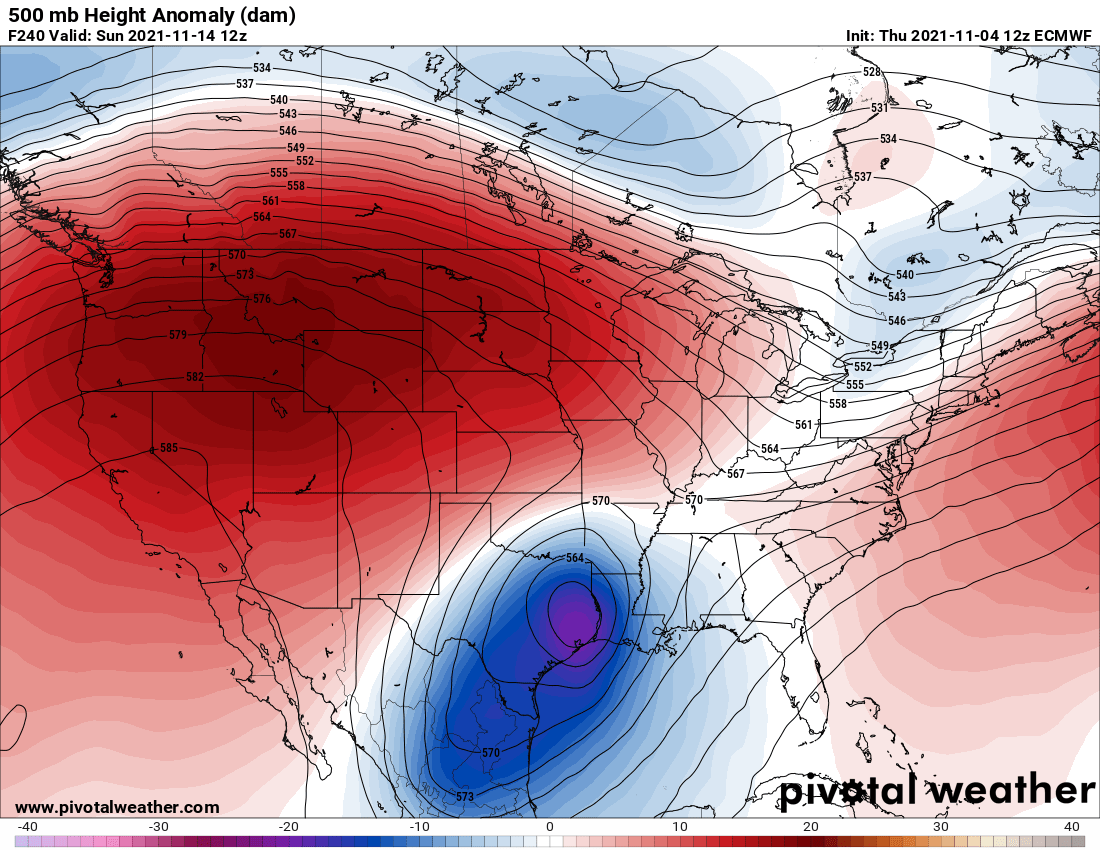
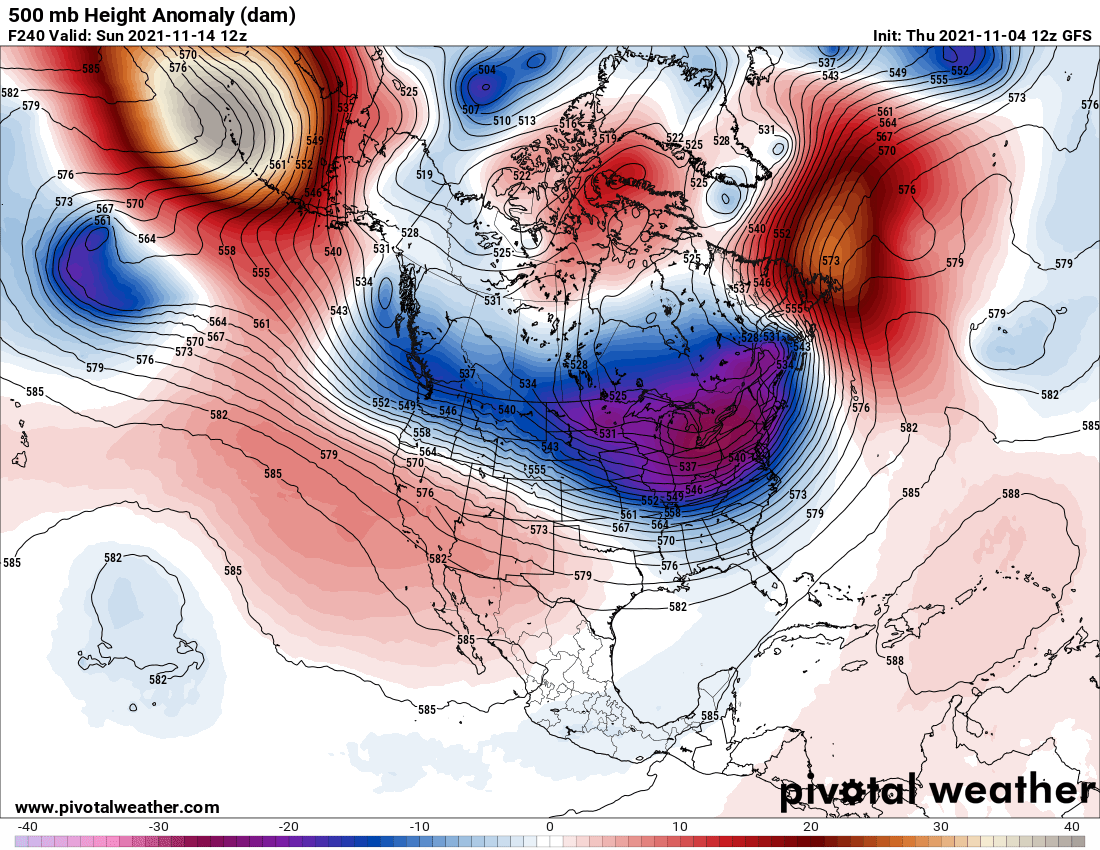
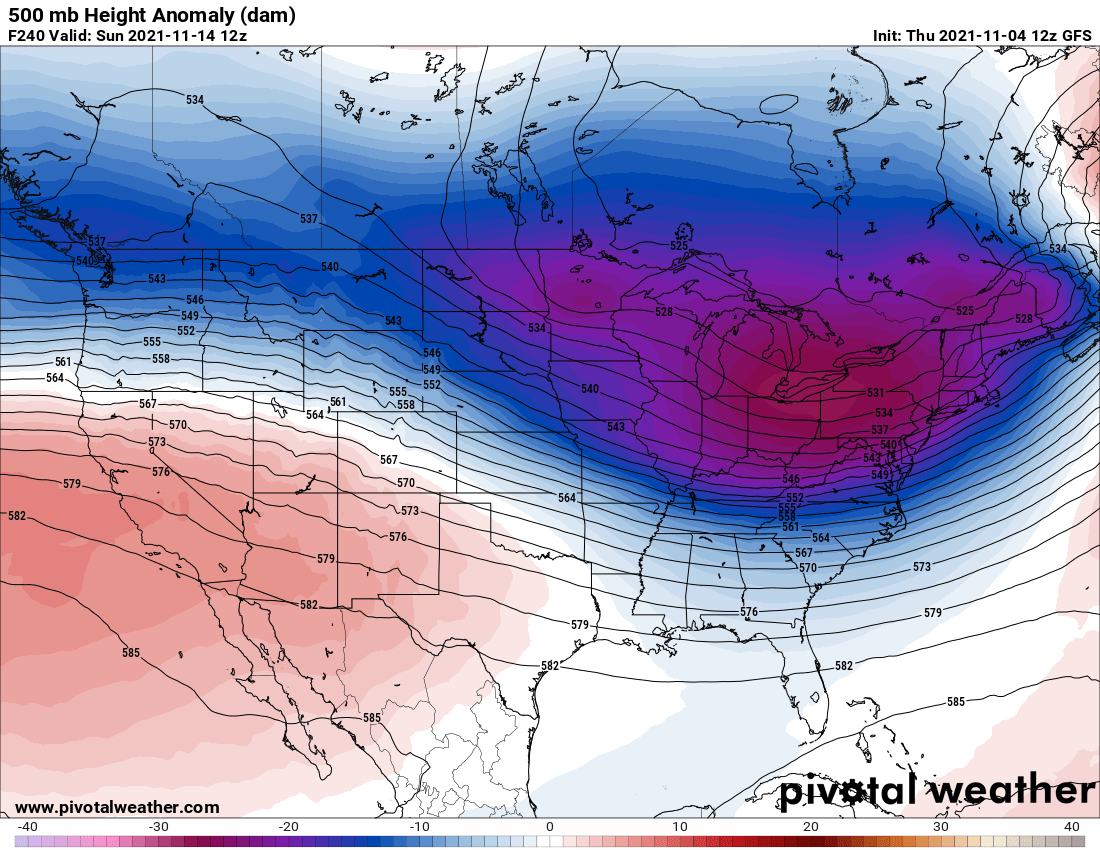
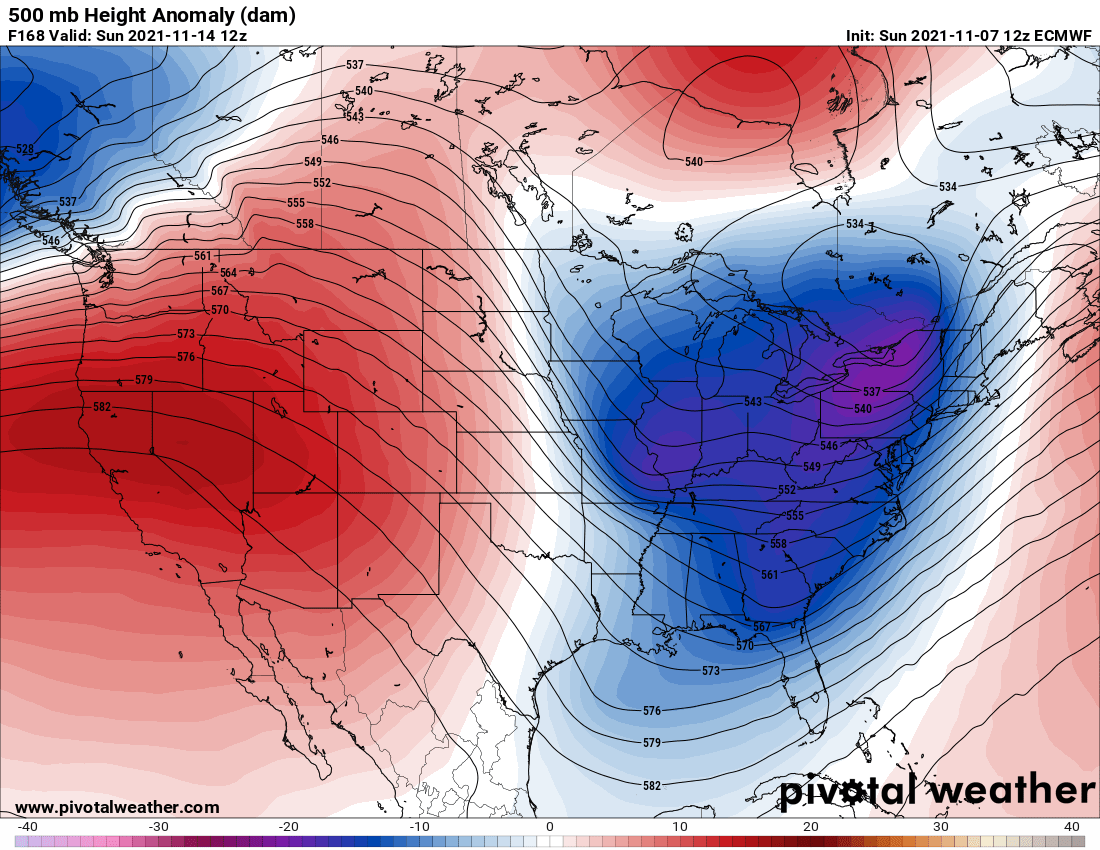
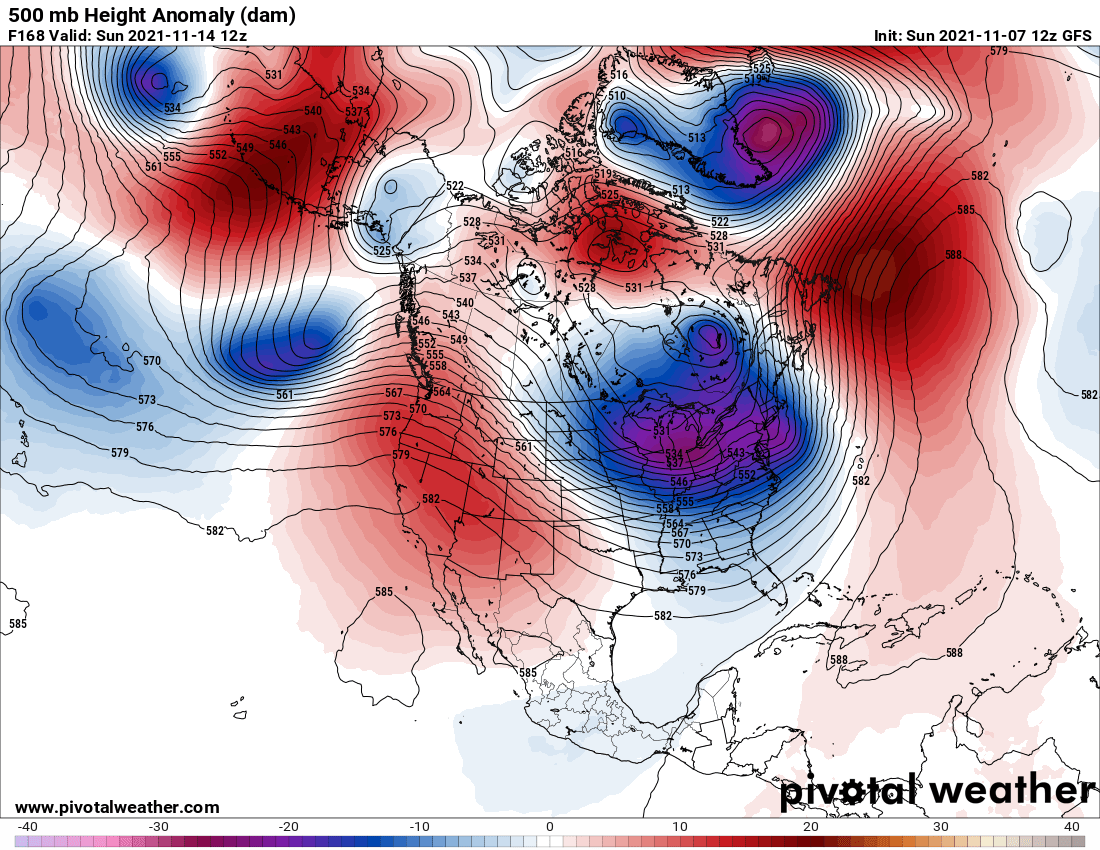
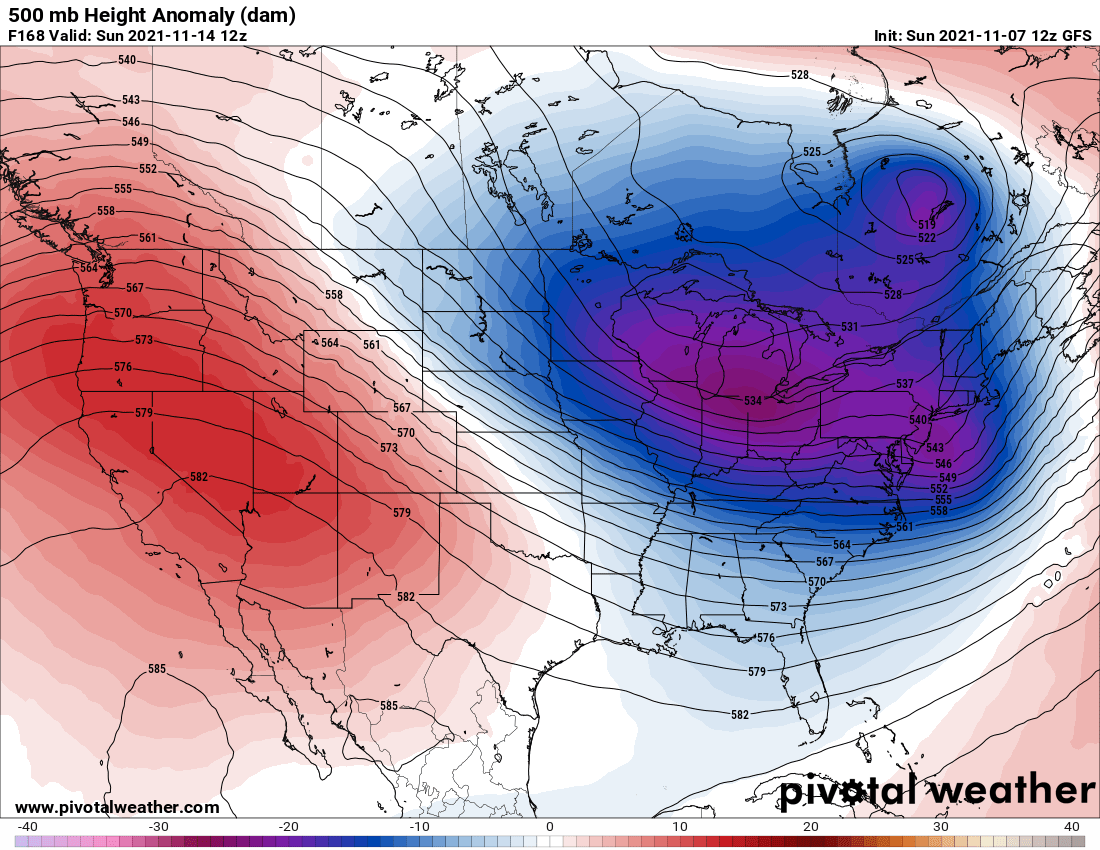
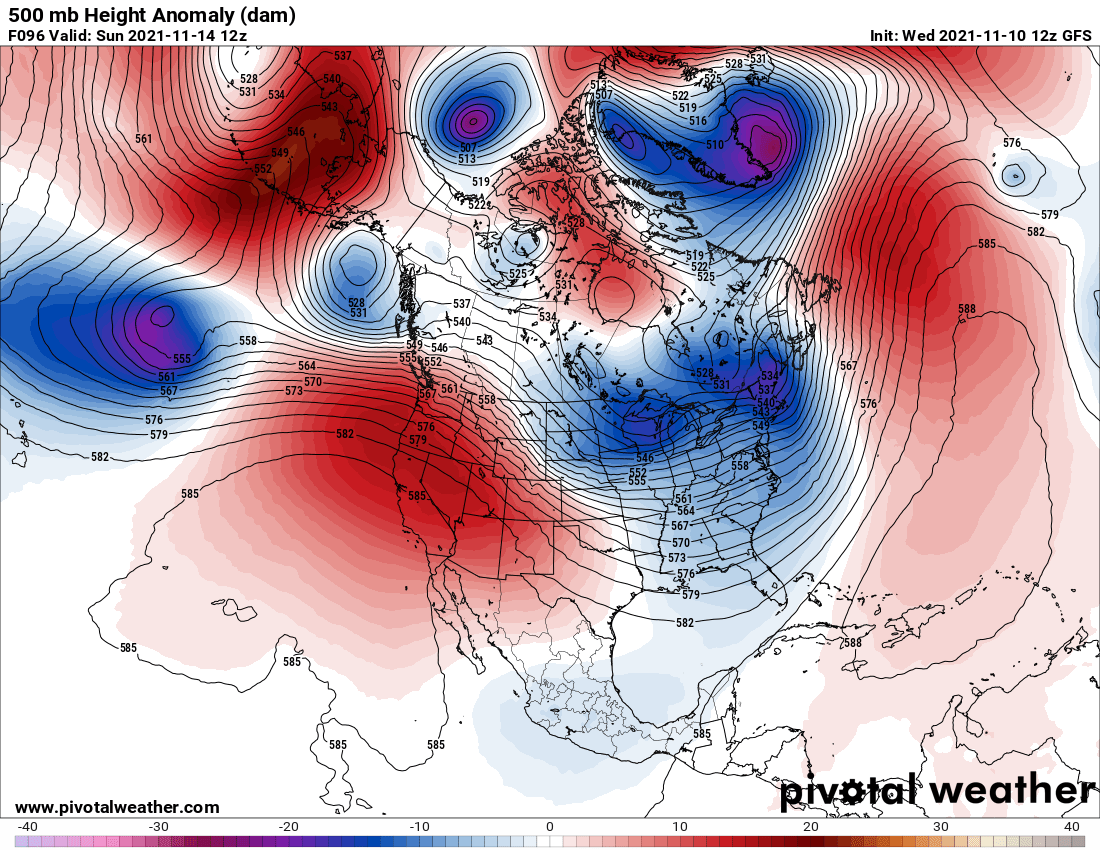
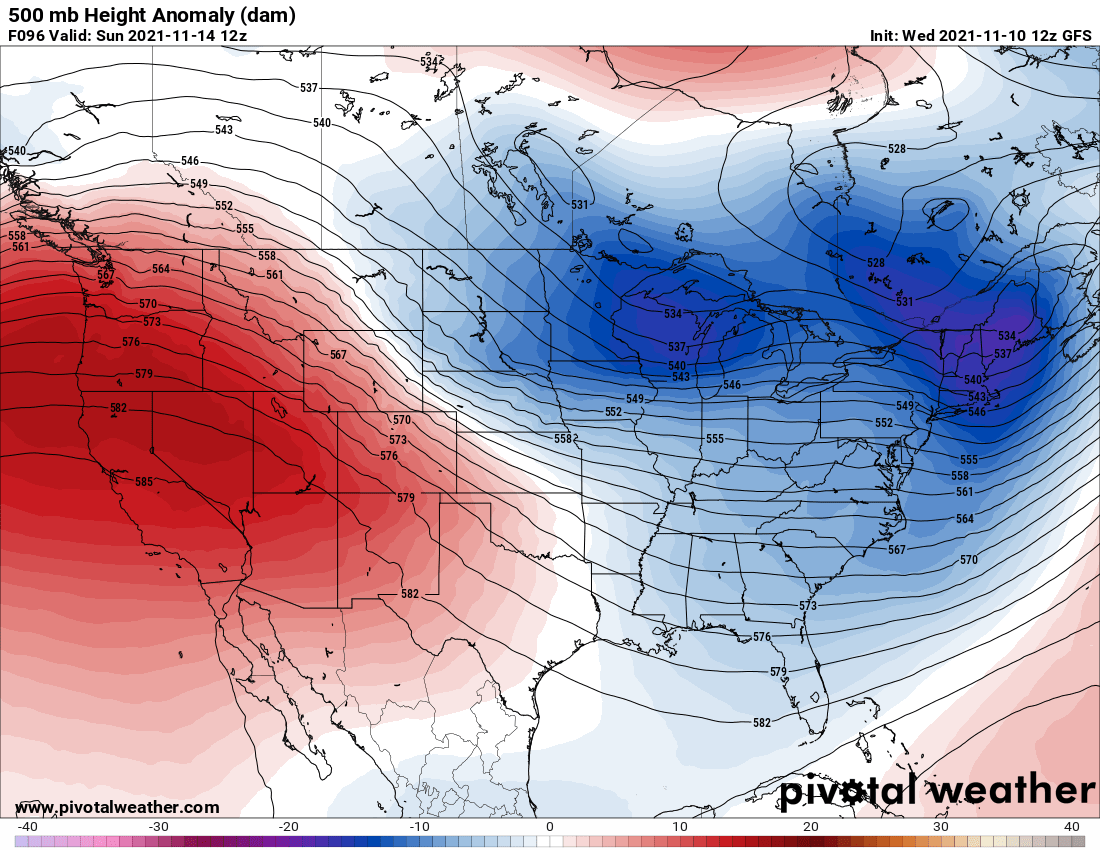
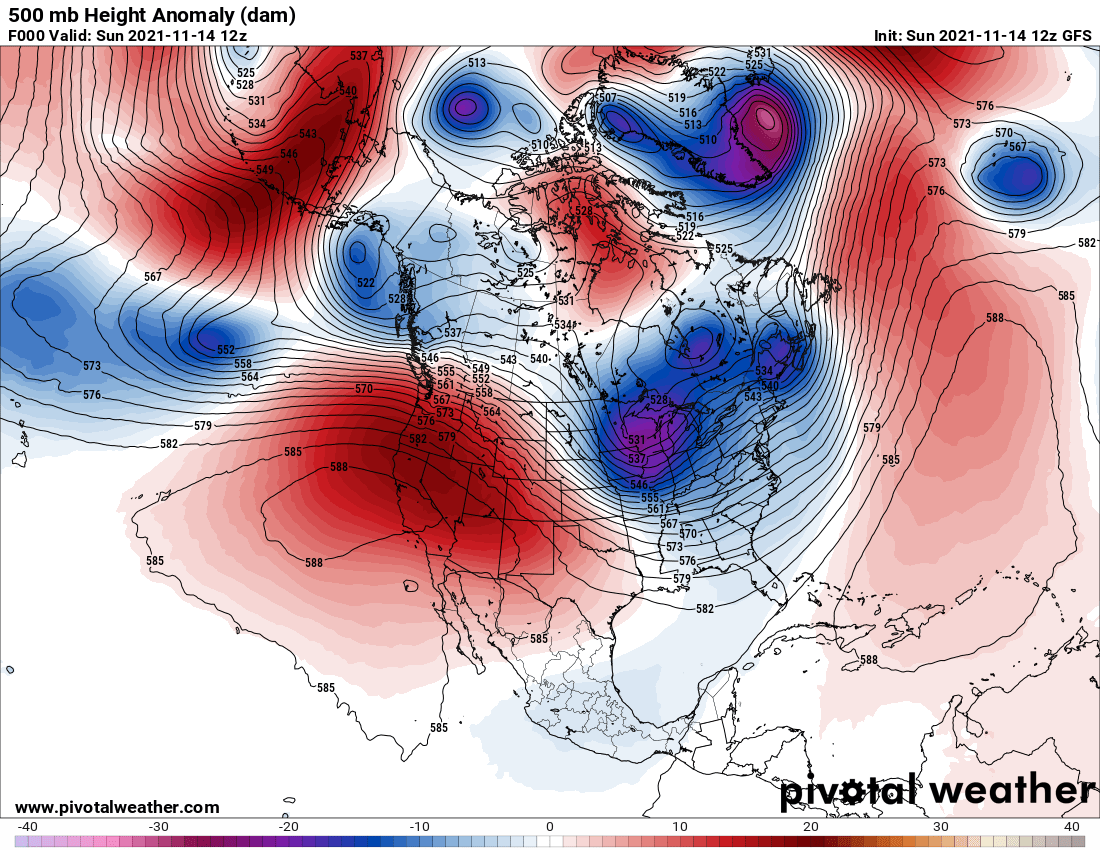
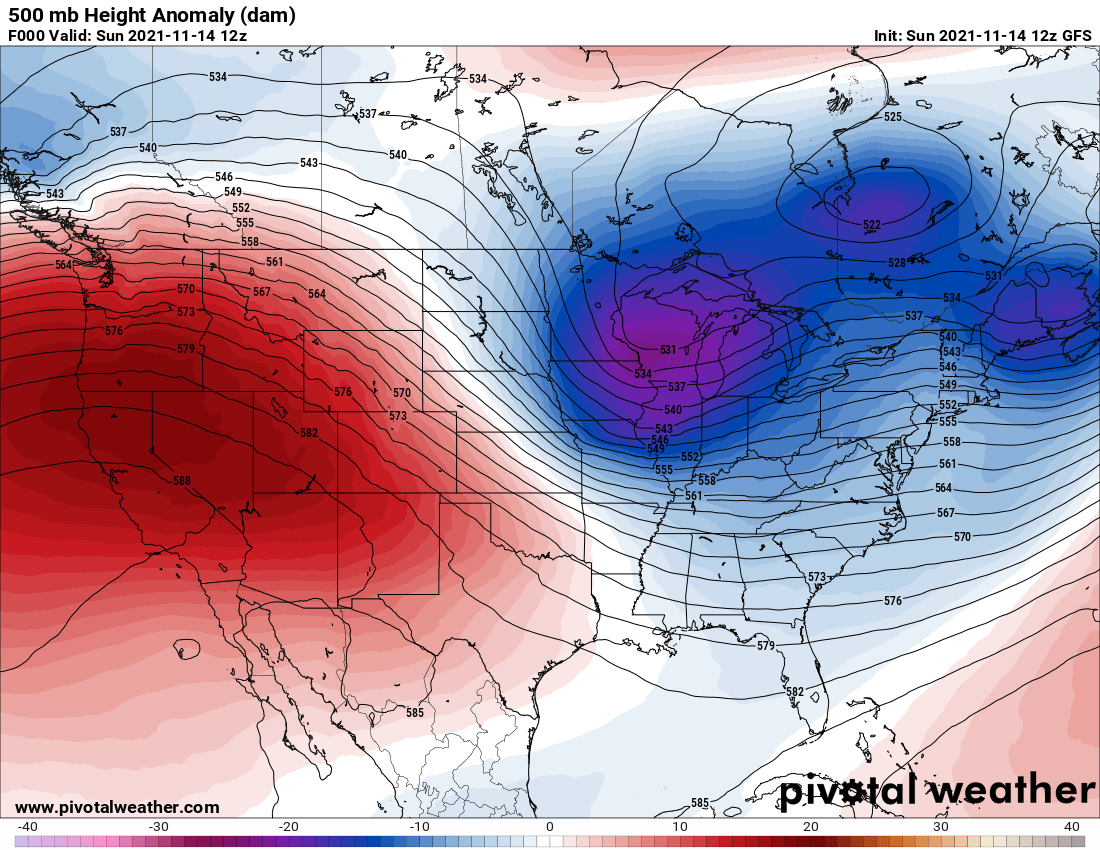
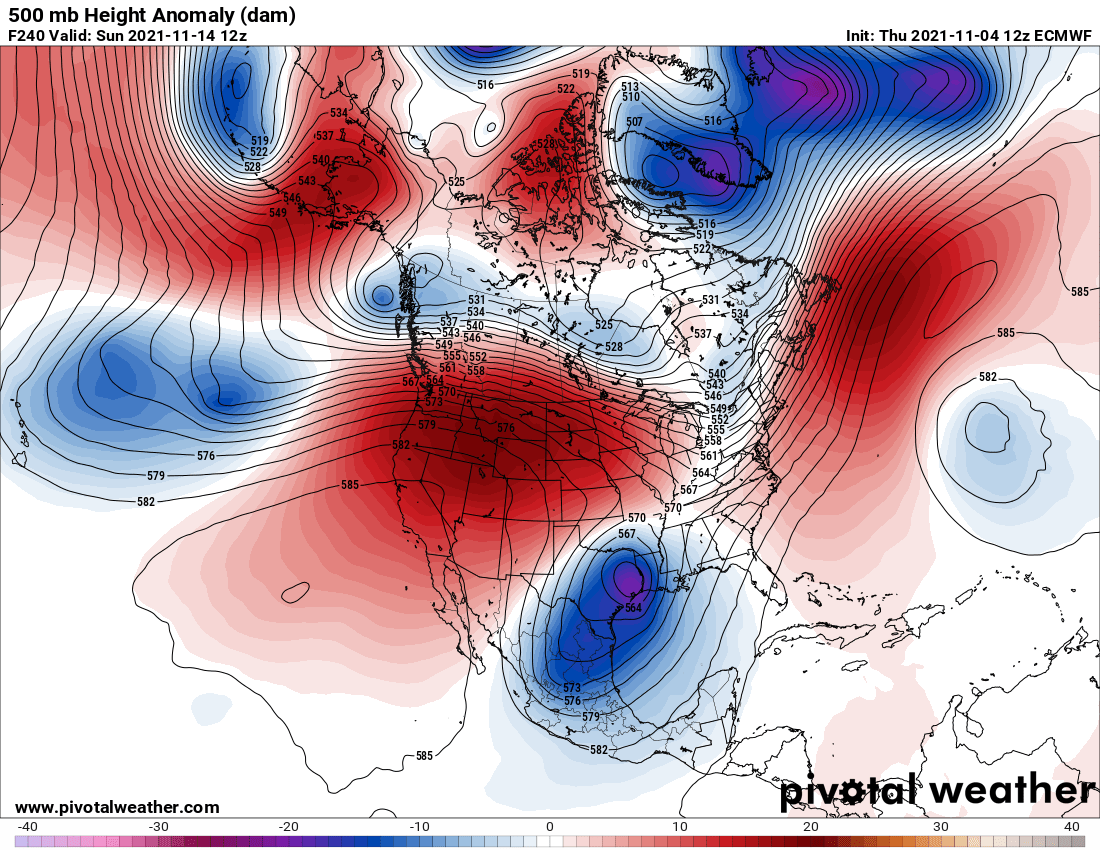
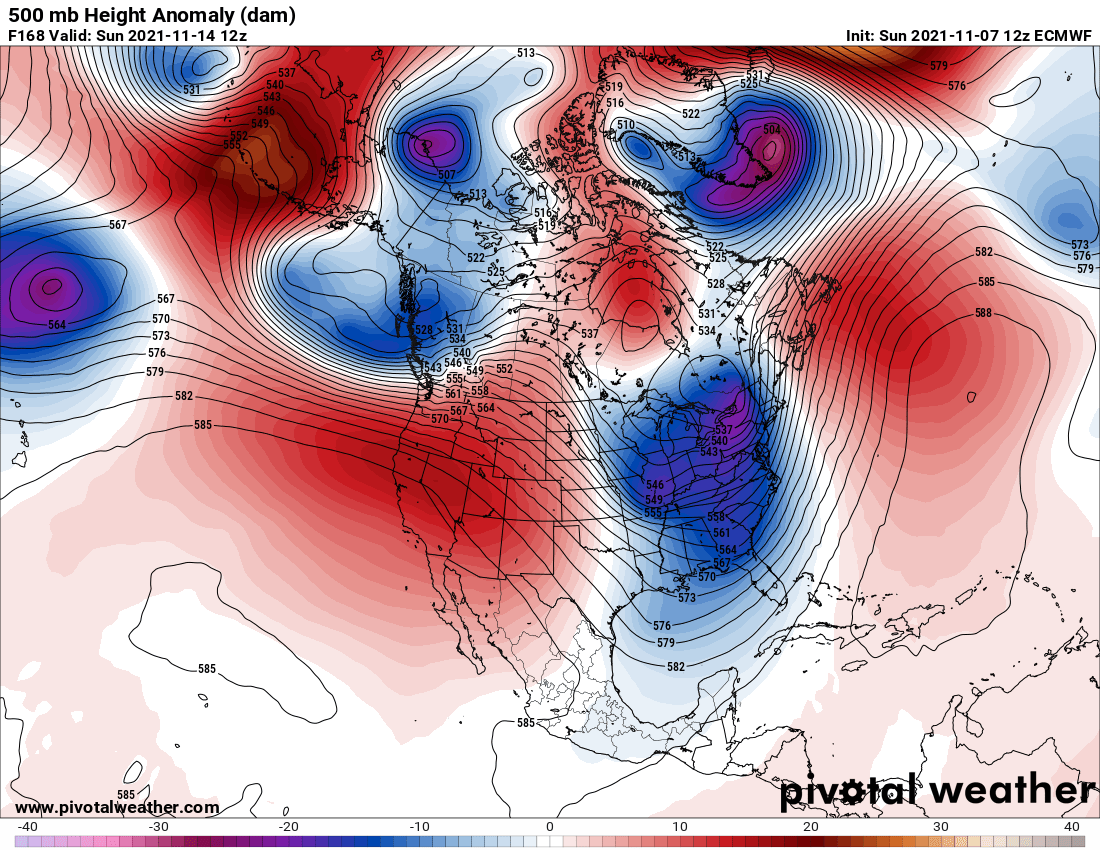
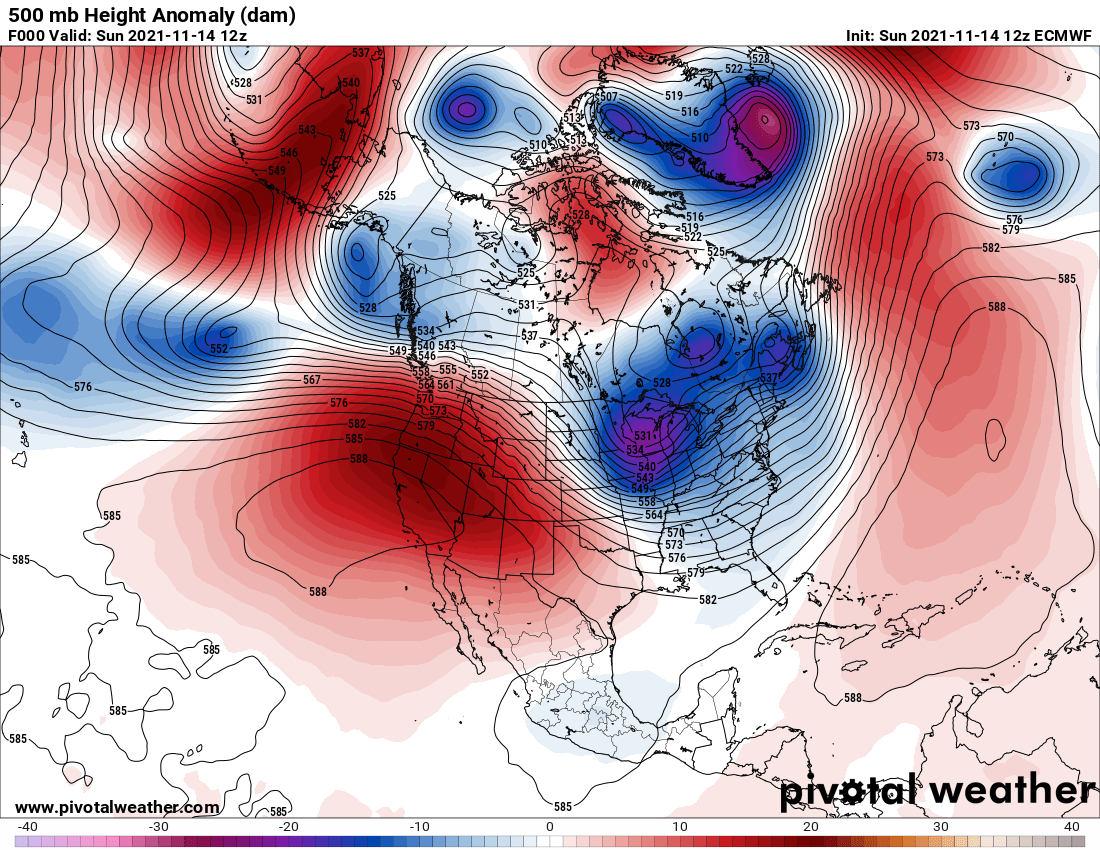
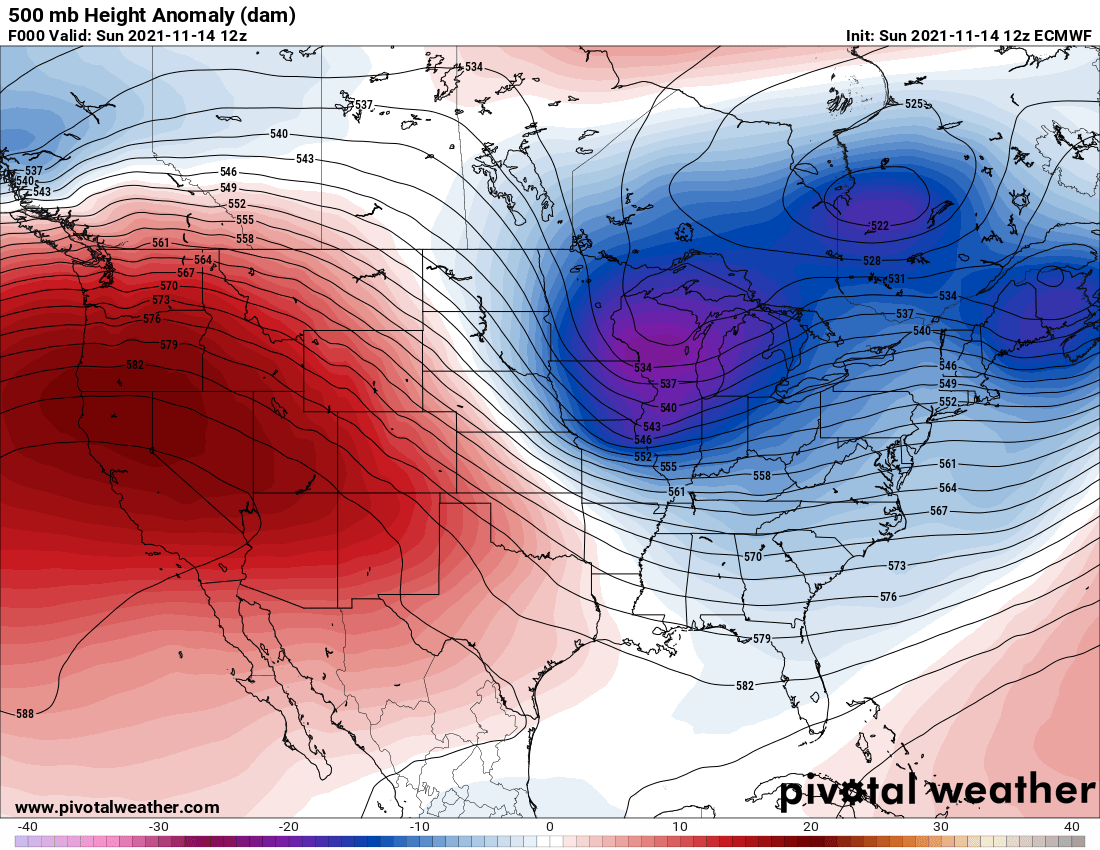
The forecasts are all valid for 12Z on Sunday, November 14. The difference between each row is the length of the forecast time between the model initialization time and the valid time for the forecast. The last row contains the actual (or true) 500 mb height pattern for 12Z on Sunday, November 14, so it is not actually a forecast, but the 500 mb height pattern based on measurements. A perfect forecast in any of the rows with forecast maps would exactly match the maps in the last row, which is sometimes called the forecast verification map.

The columns contain both the ECMWF and GFS model forecasts. Each model forecast is provided for two zoom settings, one centered over North America, and the other zooms in on the continental United States. I like to use the North American setting to view the large-scale weather features, like troughs and ridges, and the continental US setting to see more detail when reading the height at a given location. I highly recommend you click on the US zoom when reading the 500 mb heights at your selected cities or locations.

The forecast and verification maps will be available about 6 hours after forecast initialization or verification time.

Table of 500 mb maps used for the Weather Forecasting Project

Forecast Period ECMWF Model North America ECMWF Model US Zoom GFS Model North America GFS Model US Zoom
10-day forecast
Initiated at 12Z Thursday, November 4
Valid 12Z Sunday, November 14
7-day forecast
Initiated at 12Z Sunday, November 7
Valid 12Z Sunday, November 14
4-day forecast
Initiated at 12Z Wednesday, November 10
Valid 12Z Sunday, November 14
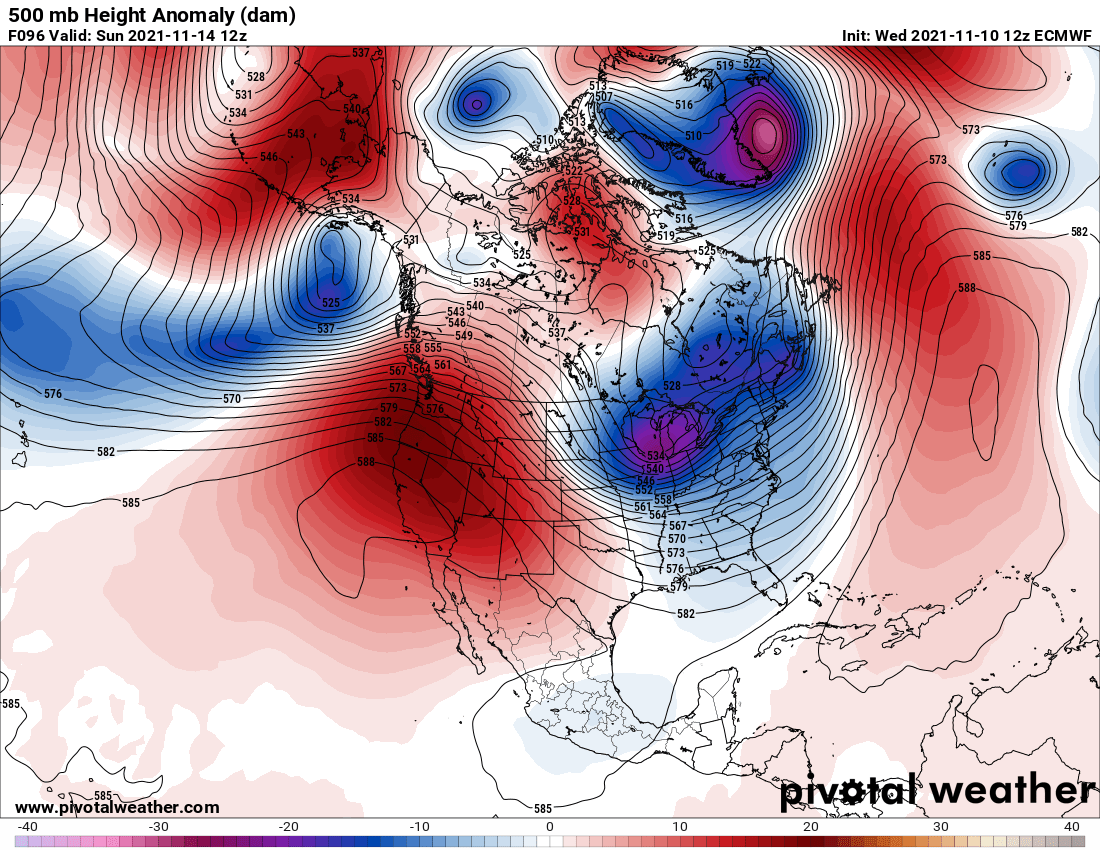
0-day forecast
Initialization for 12Z Sunday, November 14
These are the Verification maps for the forecasts above
The 500 mb patterns on these maps are basically identical;
This is the actual (true) 500 mb height pattern.
Dale Ward