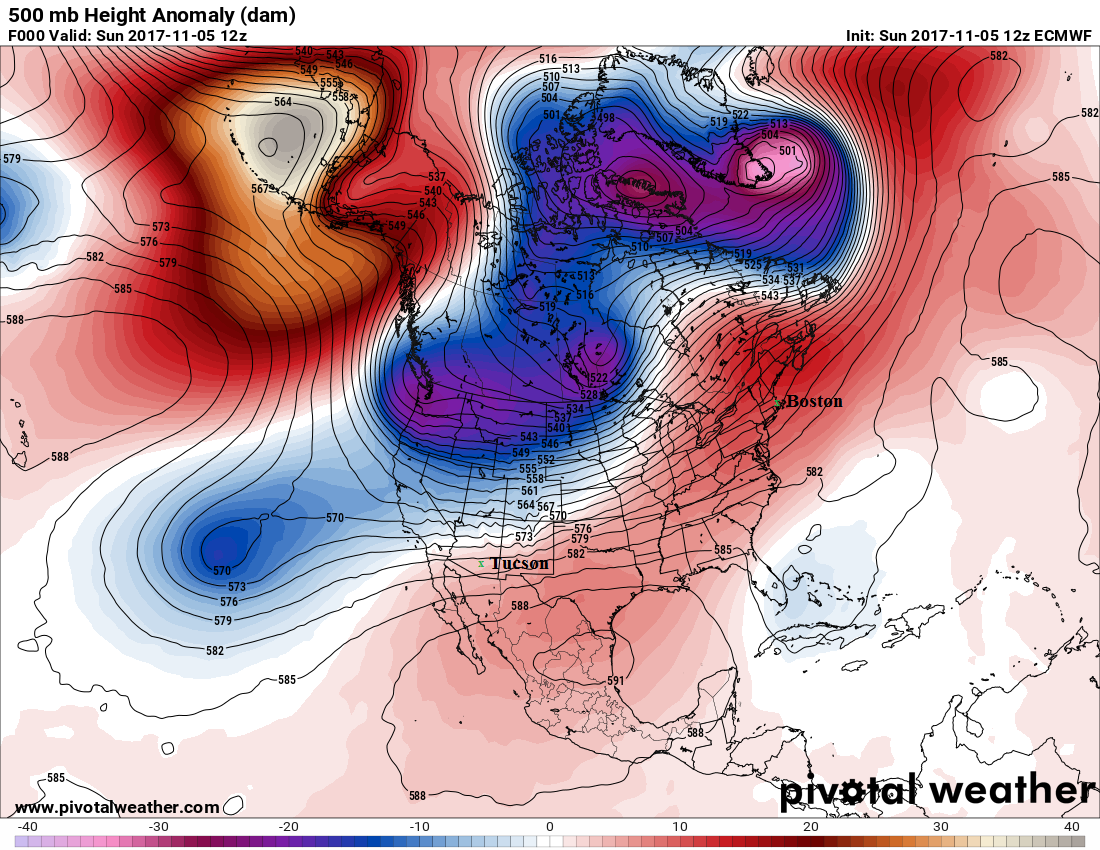
Model Forecast 500 mb Maps
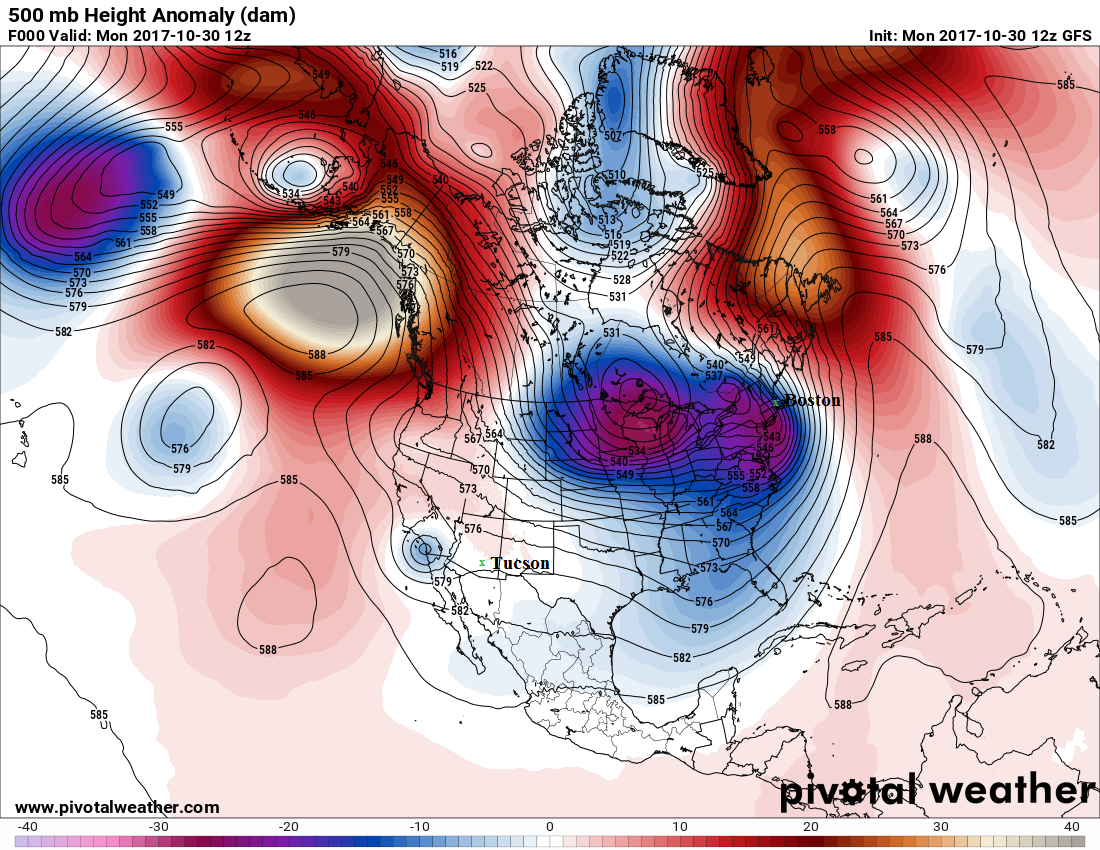
Valid 12Z October 30
[Use for paragraph 1, section 2a]
[Use for table 1, section 2b]
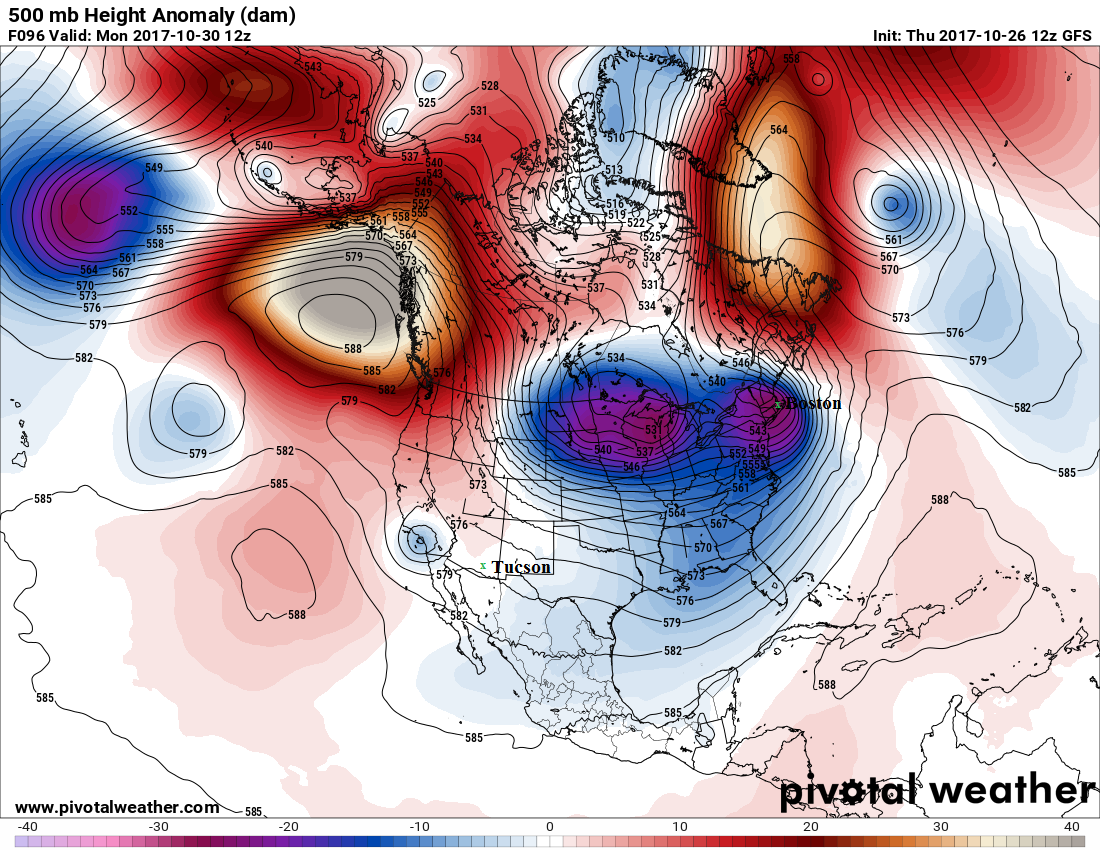

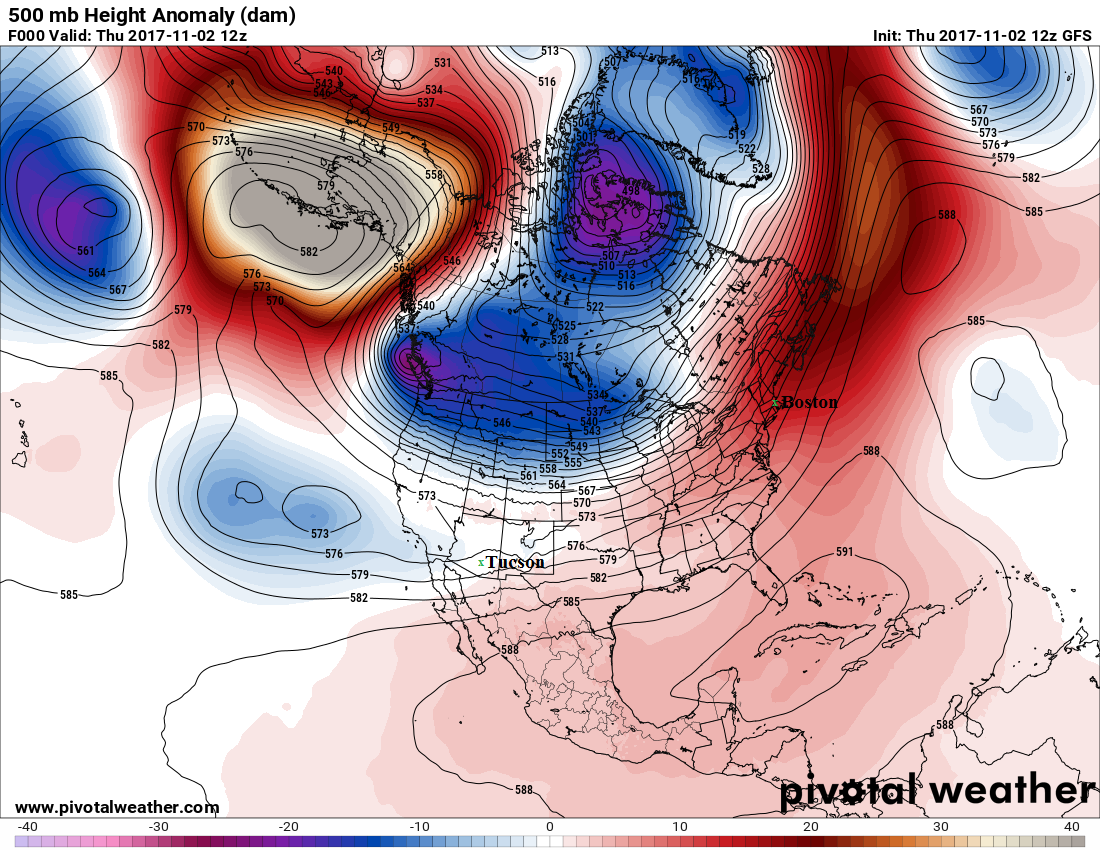
Valid 12Z November 2
[Use for paragraph 2, section 2a]
[Use for table 2, section 2b]
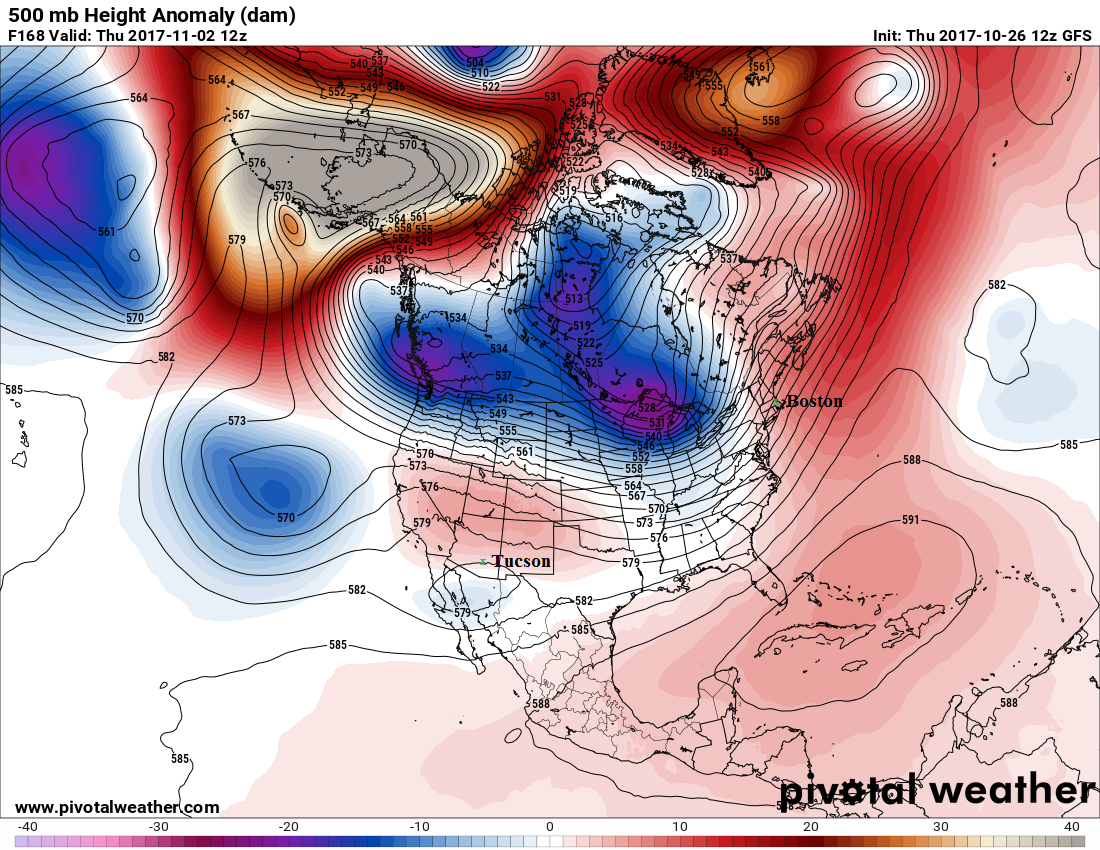
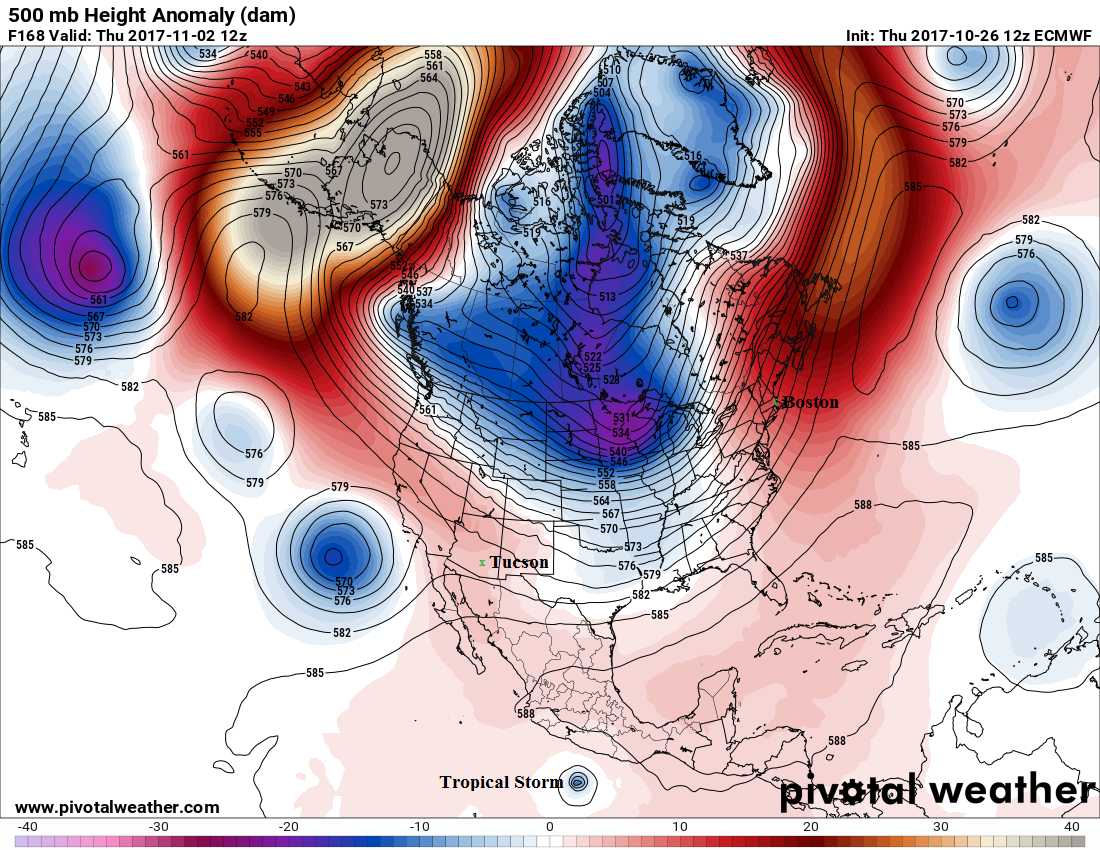
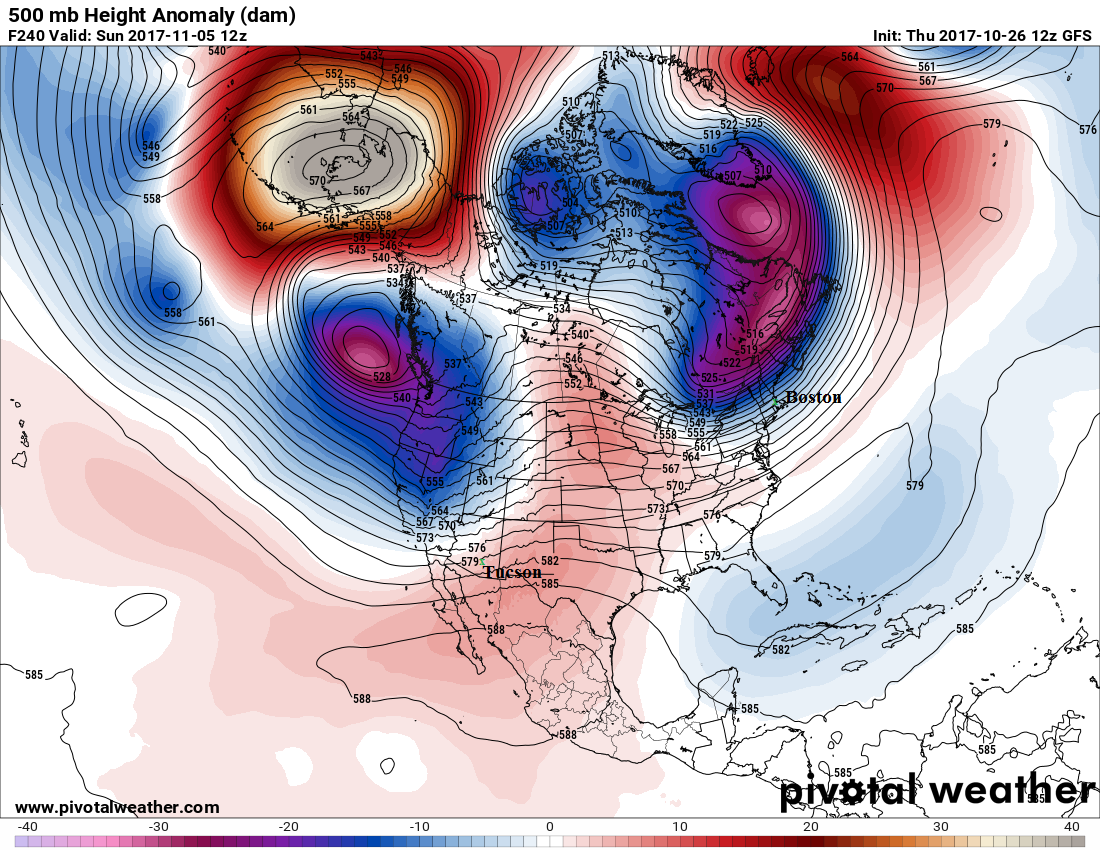
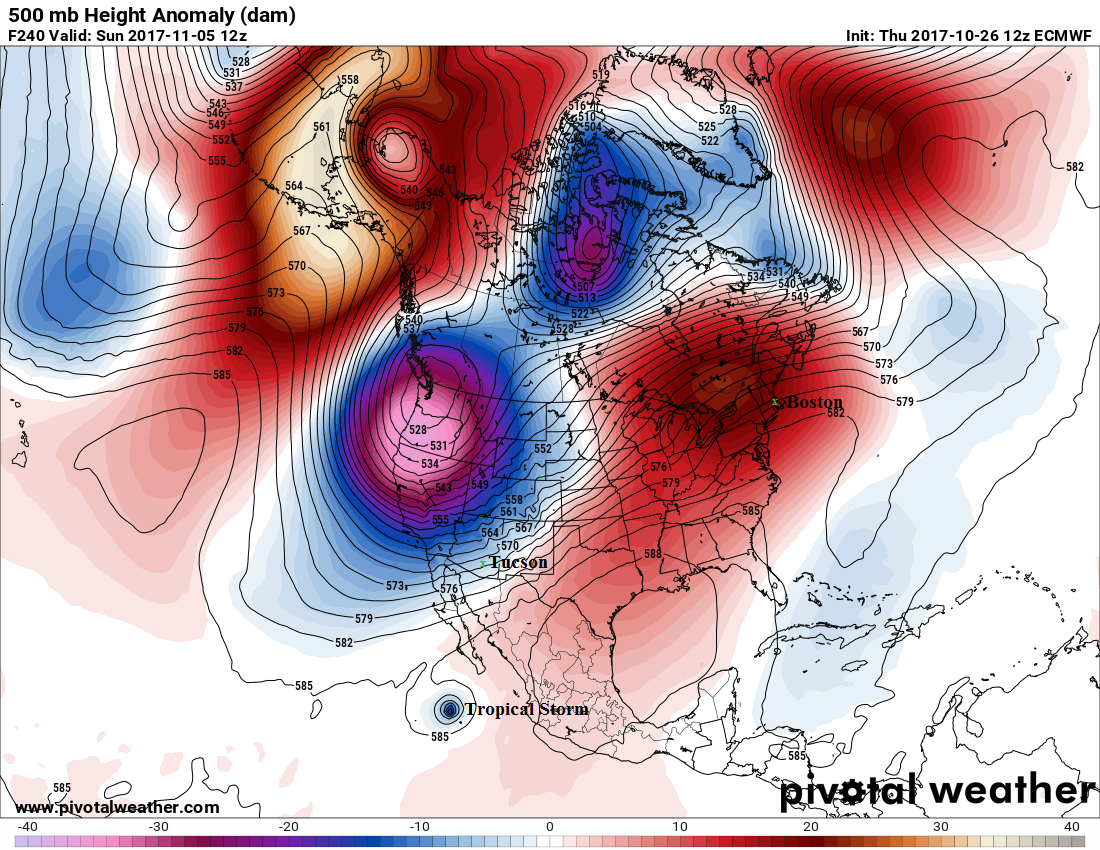
Valid 12Z November 5
[Use for paragraph 3, section 2a]
[Use for table 3, section 2b]
True (Actual) 500 mb Maps (Use to judge corresponding forecast)
[Use for paragraph 1, section 2c]
[Use for table 4, section 2d]
(compare with corresponding forecast in table above)]
[Use for paragraph 2, section 2c]
[Use for table 5, section 2d]
(compare with corresponding forecast in table above)]
[Use for paragraph 3, section 2c]
[Use for table 6, section 2d]
(compare with corresponding forecast in table above)]
