![]()
![]()
![]()
![]()
In the broad belt around the earth known as the tropics -- the region within 23½° latitude north and south of the equator -- the weather is much different from the middle latitudes. The noon sun is always high in the sky and seasonal changes in temperature are small compared with the more drastic seasonal changes at higher latitudes. The daily heating of the surface and high humidity favor the development of cumulus clouds and thunderstorms. Frequent showers and non-violent thunderstorms often accompanied with heavy rainfall are typical for tropical regions. Intense and well organized storm systems are relatively rare.
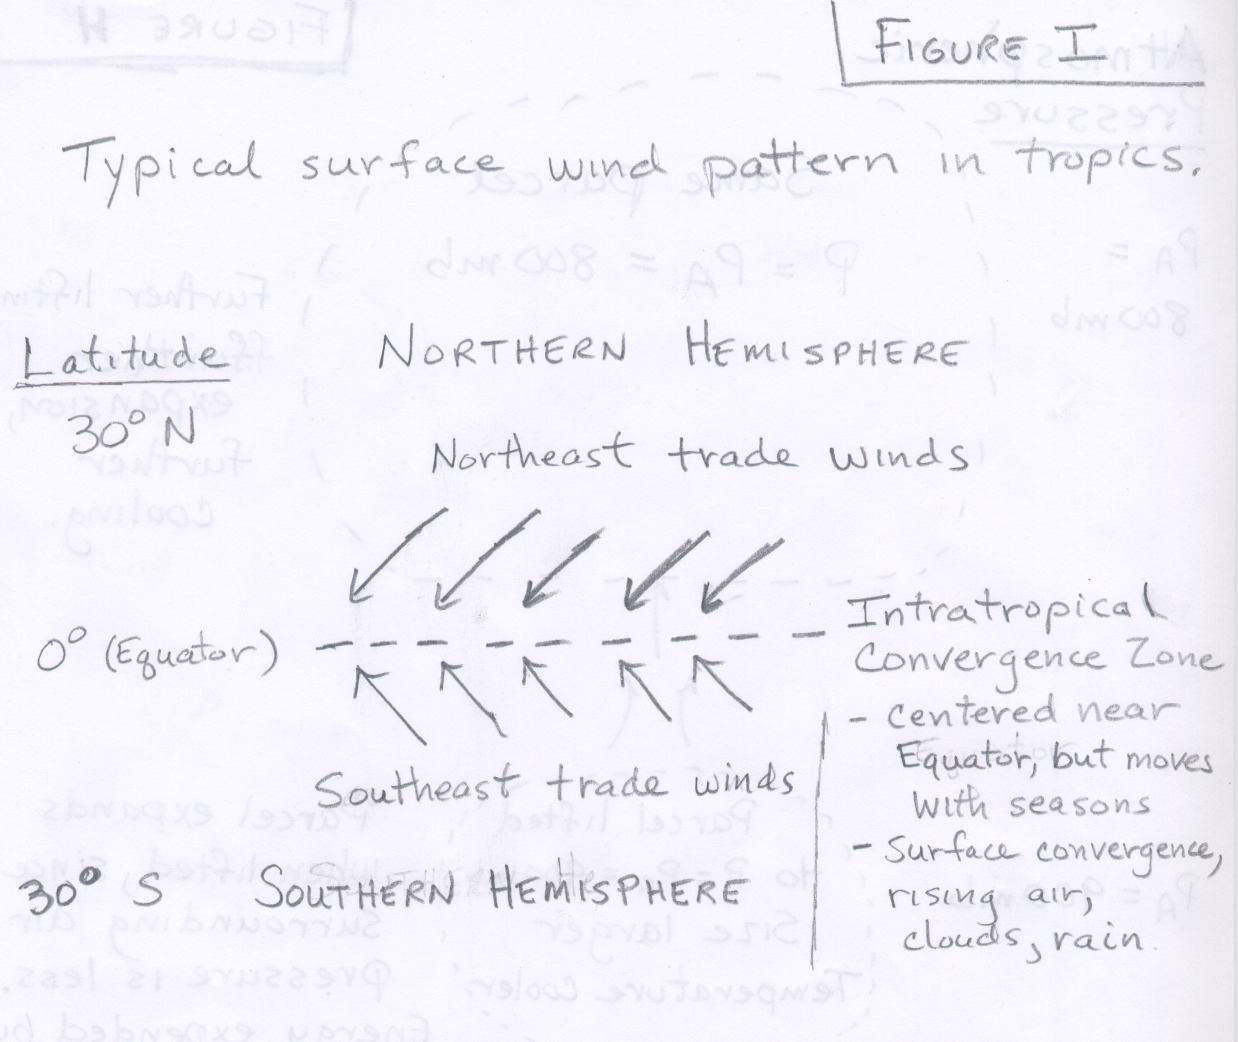
Surface winds in the tropics generally blow from the east -- northeast (in the northern hemisphere), or southeast (in the southern hemisphere) -- these reliable and steady winds are called the trade winds. Between these two winds flows is an area of convergence known as the intratropical convergence zone (ITCZ) (See Figure I). You may also wish to look over the Wikipedia page on the Intratropical Convergence Zone. The corresponding pattern of surface pressure is to have a line of lower pressure along the intratropical convergence zone and lines of higher pressure to the north and south of the ITCZ. You should be able to convince yourself that this pressure pattern at the surface would result in the northeast and southeast trade winds using the simple rules for determining the surface wind direction based on the surface pressure pattern. You need to remember that the Coriolis Effect will turn the wind direction to the right of the pressure gradient in the northern hemisphere and to the left of the pressure gradient in the southern hemisphere.
This band of surface convergence, forced rising air, and clouds is easily seen on satellite imagery and is a prominent part of the climate of Earth. Let's take some time to try to look over a few satellite composite images and movies of the Earth to identify some of the major features of weather patterns around the globe. Click on this link to satellite composite imagery, which will open in another browser window or tab and read the instructions that follow. A composite image of the globe is done by stitching together (or compositing) simultaneous views from several satellites, since any one of them can only view a small portion of the Earth at one time. There are many interesting images and movies available from the University of Wisconsin's satellite imagery page. For this discussion, take a look at either the "Global Montage" two week movie or the "Infrared Global Composite Quicktime Movie." After loading the movie, you can pause it and use the slider at the bottom of the image to move more slowly through the frames. The time each image was taken in GMT is given below the image. Notice the semi-continuous band of clouds that extends across the globe near the Equator. This is the Intratropical Convergence Zone. Also notice that cloud systems at low latitudes (close to the Equator) generally move from east toward west. There may even be some active tropical storms in the two week loop depending on when you look. Now look at the motion of cloud systems at higher latitudes in both the northern and southern hemisphere. These cloud systems generally move from west to east and commonly rotate or swirl. At higher latitudes the steering level winds (around 500 mb) are generally west toward east, while in the tropics these winds are generally east toward west. The movement of tropical storms is further described on the next reading page. We will discuss the movement of higher latitude storm systems later in the semester.
Occasionally, a large undulation or ripple in the normal trade wind pattern will develop and move slowly from east toward west. These disturbances in the flow are called tropical waves, or easterly waves. Because variaions of surface air pressure in the tropics are so slight compared with the middle latitudes, tropical waves are best shown by plotting steamlines of the wind patterns (rather than isobars) as shown in this example wind pattern near tropical waves. The example also indicates where areas of surface convergence (which forces rising motion resulting in the development of clouds and rain) and surface divergence (which forces sinking motion resulting in mainly clear skies) occur relative to the position of the easterly wave. Click on the "Overlay" button above the image to see the corresponding satellite image of cloud cover. The typical westward movement of a tropical easterly wave is shown in this animation of a tropical wave moving across the Caribbean. Although the majority of tropical waves die out before becoming major systems, if conditons are favorable, tropical waves can intensify, develop a central low pressure region around which the winds rotate, and grow into hurricanes. In fact, most severe hurricanes that affect the United States begin as easterly waves, which move off the continent of Africa. More information and a diagram can be found in this African Easterly Wave Link (Click on the image to zoom). Usually these easterly waves are relatively weak until they move into the warmer waters in the western Atlantic, Caribbean, and Gulf of Mexico.
During the summer monsoon season in Arizona, remnants of tropical easterly waves sometimes move from the Gulf of Mexico westward across northern Mexico and even southern Arizona. These waves often act to enhance rainfall in Arizona.
Although most of the severe hurricanes that affect the United States begin as easterly waves that move off Africa and across the Atlantic, there have been many cases where hurricanes initially formed much closer to the United States -- in the Carribean and Gulf of Mexico. In those cases it often appears that a region of surface convergence or upper-level divergence with an associated area of disorganized thunderstorms eventually develops rotation and strengthens.
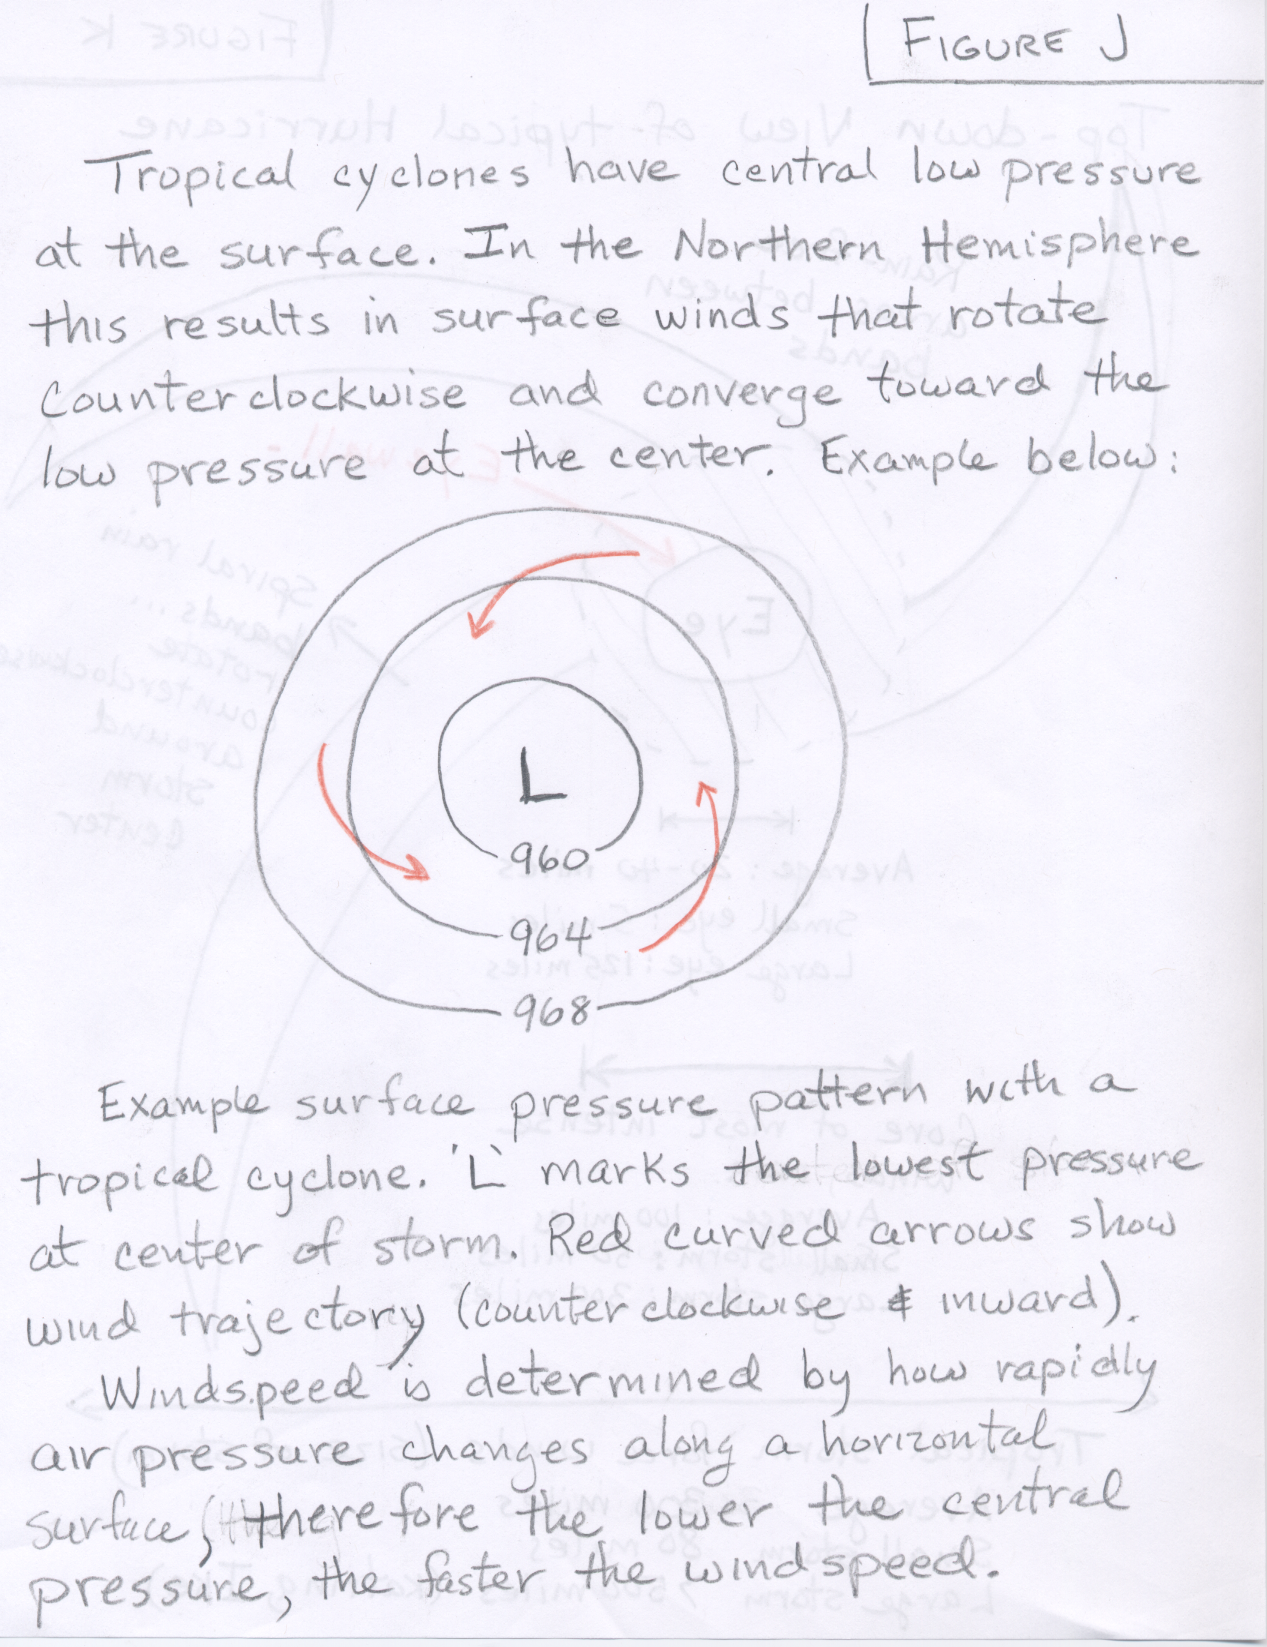
Tropical cyclone is the generic name given to a surface low pressure system over tropical waters, with organized convection (i.e., thunderstorm activity) and a definite cyclonic (or counter-clockwise) surface wind pattern (See Figure J). Here again is the surface weather map showing Hurricane Katrina in August 2005. Recall from the previous reading pages that the ground surface winds around a circular area of lower pressure (in the Northern Hemisphere) are mostly counterclockwise, but also inward. The speed of the wind depends on how rapidly air pressure increases in moving out from the low pressure center. As described in Figure J, the speed of the wind and strength of the storm depends on how low the central pressure gets. Remember that the average sea level pressure is about 1000 mb (1013.25 mb to be exact), and somewhere outside the storm, the pressure will have to return to average, thus the lower the central pressure of the storm, the stronger the pressure gradient, the stronger the winds and the stronger the storm. As a tropical cyclone intensifies, it is classified according to wind speed.
(*)Hurricane is the term used in the north Atlantic Ocean and the north and south Pacific oceans east of the dateline. These storms are given different names in other ocean basins:
Tropical storms and hurricanes are the only natural disasters which have their own names (e.g., Andrew, Camille, Hugo, the 2004 Florida hurricanes, Charles, Frances, Ivan, and Jeanne, the damaging 2005 hurricanes, Dennis, Katrina, Rita, and Wilma, and in 2008 Gustov and Ike). Names seem appropriate because we commonly come to know hurricanes long before they strike land, often watching these storms move across the oceans for days or even weeks. By contrast isolated severe thunderstorms and tornadoes develop suddenly and last only hours. Hurricanes are much larger than an individual severe thunderstorm cell and are more correctly described as being composed of an organized clustering of thunderstorms. They are quite powerful and release great amounts of energy (mostly in the form of latent heat released by the condensation of water in cloud formation). In fact the energy released by a single, strong hurricane can be greater than the total annual energy consumption of the United States and Canada combined.
The hurricane season in the North Atlantic Ocean officially runs from June 1 through November 30, although tropical storms in the North Atlantic sometimes develop outside of this period. Each year a new list of names is used for the storms that reach tropical storm strength. The first storm is given a name that begins with 'A', the second begins with 'B', and so forth. Not all letters are used. Each year a list of 21 names is used to name the storms in the order that they form (List of Tropical Storm names for the North Atlantic Ocean). The US started using names back in 1953. At first all storms were given female names. Beginning in 1979, traditionally male and female names have been alternated.
Surface atmospheric pressure in the center of a hurricane tends to be extremely low. The lowest pressure reading ever recorded for a hurricane was Super Typhoon Tip in 1979, which had a central pressure of 870 millibars (mb). The average sea level pressure at the center of storms that reach hurricane strength is near 960 mb. Wind speed in a hurricane is highly related to the surface pressure of the storm, since the windspeed is determined by the pressure gradient or the change in air pressure divided by the distance over which the pressure change happens. The average sea level air pressure on Earth is 1013.25 mb. The the pressure gradient (and hence windspeed) depends on the difference in pressure between the lowest pressure in the center of the storm and the pressure outside the storm (average 1013 mb) divided by the distance over which the pressure change happens. In general, the lower the central pressure, the higher the windspeeds generated. In fact hurricanes are classified by either windspeed or the central pressure (with lower pressure being more intense). See this link to Saffir-Simpson Hurricane Classification Table to see the criteria for Category 1 through Category 5 Hurricanes, which can be defined by either central pressure or windspeed. Hurricanes that reach category 3, 4, or 5 strength are called major hurricanes. The graph below shows the relationship between surface pressure and sustained wind speed for a number of tropical low pressure systems. This is a rather old figure and does not contain data from hurricanes after 1990.
 |
| Relationship between surface pressure and wind speed for a number of tropical low pressure systems. Tropical low pressure systems are classified as hurricanes when their pressure is 980 millibars or lower, and sustained wind speeds are greater than 118 kilometers per hour (74 mph). |
For historical perspective, the table below shows that infamous hurricane Katrina was the sixth strongest hurricane ever located in the north Atlantic Ocean and the third strongest to hit the United States at the time of landfall in terms of its central pressure (at least since reliable meterological measurements have been available). Students in this course will not be expected to know the information provided in these tables.
| Top six most intense Atlantic hurricanes since measurements began Hurricane intensity is measured solely by central pressure, i source:NOAA |
|||||||
|---|---|---|---|---|---|---|---|
| North Atlantic | Landfall U.S. | ||||||
| Rank | Hurricane | Year | Pressure | Rank | Hurricane | Year | Pressure |
| 1 | Wilma | 2005 | 882 mbar | 1 | "Labor Day" | 1935 | 892 mbar |
| 2 | Gilbert | 1988 | 888 mbar | 2 | Camille | 1969 | 909 mbar |
| 3 | "Labor Day" | 1935 | 892 mbar | 3 | Katrina | 2005 | 920 mbar |
| 4 | Rita | 2005 | 897 mbar | 4 | Andrew | 1992 | 922 mbar |
| 5 | Allen | 1980 | 899 mbar | 5 | "Indianola" | 1886 | 925 mbar |
| 6 | Katrina | 2005 | 902 mbar | 6 | "Florida Keys" | 1919 | 927 mbar |
| Based on data from: The Weather Channel | Based on data from: National Hurricane Center | ||||||
If you are interested, please see the following link for more information on historic Atlantic Hurricanes.
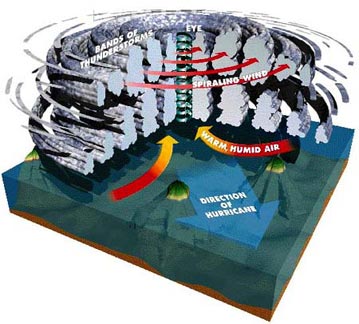
A hurricane is an intense storm of tropical origin, with sustained winds exceeding 64 knots (74 mi/hr). Below is a photo of Hurricane Elena. The storm is approximately 500 km (310 mi) in diameter, which is about average for hurricanes. The area of clear skies (with perhaps scattered clouds) in the center is its eye. Elena's eye is almost 40 km (25 mi) wide. Within the eye, winds are light and skies are mostly clear of clouds. The surface pressure is very low, nearly 955 mb. Notice that the clouds align themselves into spiraling bands (called spiral rain bands) that swirl in toward the storm's center, where they wrap themselves around the eye. Surface winds increase in speed as they blow counterclockwise and inward toward this center.
 |
 |
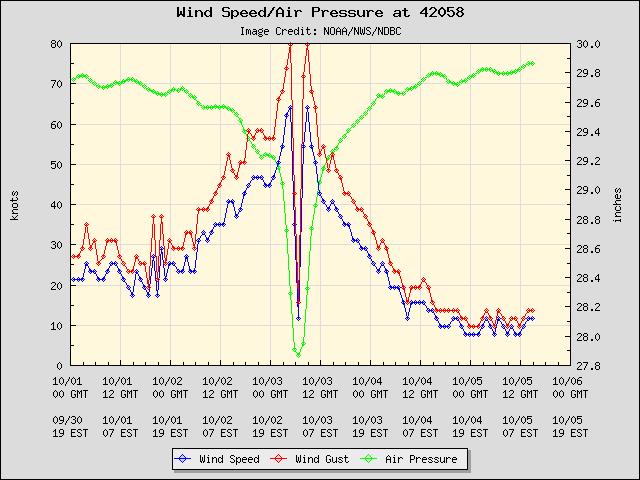 |
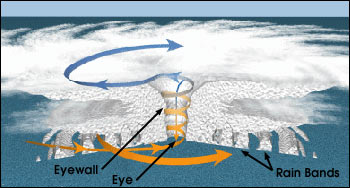
| Hurricane Elena as photographed from the space shuttle Discovery during September, 1985. | Structure of a Hurricane | Wind and Pressure measured by an automated buoy as the eye of Hurricane Matthew passes over in 2016. |
Adjacent to the eye is the eye wall, a ring of intense thunderstorms that whirl around the storm's center and extend upward to almost 15 km (49,000 ft) above sea level. Notice that the cloud tops in the eye wall region extend above the other clouds. Within the eye wall we find the heaviest precipitation and the strongest winds. Please take a look at Figure K, which shows a top-down view of a typical hurricane. While Figure K provides numbers for the average size of a tropical storm, you should realize that storm size can vary quite alot. The size of a tropical system can be defined as the area over which tropical force winds or stronger are observed. Obviously, the larger the storm, the greater potential damage it may cause. Both the maximum wind strength and the size of the wind field are important. Super Typhoon Tip is the largest storm ever recorded, with tropical force winds 2100 km (1300 miles) in diameter around the center of the storm. Please look at this picture comparing the sizes of the very large Typhoon Tip, a category 5 hurricane, to much smaller Tropical Cyclone Tracy, a category 4 hurricane that devasted parts of northern Australia in 1974. Indian Ocean storms are called tropical cyclones, instead of hurricanes or typhoons.
All strong tropical cyclones consist of the following components:
You should be familar with the basic anatomy of a hurricane, as most hurricanes have the features mentioned above. It is beyond the scope of this course to explain and understand why these storms organize themselves in this manner. For example, you should know that the eye is an area of calm winds and low surface pressure with sinking air and generally fair skies, but the reason for this has not been explained.
The formation of tropical cyclones is still a topic of intense research and is not fully understood, although research has shown that certain factors must be present for cyclones to intensify to hurricane strength. Hurricanes form over tropical waters where the winds are initially light, the humidity is high in a deep layer, and the surface water temperature is warm, typically 26.5°C (80°F) or greater, over a vast area. Moreover, the warm surface water must extend downward to a depth about 200 ft (60 m) before hurricane formation is possible.
Hurricanes are powered by the latent heat energy released from condensation. Latent heat is the energy that is released when the gas form of water, water vapor, condenses into liquid during cloud formation in places where the air is forced to move upward. To form and develop hurricanes must be supplied with a constant supply of warm humid air for this process. Surface air with enough energy to generate a hurricane only exists over oceans with a temperature greater than 26.5°C. Moreover, the atmosphere above a developing storm must be unstable, i.e., the temperature must decrease rapidly with increasing altitude. This is condusive to thunderstorm formation in general. You are not expected to understand the concepts of latent heat release when water vapor (gaseous form of water) condenses into liquid droplets forming clouds or what is meant by an unstable atmosphere. We will cover those topics later in the semester.
Hurricanes cannot develop on or very near the Equator. In fact they do not form in the region within 4° latitude either side of the equator. Within this region Coriolis force is negligible. Coriolis force is required for the initiation of rotation. In fact it is relatively rare for hurricanes to form within 10° of latitude from the Equator.
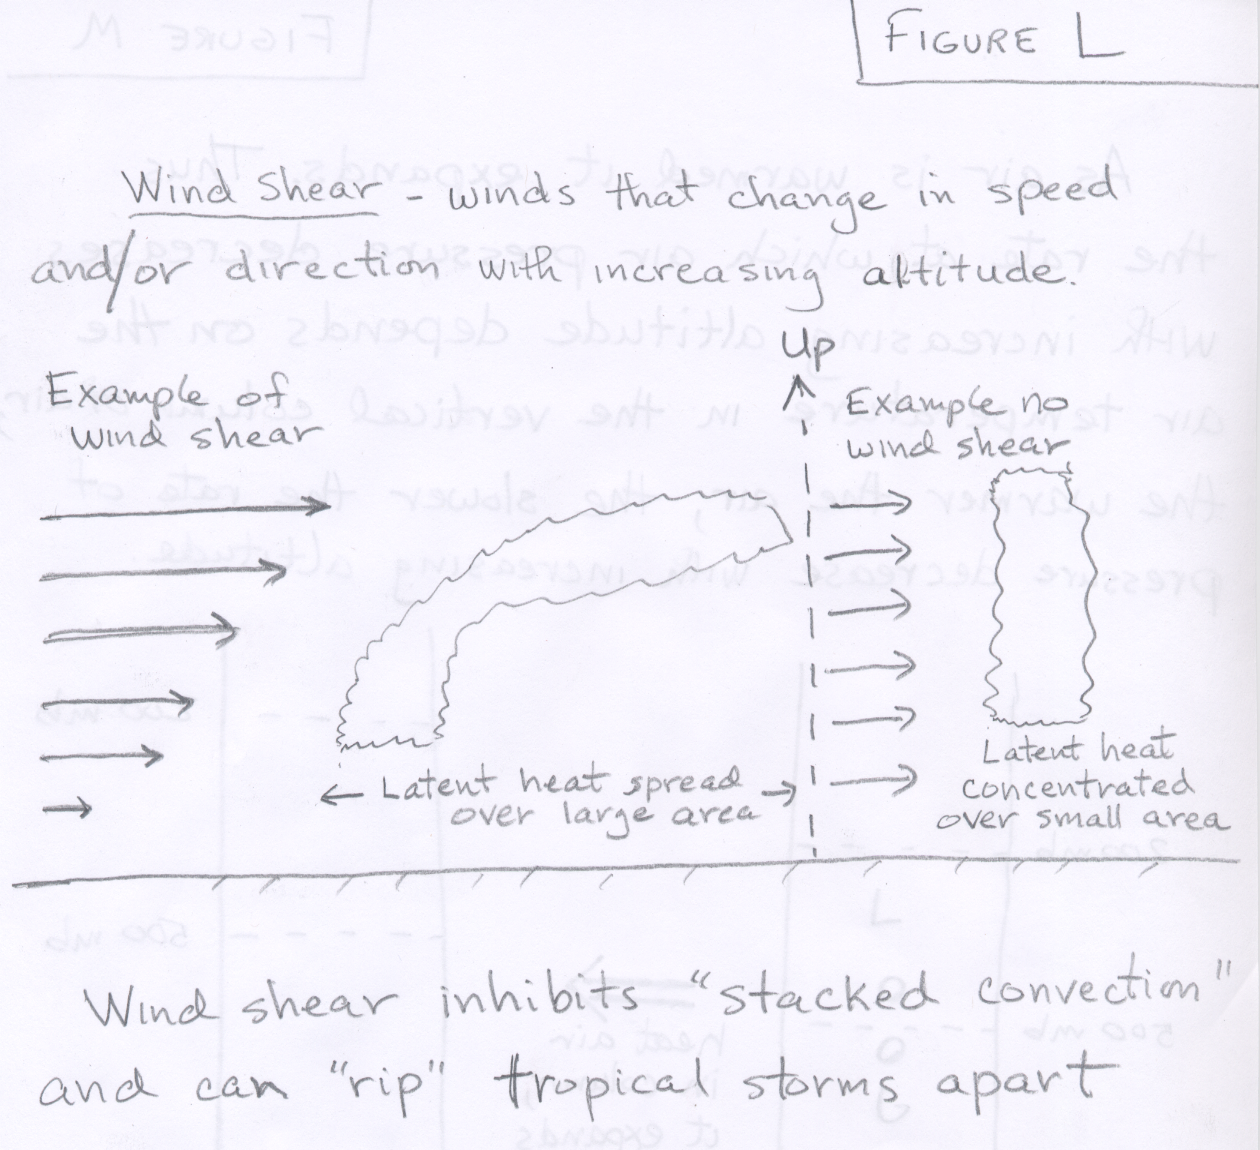
Finally, hurricanes will not form if there is significant wind shear, which is a change in wind velocity and/or direction with increasing altitude. The concept of vertical wind shear is better explained in the summary section below.
Hurricanes grow stronger when there is more air exiting from the top of the storm (the divergent outflow at the top of the storm) than surface air moving in toward the center (inflow above the ocean surface at bottom of storm), since this causes the sea level air pressure to lower. The strengthening is driven by the release of latent heat within the storm during the formation of clouds by condensation of water vapor. This will covered more fully later in the semester. They dissipate rapidly when they move over colder water or over a large landmass as these conditions cut-off the supply of warm, humid air. Hurricanes will also weaken if they move into an area that has strong vertical wind shear.
Below is a summary list of five requirements for tropical storm development and intensification.
We will describe the energetics of hurricane formation later in the semester. As mentioned above the main energy source is the release of energy that occurs when water vapor (gaseous form of water) condenses to liquid water droplets during cloud formation.
The figure below shows a more realistic look at anatomy of a hurricane. As opposed to the simple explanation of a surface low pressure center with a single region of rising motion above the low, real hurricanes have banded structures of rising and sinking motion. In fact there is an area of sinking air motion in the eye at the center of strong hurricanes. Explanation of these details is beyond the scope of this course.
 |
![]()
![]()
![]()
![]()