Brandi Carlile: "It's Over"
(3:58), "Things I
regret" (3:36), "Losing Heart"
(3:35), "Downpour"
(3:33), "Mainstream
Kid" (4:25)
The Practice Quiz has been graded, the average for this class
was 72%. As you can see from the chart below that is better
than all of the classes from the past few semesters.
Semester
|
8 am T
Th class
|
2 pm T
Th class
|
F16
|
72%
|
69%
|
Semester
|
11 am MWF class
|
1 pm MWF class
|
S16
|
68 %
|
61%
|
Semester
|
8 am T Th class
|
9:30 am T Th class
|
F15
|
61%
|
61%
|
S15
|
61%
|
61%
|
A new
In-class Optional Assignment was handed out in class.
It is due by the end of class on Thu., Sep. 15 (some of the
questions on the assignment deal with material that we will cover
in class on Thursday).
Here's a quick review of some of what we
covered last week
atmospheric
pressure at any level in the atmosphere
depends on (is determined by)
the weight
of the air overhead
Under normal conditions, at sea level, a 1" x 1" column of air
stretching from sea level to the top of the atmosphere would weigh
14.7 pounds. To determine the pressure you would need to
divide the 14.7 pounds by the 1 sq. in. area at the bottom of the
column.
Pounds per square inch, psi, are perfectly
good pressure units, but they aren't the ones that
meteorologists normally use.

Principle of the mercury barometer
(pps 27 & 28 in the ClassNotes for a little longer
version)
|
|
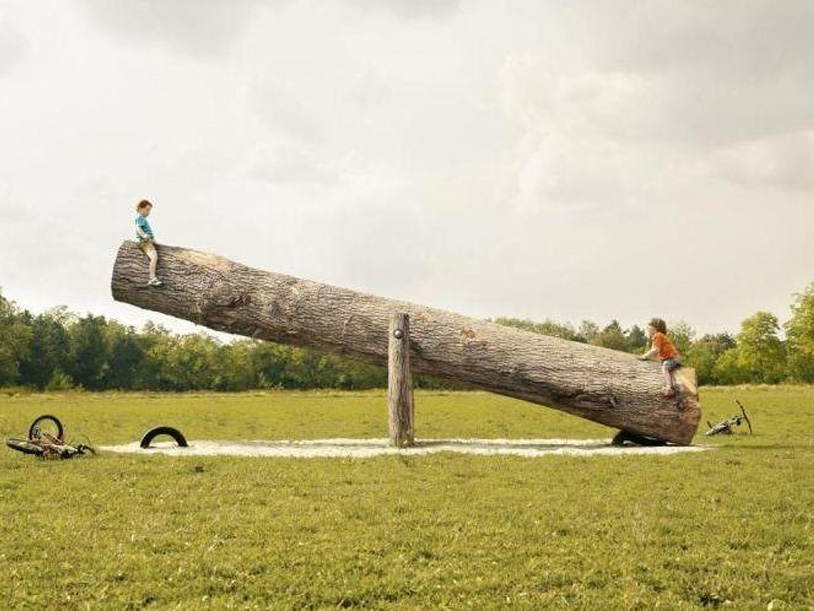
Easily the most
impressive seesaw (teeter totter) that I've ever
seen (source
of this image). If you
understand how this works you'll be able to
figure out how mercury barometers function.
|
A barometer is essentially a
balance.
The weight of the atmosphere is balanced by a mercury
column.
|
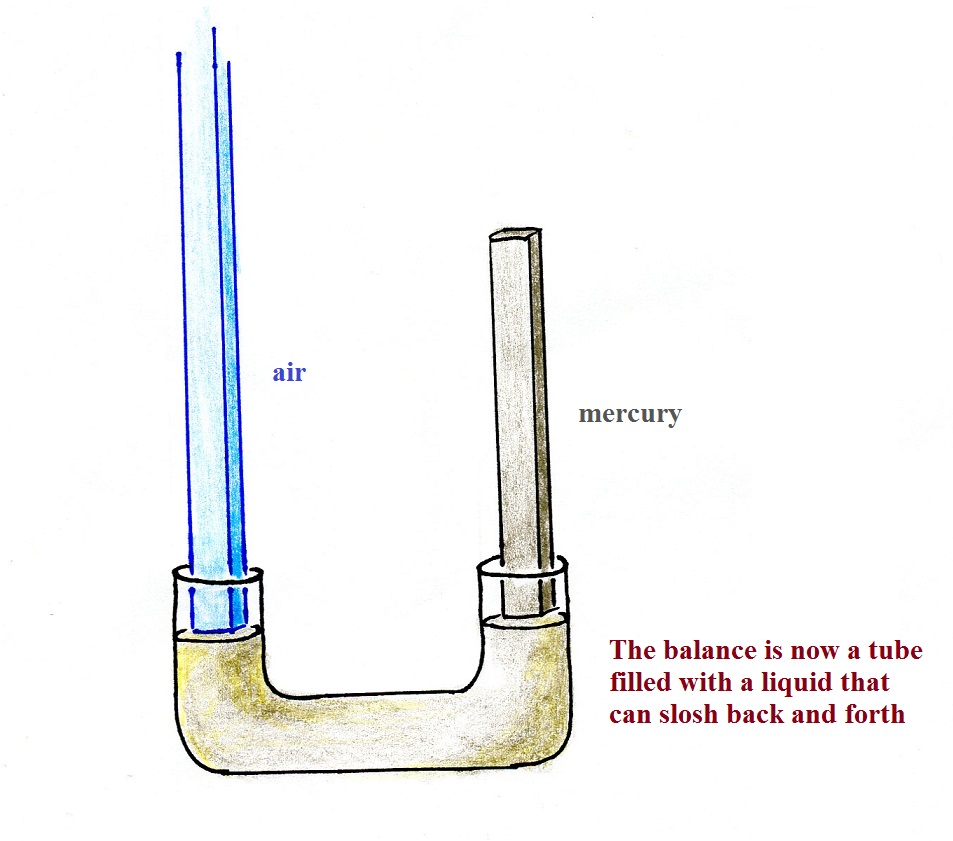
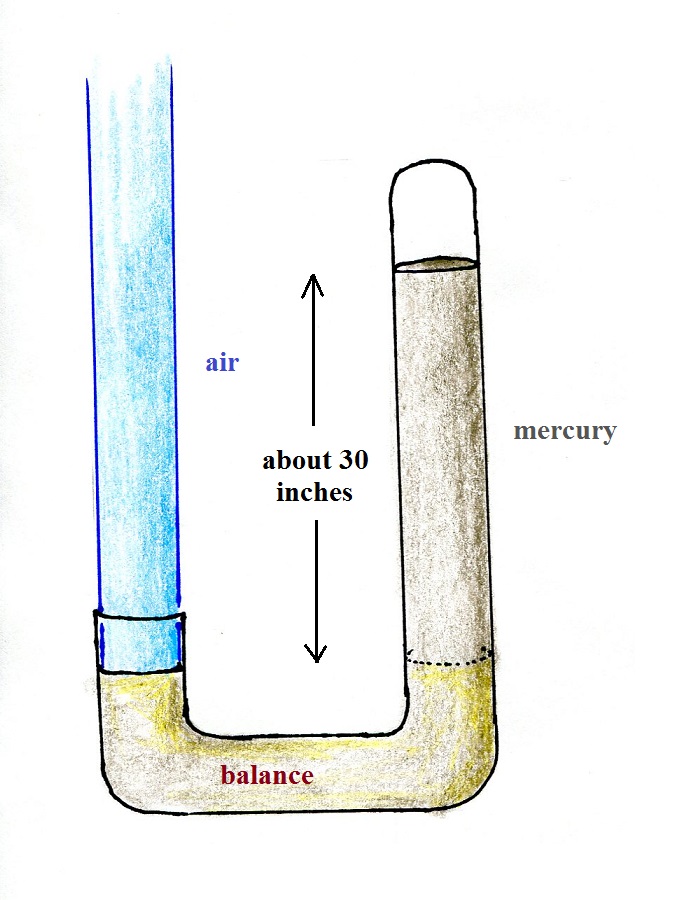
You can't use an ordinary
pan balance to weight the atmosphere(because air is
pushing down on both sides). A U-shaped tube
filled with some kind of liquid that can slosh back and forth
would work. Such an instrument is called a manometer and
is often filled with mercury.
|
|
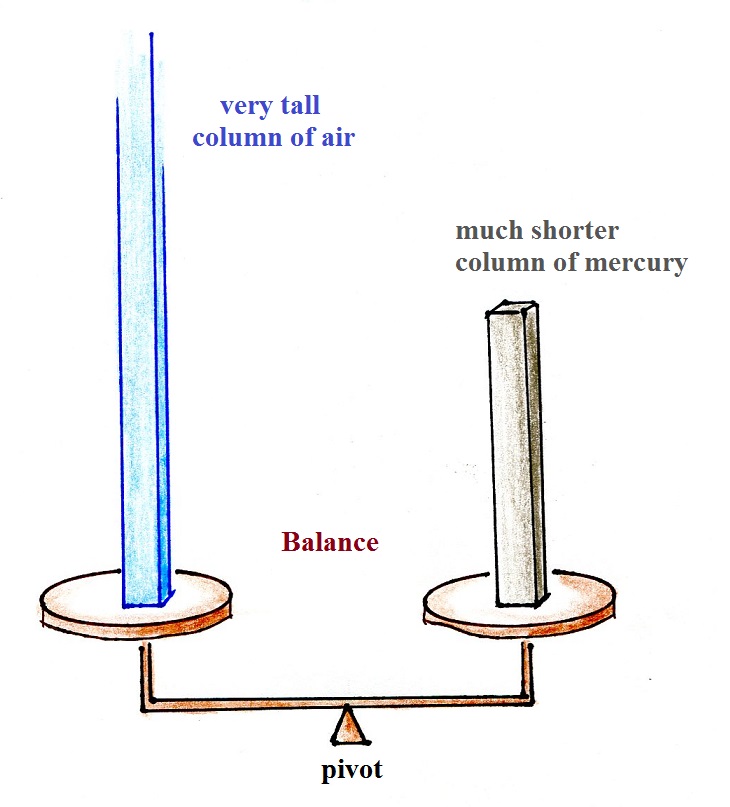
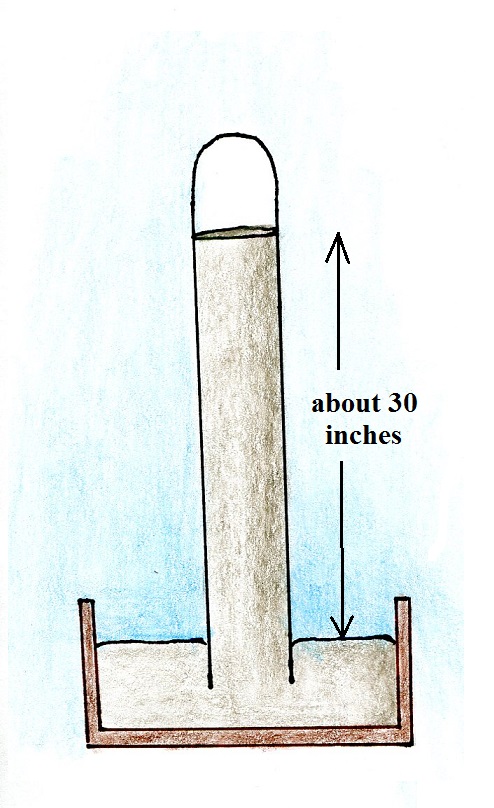
To turn the manometer into
a true barometer, we'll extend the tube on the right and close
the top so that air isn't pushing down on the mercury.
We'll also use somewhat larger cylindrical columns of air and
mercury that completely fill the insides of the tube.
The weight of a very tall cylindrical column of air is balanced
by a much shorter cylindrical column of mercury. The
height of the mercury column will change as air pressure varies.
Mercury is a liquid. You need a liquid that can slosh back
and forth in response to changes in air pressure. Mercury
is also very dense which means the barometer won't need to be as
tall as if you used something like water. A water
barometer would need to be over 30 feet tall.
With mercury you will need only a 30 inch tall column to
balance the weight of the atmosphere at sea level under normal
conditions (remember the 30 inches of mercury pressure units
mentioned earlier). Mercury also has a low rate of
evaporation so you don't have much mercury gas at the top of the
right tube (there's some gas, it doesn't produce much pressure,
but it would be hazardous you if you were to start to breath
it).
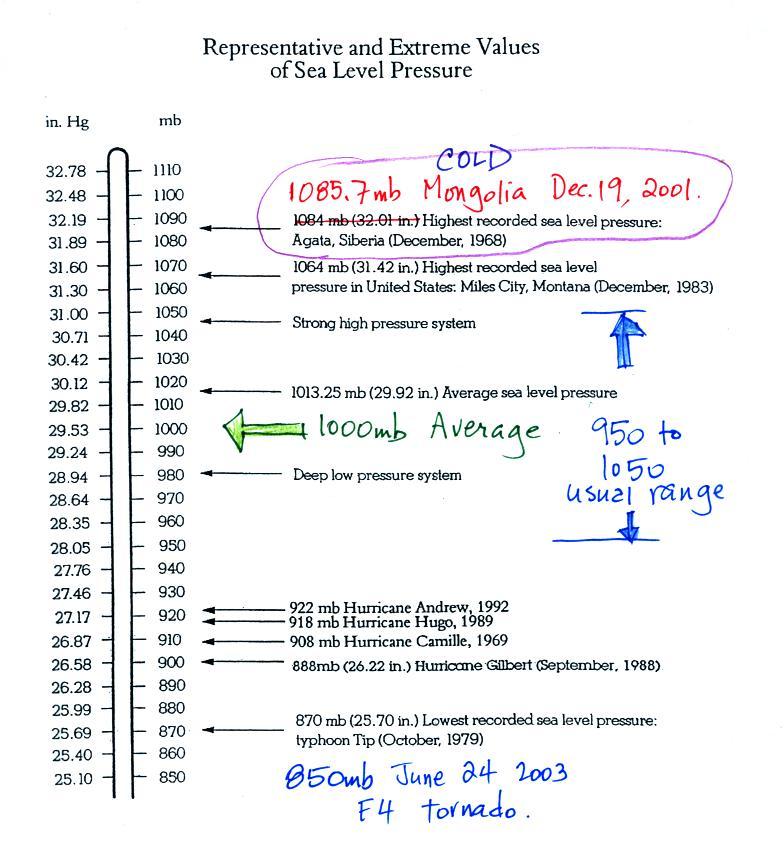
Average and extreme sea level pressure values
Average sea level atmospheric pressure is about 1000 mb. The
figure above (p. 30 in the photocopied Class Notes) gives 1013.25
mb but 1000 mb is close enough in this class. The actual
pressure can be higher or lower than this average value and
usually falls between 950 mb and 1050 mb.
The figure also includes record high and low pressure
values. Record high sea level pressure values occur
during cold weather. The TV weather
forecast will often associate hot weather with high
pressure. They are generally referring to upper level high
pressure (high pressure at some level above the ground) rather
than surface pressure. You'll sometimes here
this upper level high pressure referred to as a ridge, we'll learn
more about this later in the semester.
There is some question about the accuracy of the 1085.7 mb
value above. The problem is that the pressure was measured
at over 5000 feet altitude and a calculation was needed to figure
out what the pressure would have been if the location were at sea
level. That calculation can introduce uncertainty. But
you don't really need to be concerned with all that, I just wanted
to give you an idea of how high sea level pressure can get.
Most of the record low pressure values have all been set
by intense hurricanes.
Hurricane Wilma in 2005 set a new record low sea level pressure
reading for the Atlantic, 882 mb. Hurricane Katrina had a
pressure of 902 mb. The following table lists some of the
information on hurricane strength from p. 146a in the photocopied
ClassNotes. 2005 was a very unusual year, 3 of the 10
strongest N. Atlantic hurricanes ever occurred in 2005.
You may remember Hurricane Patricia off the west coast of
Mexico in fall 2015. Patricia set a new surface low pressure
record for the Western Hemisphere - 879 mb. Sustained winds
of 200 MPH were observed.
Most
Intense North Atlantic Hurricanes
|
Most
Intense Hurricanes
to hit the US Mainland
|
Wilma
(2005) 882 mb
Gilbert (1988) 888 mb
1935 Labor Day 892 mb
Rita (2005) 895 mb
Allen (1980) 899
Katrina (2005) 902
|
1935
Labor Day 892 mb
Camille (1969) 909 mb
Katrina (2005) 920 mb
Andrew (1992) 922 mb
1886 Indianola (Tx) 925 mb |
What makes hurricanes so intense is the pressure gradient, i.e.
how quickly pressure changes with distance (horizontal
distance). Pressure can drop from near average values (1000
mb) at the edges of the storm to the low values shown above at the
center of the storm. This large pressure gradient is what
causes the strong winds found in a hurricane.
The 850 mb pressure value measured in 2003 inside a strong tornado
in Manchester, South Dakota (F4 refers to the Fujita scale rating,
F5 is the highest level on the scale). This is very
difficult (and very dangerous) thing to try to do. Not only
must the instruments be built to survive a tornado but they must
also be placed on the ground ahead of an approaching tornado and
the tornado must then pass over the instruments (also the person
placing the instrument needs to get out of the way of the
approaching tornado).
You can experience much lower pressure values than shown
above (roughly 700 mb) by just driving up to Mt. Lemmon.
Very strong vertical changes in pressure are usually almost
balanced exactly by gravity.
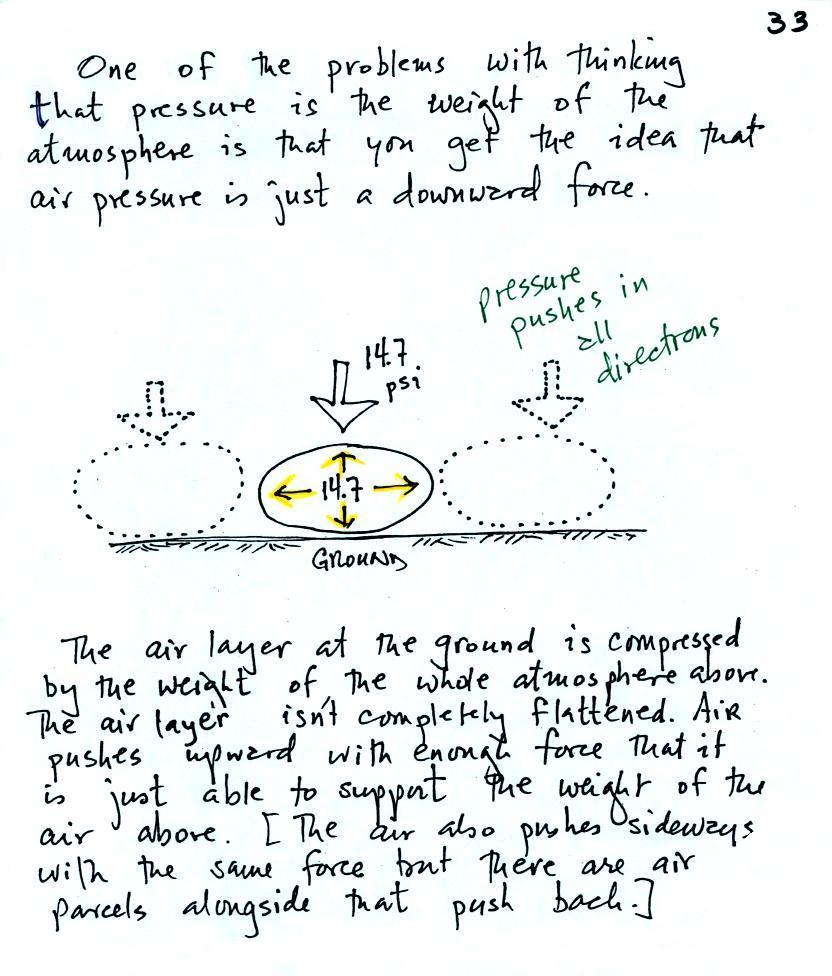
Air pressure pushes downward, upward and sideways
Air pressure is a force that pushes
downward, upward, and sideways. If you fill a balloon with
air and then push downward on it, you can feel the air in the
balloon pushing back (pushing upward). You'd see the air in
the balloon pushing sideways as well.
We were able to see this by placing a brick
on top of a balloon. The balloon gets squished (pushed out
sideways) but not flattened. It eventually pushes upward
with enough force to support the brick. The squished
balloon is what air at the bottom of the atmosphere looks
like. And it is supporting more than just one brick, it is
supporting a pile 90 to 100 bricks tall.
Another helpful representation
of air in the atmosphere might be a people pyramid.

The people in the figure are like layers of
air in the atmosphere all stacked on top of each other.
If the bottom person in the stack above were standing on a
scale, the scale would measure the total weight of all the
people in the pile. That's analogous to sea level
pressure being determined by the weight of the all the air
above.
The bottom person in the picture above must be
strong enough to support the weight of all the people
above. The bottom layer of the atmosphere pushes upward
with enough pressure to support the weight of the air above.
Here's another pretty amazing example of air pressure
pushing upward.
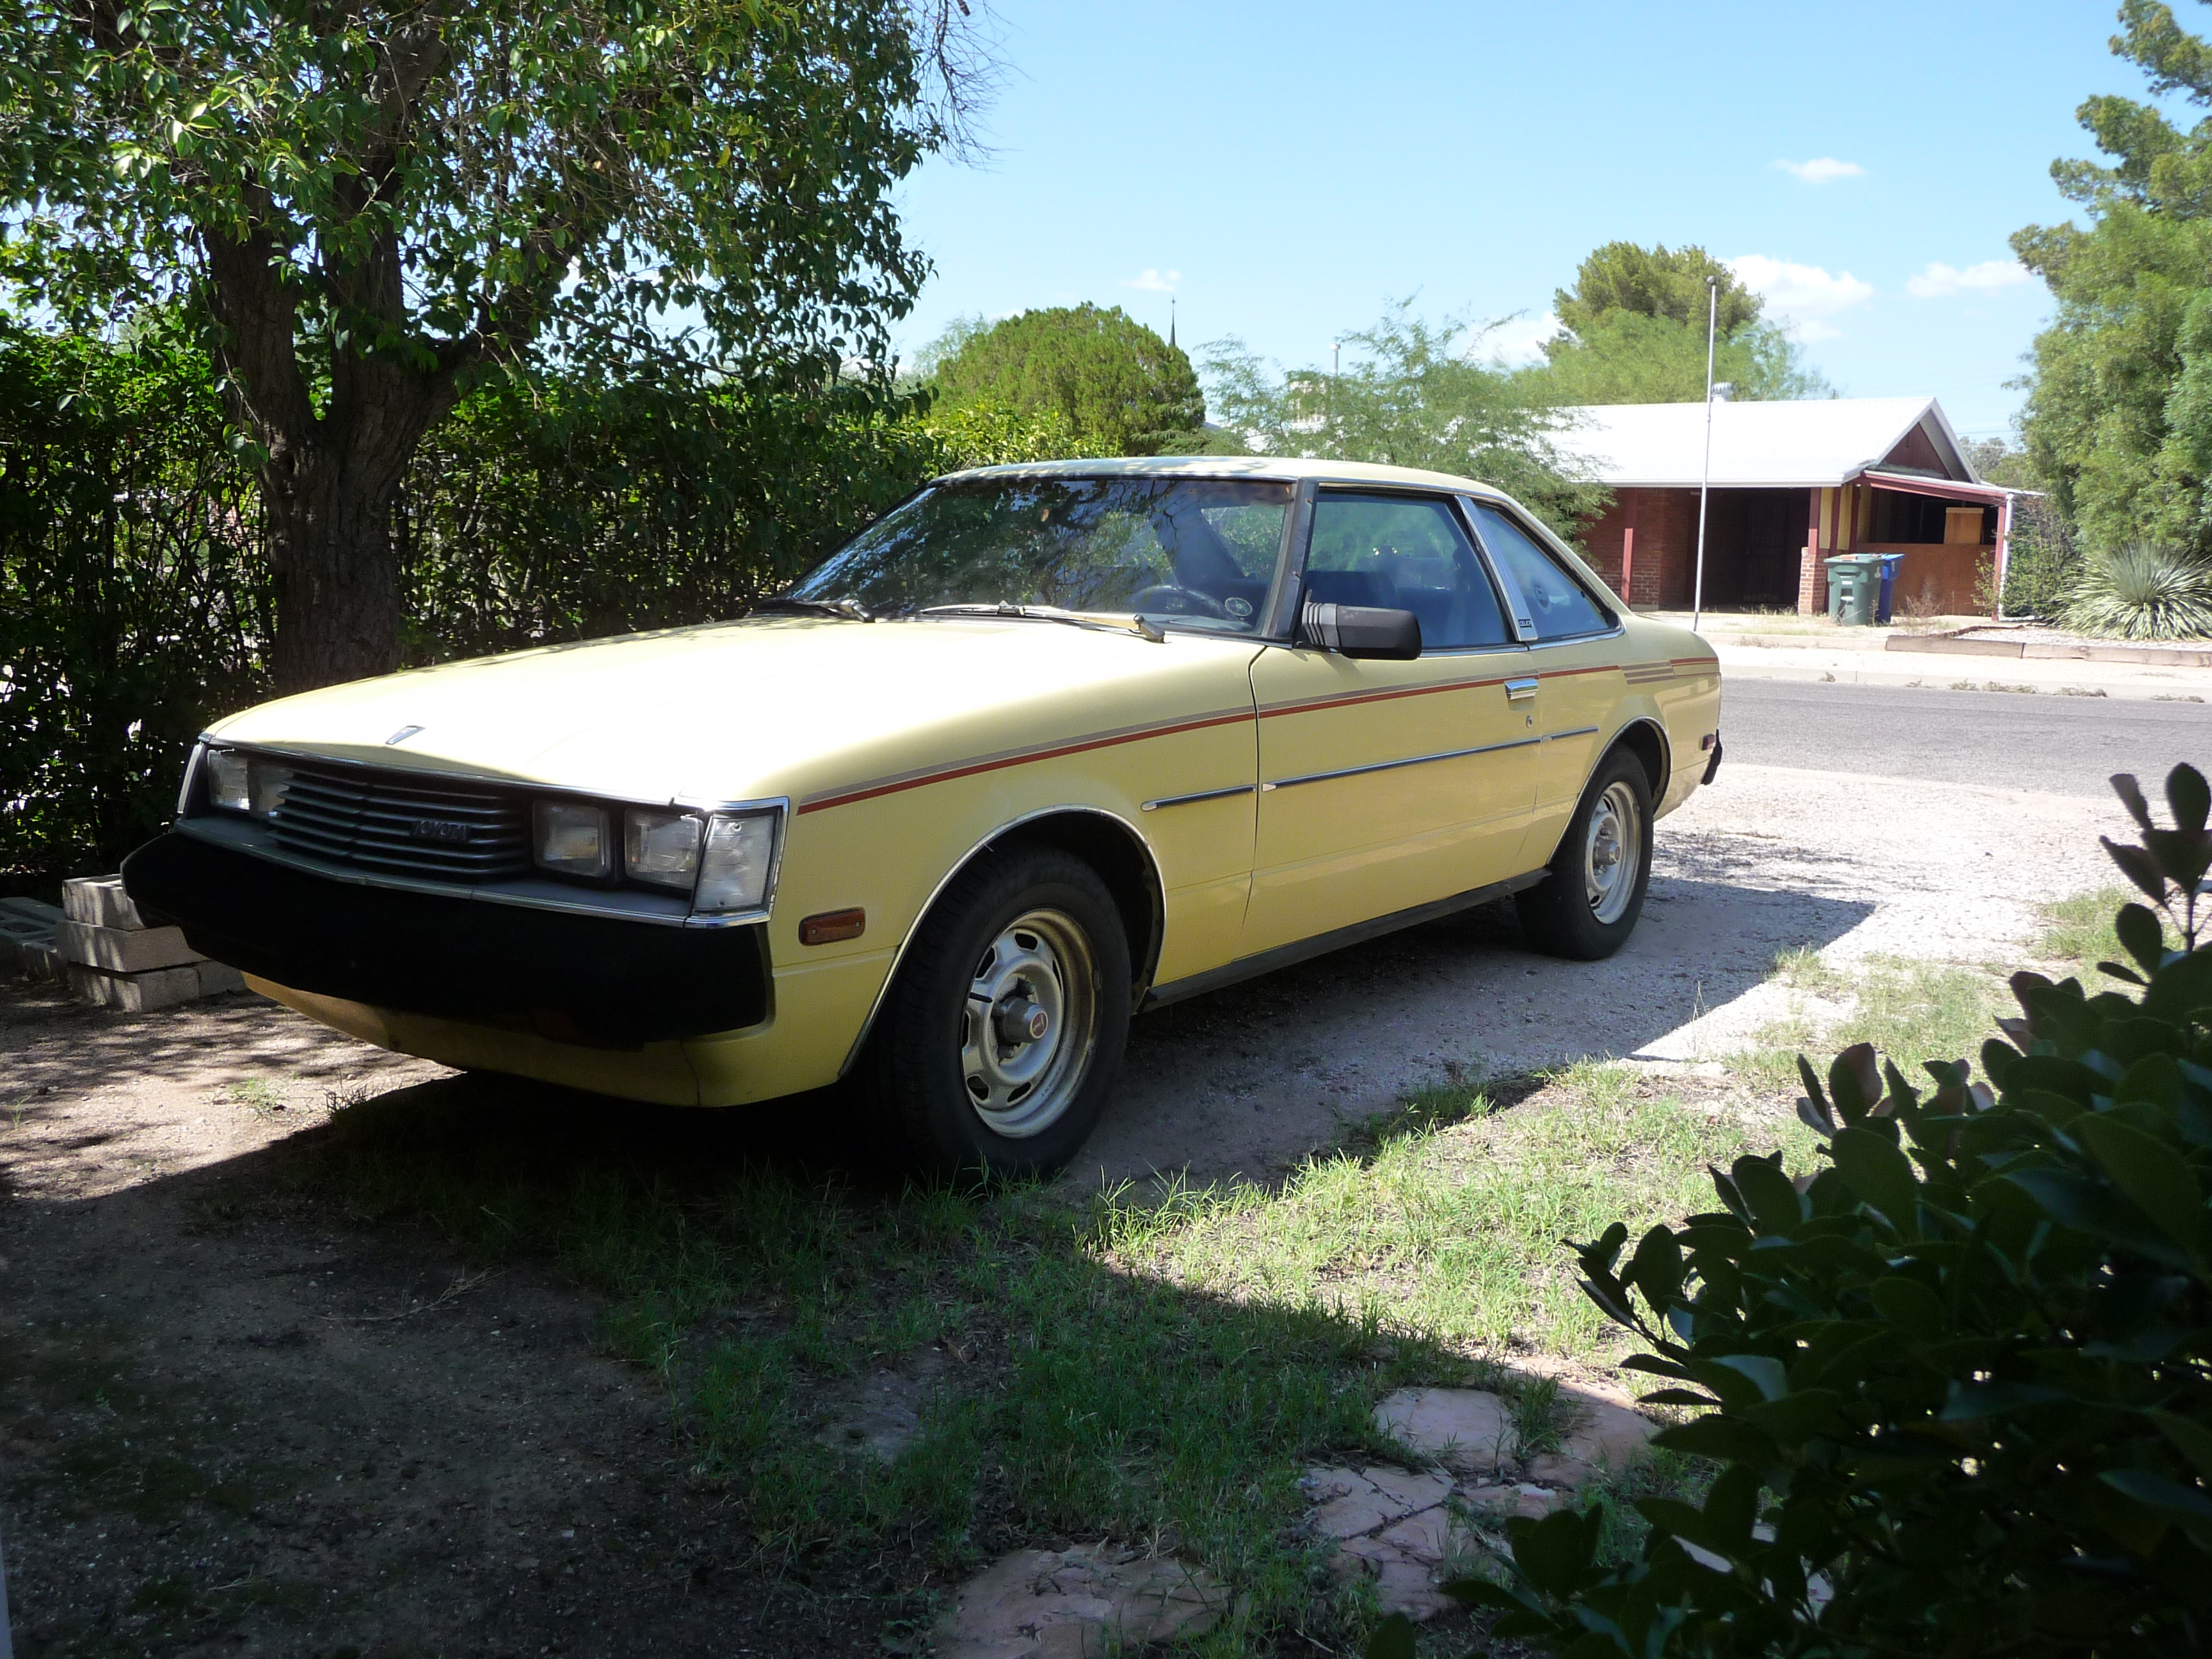
This is my present day car (a 1980 Toyota Celica) sits
on 4 tires, which are really nothing more than balloons. The
air pressure in the four tires pushes upward with enough
force to keep the 1000 or 2000 pound vehicle off the ground.
The air pressure also pushes downward, you'd feel it if the car
ran over your foot. The air also pushes sideways with a lot
of force; tires need to be strong to keep from exploding or coming
off the wheel.
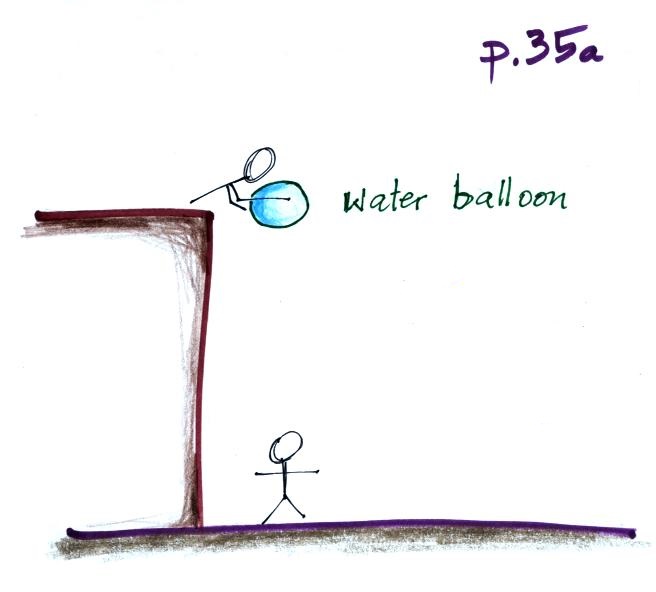
6. Upward Air Pressure force demonstration
This is a logical point to do a demonstration. A demo
that tries to prove that air pressure really does push upward as
well as downward. Not only that but that the upward force
is fairly strong. The demonstration is summarized on p.
35a in the ClassNotes.
It's pretty obvious that if you fill a balloon with a
little water and let go it will drop. And most everyone
in the class knows why (see below - I broken the figure on p.
35b into pieces for clarity).
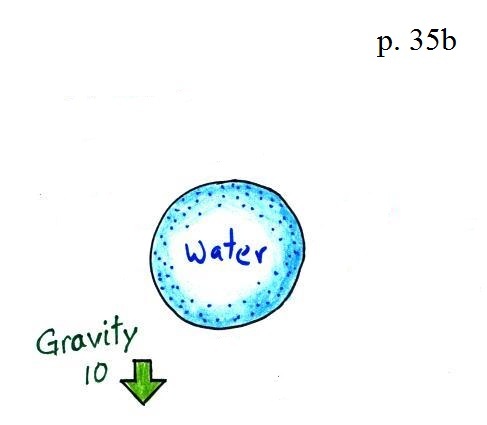
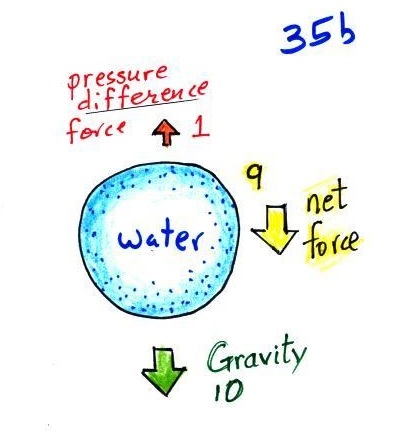
Gravity
exerts a downward force on the balloon. I just
made up a number, 10, to give you some idea of its
strength.
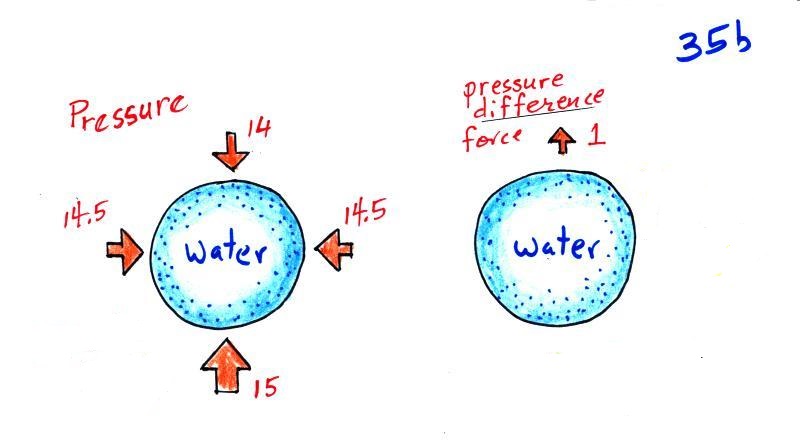
But the picture above isn't quite complete.
The water balloon is surrounded by air that is
pushing upward, downward, and sideways on the balloon.
These pressure forces
are strong but mostly cancel each other out. The
sideways forces do cancel out exactly.
The up and down forces aren't quite equal because pressure
decreases with increasing altitude. The upward
pointing force at the bottom is stronger (15 units) than the
downward force at the top (14 units). They don't
cancel and there is a weak upward
pressure difference force (1 unit
strong). I'm pretty sure that most people in the class
don't know about this pressure difference force.
This picture includes all
the forces (gravity and pressure difference).
The downward gravity force is stronger than the
upward pressure difference force and the balloon
falls.
It seems like we could change things a
little bit and somehow keep the upward and downward
pressure forces from working against each other. That's
what we do in the demonstration.
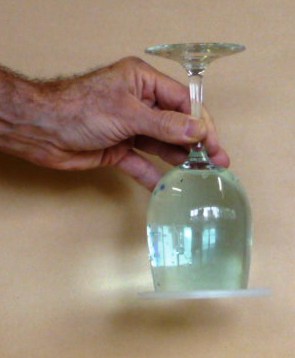
In
the demonstration a wine glass is filled
with water (about the same amount of water
that you might put in a small water
balloon).
A small plastic lid is used to cover the wine glass (you'll
need to look hard to see the lid in the photo above). The
wine glass is then turned upside and the water does not fall
out.
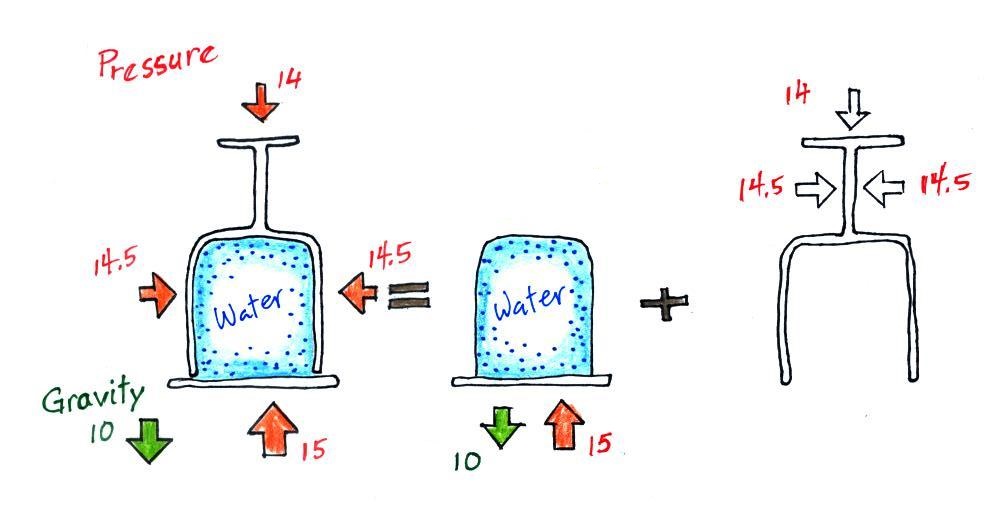
All the same forces are shown again in the left most
figure. We'll split that into two parts - a water and lid
part and an empty glass part.
The 14 units of pressure force is pushing on the glass now
and not the water. I was holding onto the glass, I'm the
one that balanced out this downward pressure force.
Gravity still pulls downward on the water with the same 10
units of force. But with 15 units, the upward pressure
force is able to overcome the downward pull of gravity. It
can do this because all 15 units are used to overcome gravity
and not to cancel out the downward pointing pressure
force.
The Magdeburg hemispheres
experiment (sideways pressure force)
Air pressure pushes downward with hundreds of pounds of force
on someone lying on the beach.
The pressure of the air in tires pushes
upward with enough force to keep a 1 ton automobile off the
ground.
What about the sideways air pressure
force?
Here's a description of a
demonstration that really needs to be done in Arizona Stadium
at half time during a football game. It involves
Magdeburg hemispheres and two teams of horses (the following
quote and the figure below are from an
article in Wikipedia):
" ... Magdeburg hemispheres are a
pair of large copper hemispheres with mating rims, used to
demonstrate the power of atmospheric pressure. When the rims
were sealed with grease and the air was pumped out, the sphere
contained a vacuum and could not be pulled apart by
teams of horses. The Magdeburg hemispheres were designed by a
German scientist and mayor of Magdeburg, Otto von Guericke in
1656 to demonstrate the air pump which he had invented, and
the concept of atmospheric pressure."
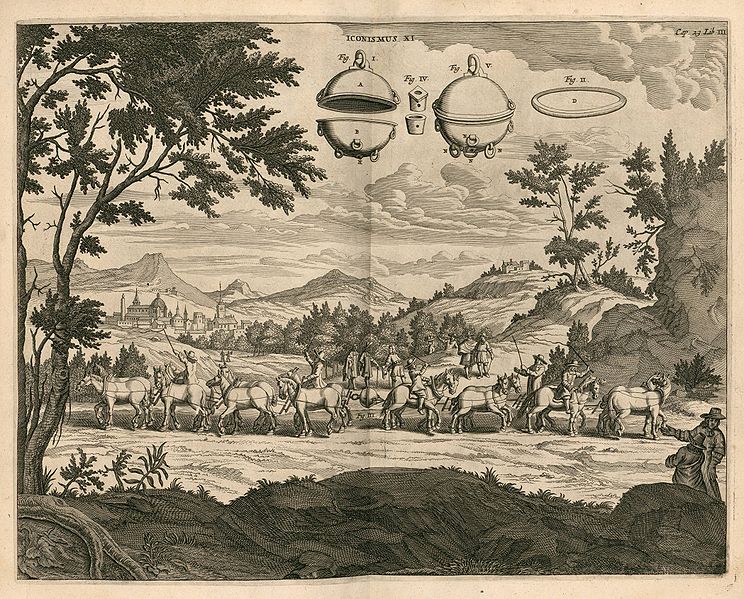
Gaspar Schott's sketch of Otto von
Guericke's Magdeburg hemispheres experiment (from the
Wikipedia article referenced above)
It is the pressure of the air pushing
inward against the outside surfaces of the hemispheres
that keeps them together. The hemispheres appear to
have had pretty large surface area. There would be
15 pounds of force pressing against every square inch (at
sea level) of the hemisphere which could easily have been
several thousand pounds of total force.
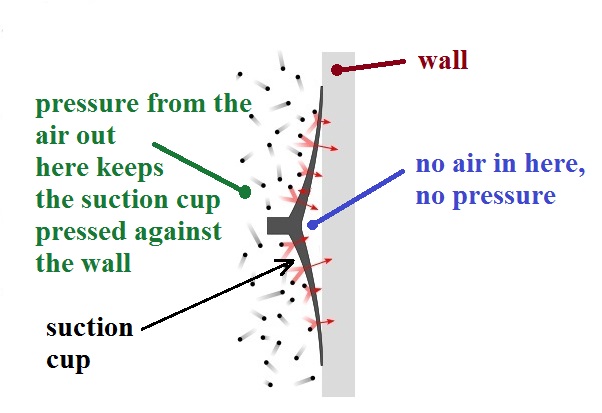
Suction cups work the same way
The suction cup has been pressed against smooth surface.
The cup is flexible and can be pulled away from the wall leaving
a small volume between the wall and the cup where there isn't
any air (a vacuum). There's no air pressure pushing
outward, away from the wall, in the space between the wall and
the suction cup. There's just pressure from the air
surrounding the suction cup that is pushing and holding it
against the wall.
I suspect that if I were to attach the suction cup I had in
class to a white board mounted to a wall and were to ask a
couple of strong people to come down and try to pull it off the
white board they would end up pulling the white board off the
wall. The Facilities Management people wouldn't appreciate
that very much.
Changes in air density with
altitude
(see p. 34 in the ClassNotes)
We've spent a lot of time (too much?)
looking at air pressure and how it changes with
altitude. Next we'll consider air density.
How does air density change with increasing
altitude? You should know the answer to that
question. You get out of breath more easily at high
altitude than at sea level. Air gets thinner (less
dense) at higher altitude. A lungful of air at high
altitude just doesn't contain as many oxygen molecules as it
does at lower altitude or at sea level.
It would be nice to also understand why air density
decreases with increasing altitude.
The people pyramid reminds you that there is more
weight, more pressure, at the bottom of the atmosphere than
there is higher up.
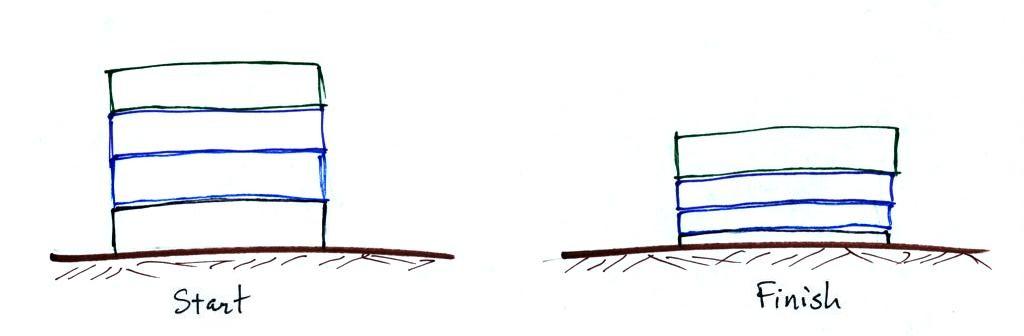
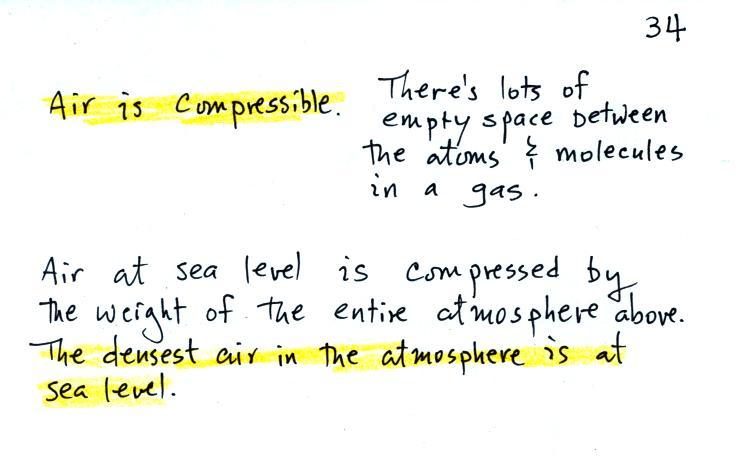
Layers of air are not solid and rigid like in a stack of
bricks. Layers of air are more like mattresses stacked on
top of each other. Mattresses are
compressible, bricks (and people) aren't. Mattresses are
also reasonably heavy, the mattress at the bottom of the pile
would be squished by the weight of the three mattresses
above. This is shown at right. The mattresses higher
up aren't compressed as much because there is less weight
remaining above. The same is true with layers of air in
the atmosphere.
The statement above is at the top of p. 34 in the photocopied
ClassNotes. I've redrawn the figure found at the bottom of
p. 34 below.
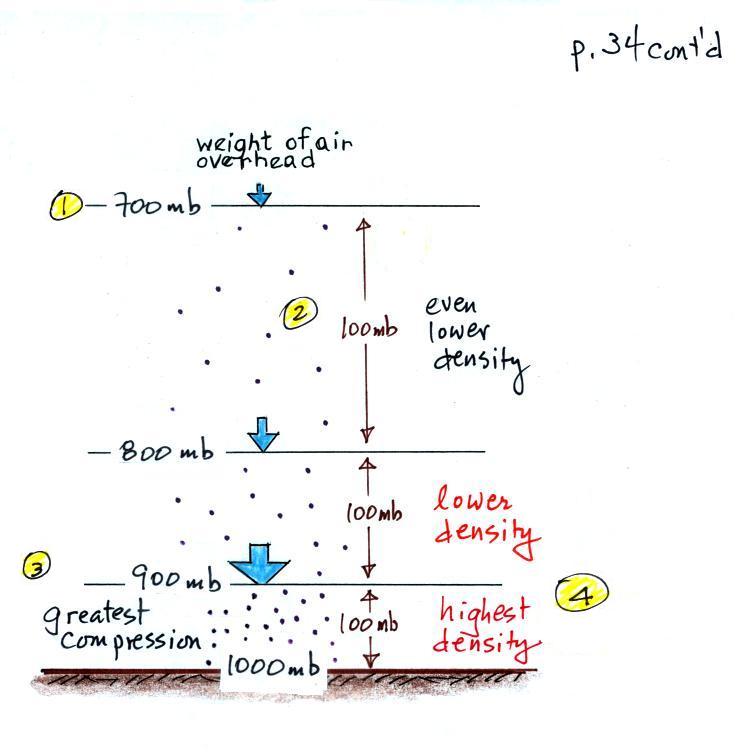
There's a surprising amount of information in this figure,
you need to spend a minute or two looking for it
1. You can first notice and remember that pressure
decreases with increasing altitude. 1000 mb at the
bottom decreases to 700 mb at the top of the picture. You
should be able to explain why this happens.
2. Each layer of air contains the same amount
(mass) of air. This is a fairly subtle
point. You can tell because the pressure drops by the same
amount, 100 mb, as you move upward through each layer.
Pressure depends on weight. So if all the pressure changes
are equal, the weights of each of the layers must be the
same. Each of the layers must contain the same amount
(mass) of air (each layer contains 10% of the air in the
atmosphere).
3. The densest air is found at the bottom of the
picture. The bottom layer is compressed the most
because it is supporting the weight of all of the rest of the
atmosphere. It is the thinnest layer in the picture and
the layer with the smallest volume. Since each layer has
the same amount of air (same mass) and the bottom layer has the
smallest volume it must have the highest density. The top
layer has the same amount of air but about twice the
volume. It therefore has a lower density (half the density
of the air at sea level). Density is decreasing with
increasing altitude. That's the main point in this figure.
4. A final point that you shouldn't worry too much about
yet. Pressure decreases 100 mb in a fairly
short vertical distance in the bottom layer of the picture - a
rapid rate of decrease with altitude. The same 100 mb drop
takes place in about twice the vertical distance in the top
layer in the picture - a smaller rate of decrease with
altitude. Pressure is decreasing most
rapidly with increasing altitude in the densest air in the
bottom layer. We'll make use of this concept again
at the end of the semester when we try to figure out why/how
hurricanes intensify and get as strong as they do.
Air temperature changes
with altitude, troposphere & stratosphere
We have learned that both air pressure and air
density decrease with increasing altitude. What happens
to air temperature? Our personal experience is
that it also decreases with increasing altitude. It is
colder at the top of Mt. Lemmon than it is here in the Tucson
valley.
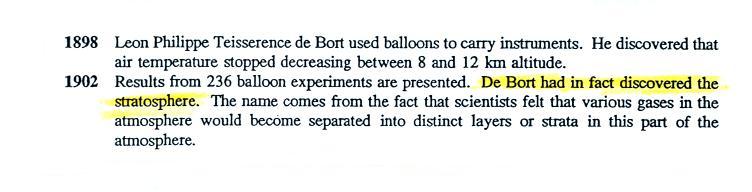
That is true up to an altitude of about 10 km (about
30,000 ft.). People were very surprised in the early 1900s
when they used balloons to carry instruments above 10 km and
found that temperature stopped decreasing (the information below
is on p. 31 in the ClassNotes).
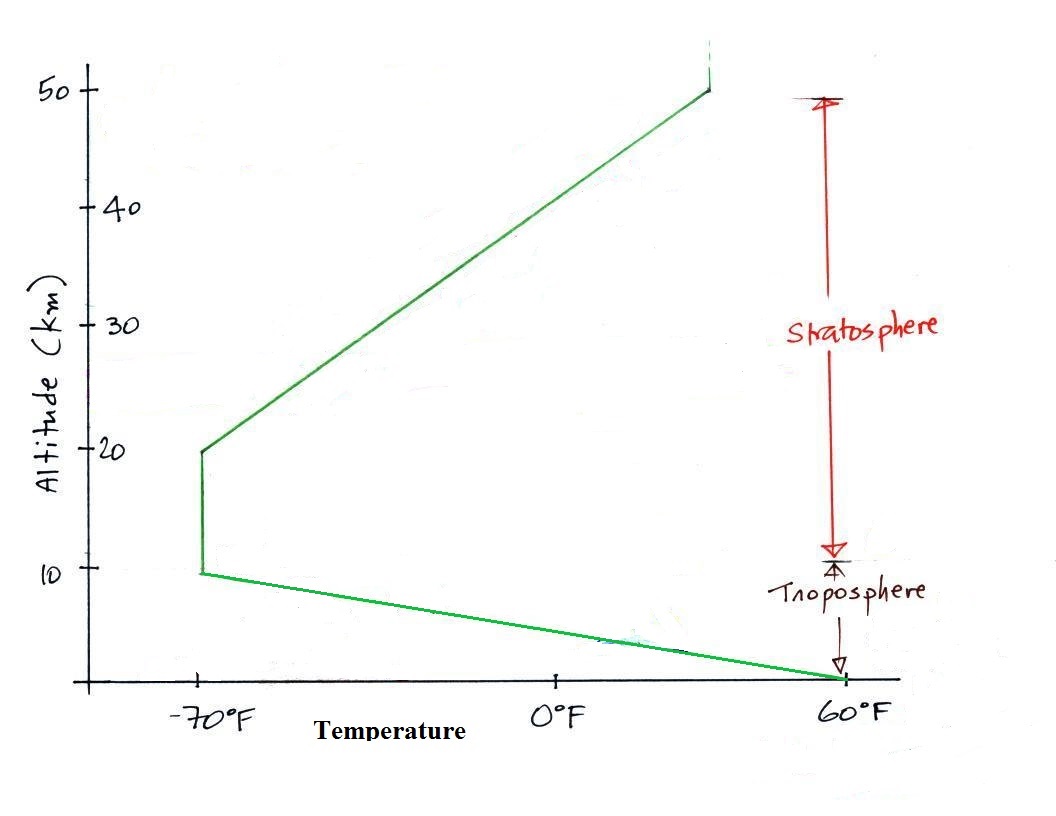
The figure below is a graph of air temperature (green line)
versus altitude and gives you a rough idea of how
temperature changes with altitude.
Temperature remains fairly constant between 10 and 20 km (an
isothermal layer) then begins increasing with increasing
altitude between 20 and 50 km. The atmosphere
can be split into layers depending on whether temperature is
increasing or decreasing with increasing altitude. The two
lowest layers are shown in the figure above. There are
additional layers (the mesosphere and the thermosphere) above 50
km but we won't worry about them in this class.
You also don't need to worry about the specific temperature
values on the x-axis of the graph.
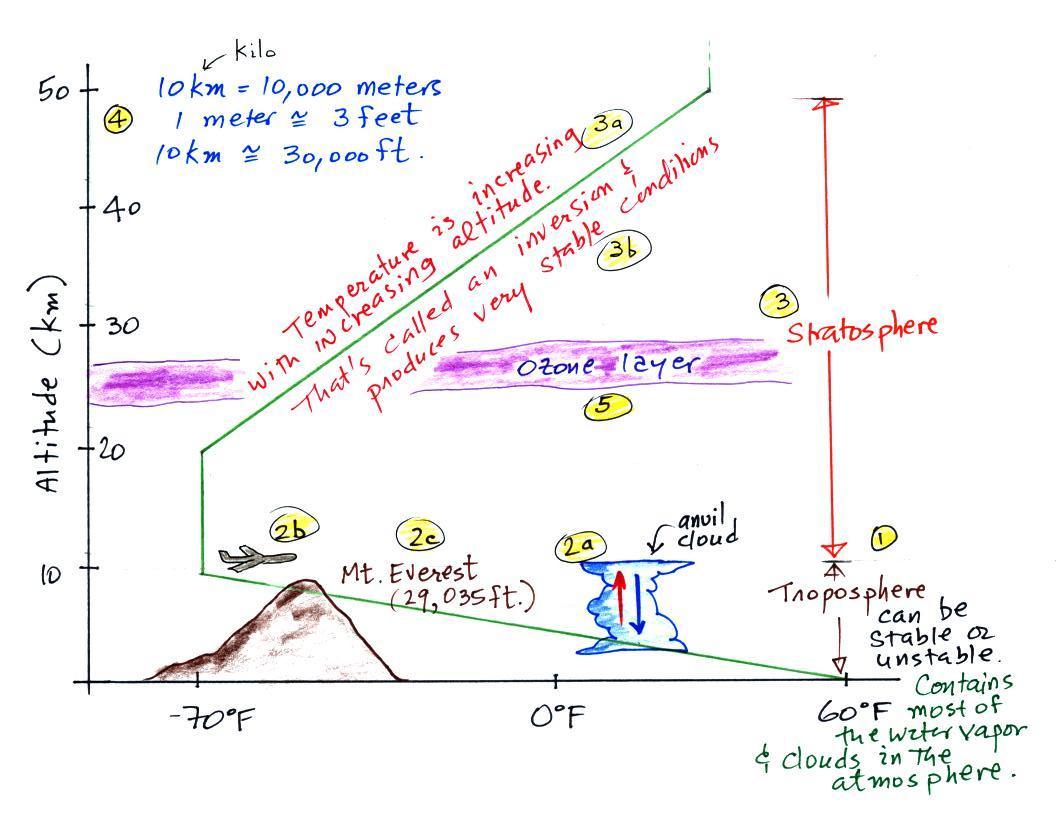
The numbers below refer to the numbered points in the figure
above.
1. We live in the troposphere. The troposphere
is found, on average, between 0 and about 10 km altitude, and is
where temperature usually decreases with increasing
altitude. [the troposphere is usually a little higher in
the tropics and lower at polar latitudes, the altitude depends
also on time of year]
The troposphere can be stable or unstable (tropo means "to
turn over" and refers to the fact that air can move up and down
in the troposphere). The troposphere contains most of the
water vapor in the atmosphere (the water vapor comes from
evaporation of ocean water and then gets mixed throughout the
troposphere by up and down air motions). The troposphere
is where most of the clouds and weather occurs.
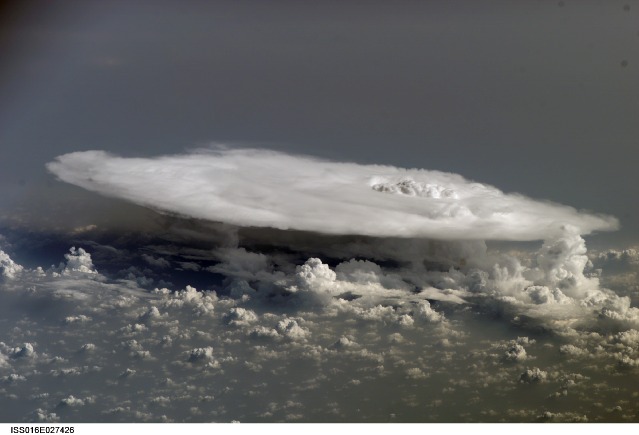
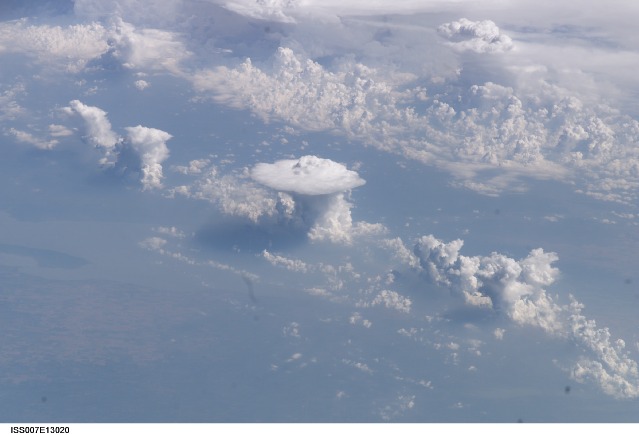
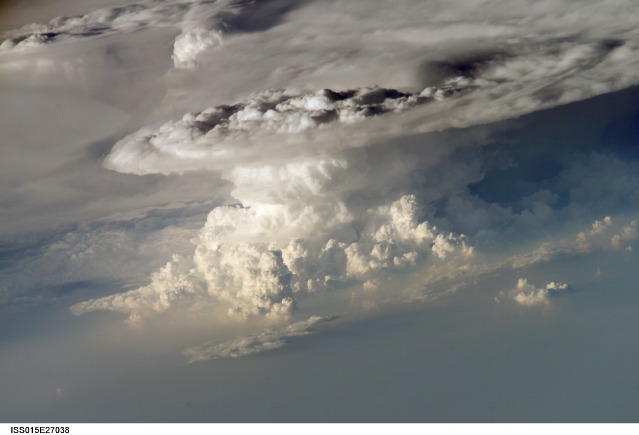
2a. The thunderstorm shown in the figure with its
strong updrafts and downdrafts indicates unstable
conditions. When the thunderstorm reaches the top of the
troposphere, it runs into the bottom of the stratosphere which
is a very stable layer. The air can't continue to rise
into the stratosphere so the cloud flattens out and forms an
anvil (anvil is the name given to the flat top of the
thunderstorm). The flat anvil top is something that
you can go outside and see and often marks the top of the
troposphere.
Here are several images of
thunderstorms and anvil clouds taken from above, from
the International Space Station (all
3 images courtesy of the Image Science and Analysis
Laboratory, NASA Johnson Space Flight Center,
www.eol.jsc.nasa.gov). The space station is
probably 200 or 300 km above the earth.
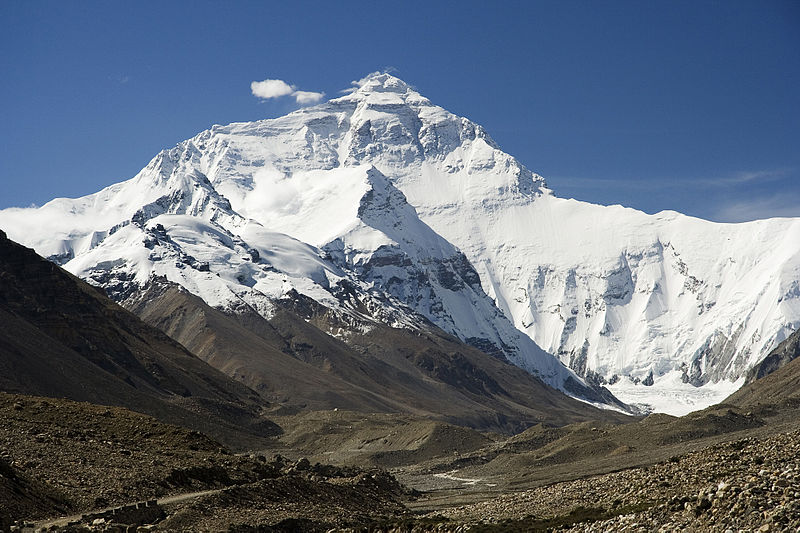
This photo of Mt. Everest was selected as
the Picture of the Day on Wikipedia for Dec. 22, 2007.
Photo credit: Luca Galluzi www.galluzi.it
2b. The summit of Mt. Everest is a little over
29,000 ft. tall and is close to the average height of
the top of the troposphere.
2c. Cruising altitude in a passenger jet is
usually between 30,000 and 40,000, near or just above
the top of the troposphere, and at the bottom of the
stratosphere. The next time you're in an airplane
try to look up at the sky above. There's less air
and less scattering of light. As a result the sky
is a darker purple color not blue. If you get high
enough the sky would eventually become black.
3. Temperature remains constant between 10 and 20
km and then increases with increasing altitude between
20 and 50 km. These two sections form the
stratosphere. Increasing temperature with
increasing altitude is called an inversion. This
is what makes the stratosphere so stable.
4. A
kilometer is one thousand meters. Since 1 meter
is about
3 feet, 10 km is about 30,000 feet. There
are 5280 feet in a mile so this is about 6
miles (about is usually close enough in this
class).
5. The ozone layer is found in
the stratosphere. Peak ozone concentrations occur
near 25 km altitude.
Here's
the same picture drawn again (for clarity) with some
additional information. We need to explain why
when temperature decreases all the way up to the top
of the troposphere, it can start increasing again in
the stratosphere.
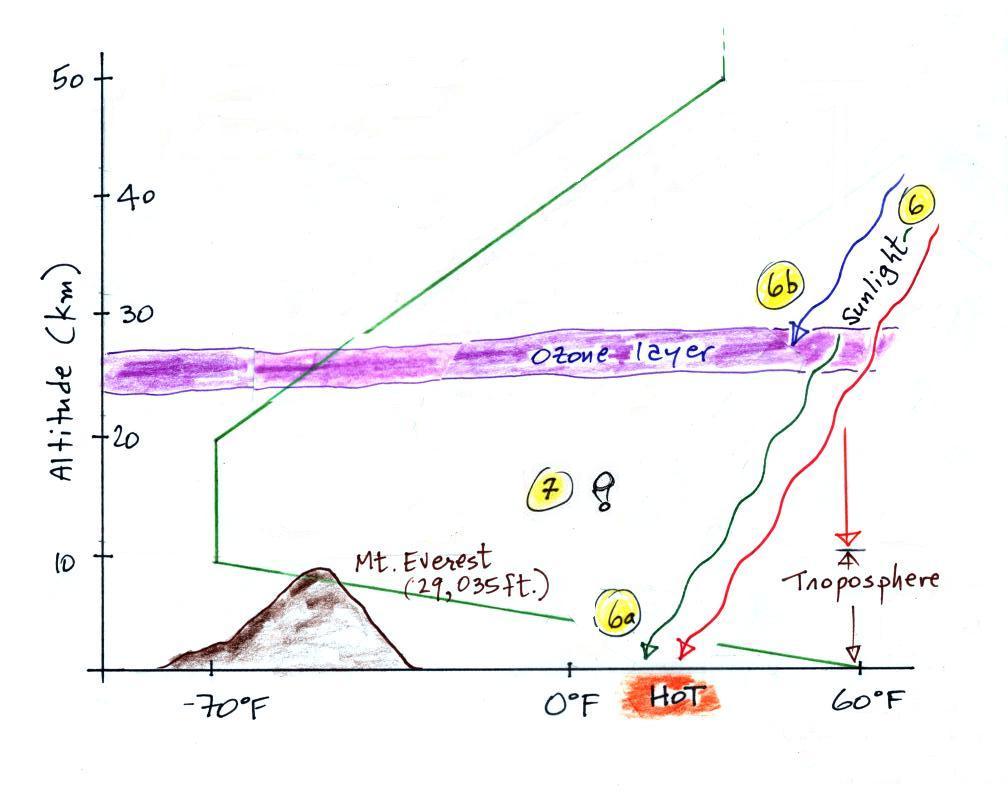
6. Sunlight is a mixture of ultraviolet, visible
(green in the figure above), and infrared light (colored
red). We can see the visible light.
6a. Much of the incoming sunlight passes
through the atmosphere and arrives at the ground where it is
absorbed. This warms the ground. The air in contact
with the ground is warmer than air just above. As you get
further and further from the warm ground, the air is
colder and colder. This explains why air temperature
decreases with increasing altitude in the troposphere.
5b. How do you explain increasing temperature with
increasing altitude in the stratosphere?
Absorption of ultraviolet light by
ozone warms the air in the stratosphere and explains why the air
can warm (oxygen also absorbs UV light). The air in the
stratosphere is much less dense (thinner) than in the
troposphere. So even though there is not very much UV
light in sunlight, it doesn't take as much energy to warm this
thin air as it would to warm denser air closer to the ground.
It's a little (maybe a lot) harder to explain
why the temperature starts increasing around 20 km and continues
to increase all the way to 50 km. Most likely different
amounts of different types of ultraviolet light are being
absorbed throughout the stratosphere. Ozone is not the
only gas that can absorb UV light. Oxygen is also a good
absorber of UV light.
7. That's a
manned balloon; Auguste Piccard and Paul Kipfer are
inside. They were the first men to travel into the
stratosphere and return alive (see pps 31 & 32 in the
photocopied Class Notes). It really was quite a daring
trip at the time, and they very nearly
didn't survive it. More about the Piccard family
below.