Thursday Oct. 6, 2016
Hot Club de Norvege "Swing for
Ninine" (0:00-4:15), Marcus Roberts "Bolivar Blues"
(3:15), if you have some extra time you really
should watch this 60
Minutes segment on Marcus Roberts, Mona's Hot
Four "First
3:40 from the Tuesdays at Mona's documentary", Hans
Otahal "Bumble
Boogie" (4:36), Hot Club of San Francisco "Don't Panic"
(5:51)
The Experiment #2 reports are due next Tuesday together with
the Surface Weather Map Analysis (you have the option of earning
1S1P pts or extra credit, be sure to choose one or the
other). I'll leave a box just inside the door to my office
in PAS 588 if you'd like to come by and drop off your experiment
materials. That gives you the right to pick up a copy of the
Supplementary Information handout for Expt. #2. I leave some
copies next to the box.
I will return the Scattering of Sunlight reports next Tuesday
(both your report and evaluations of your report conducted by two
unknown students in the class). I'm hoping to also have the
Causes of the Seasons and the Equinoxes reports graded by then
also.
Quiz #2 is one week from today and the complete Quiz #2 Study Guide is now
online.
We spent the first part of class looking at the section on latent
heat energy transport, found at the end of the Tue., Oct. 4 notes.
Energy transport by electromagnetic
radiation
It's time to tackle electromagnetic (EM)
radiation, the 4th and most important of the energy transport
processes (it's the most important because it can transport
energy through empty space (outer space)).
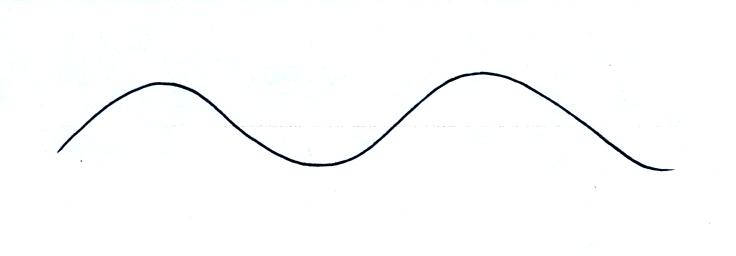
Many introductory textbooks depict EM
radiation with a wavy line like shown above. They don't
usually explain what the wavy line represents.
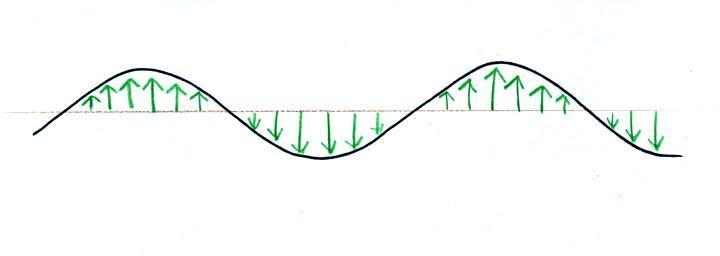
The wavy line just connects the tips of a bunch of "electric
field arrows". But what exactly are electric field arrows?
An electric
field arrow (vector)
just shows the direction
and
gives you an idea of the strength
of the electrical force
that would be exerted on
a positive charge at
that position.
It's just like an arrow painted on a street showing you what
direction to drive.
Electromagnetic (EM) radiation
Now we'll use what we know about electric field arrows (electric
field for short) to start to understand electromagnetic
radiation. How is it able to carry energy from
one place to another. You'll find most of the following on
p. 60 in the photocopied ClassNotes.
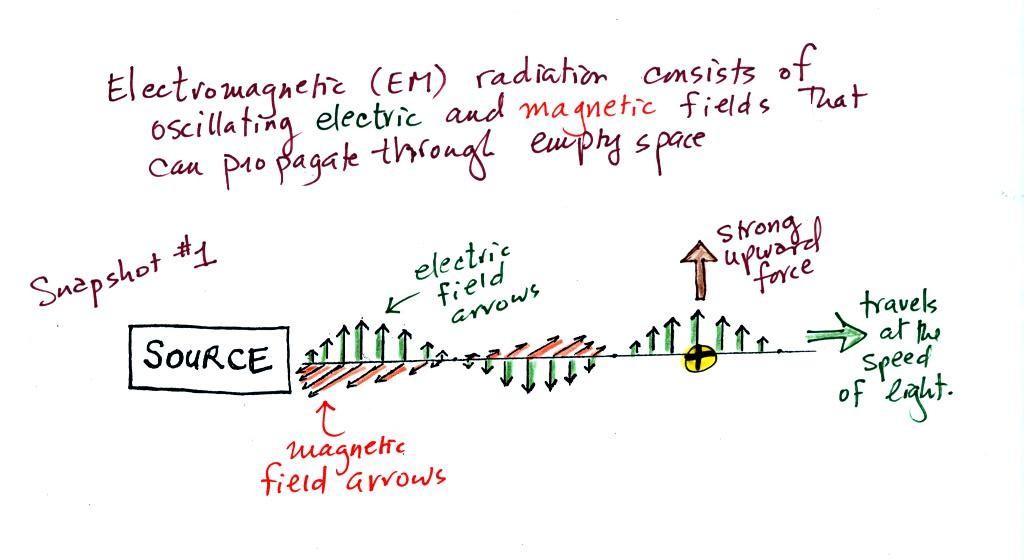
We imagine turning on a source of EM radiation and then a
very short time later we take a snapshot. In that time the
EM radiation has traveled to the right (at the speed of
light). The EM radiation is a wavy pattern of electric and
magnetic field arrows. We'll ignore the
magnetic field arrows. The E field arrows sometimes point
up, sometimes down. The pattern of electric field arrows
repeats itself.
Note the + charge near
the right side of the picture. At the time this picture
was taken the electric field at the position of the + charge points upward.
There is a fairly strong upward pointing force being exerted on
the + charge.
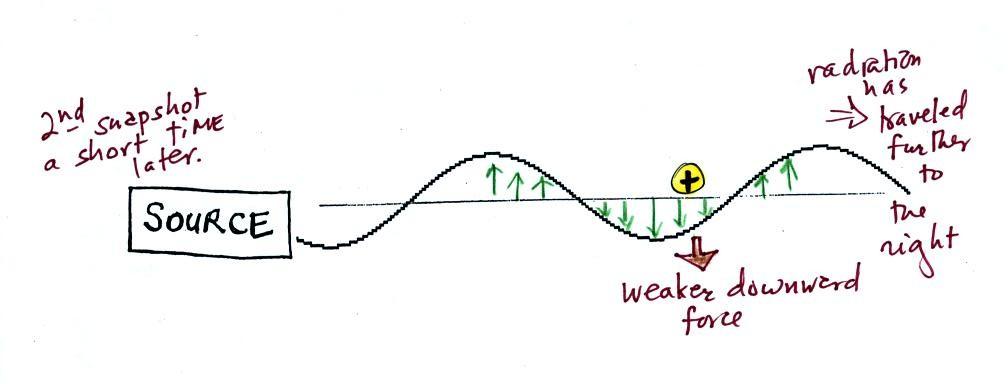
This picture above was taken a short time after the first
snapshot after the radiation had traveled a little further to
the right. The EM radiation now exerts a somewhat weaker
downward force on the +
charge.
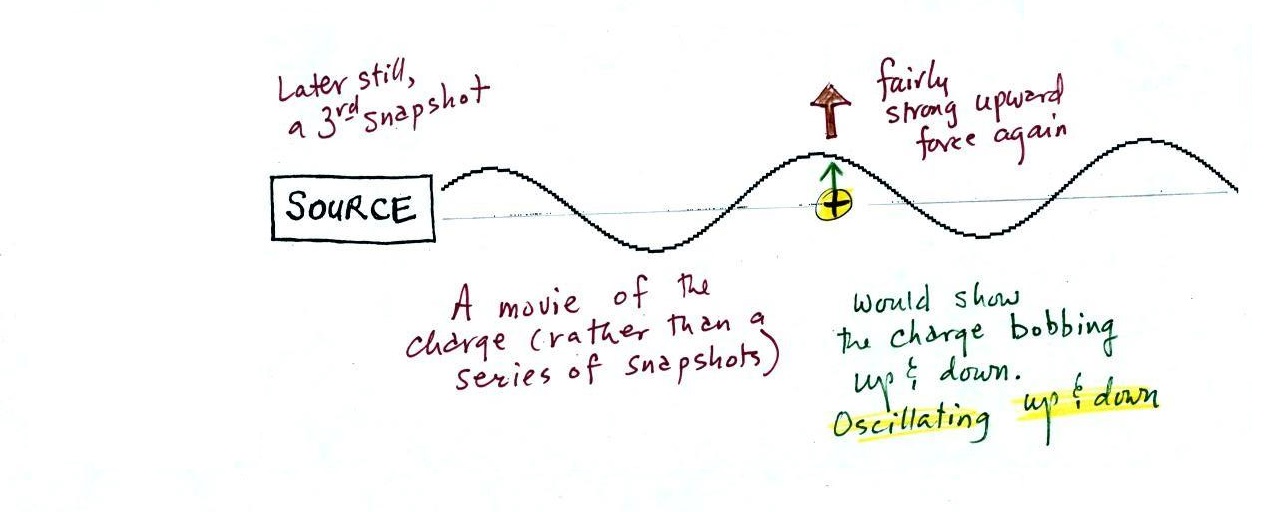
A 3rd snapshot taken a short time later. The + charge is now being pushed
upward again.
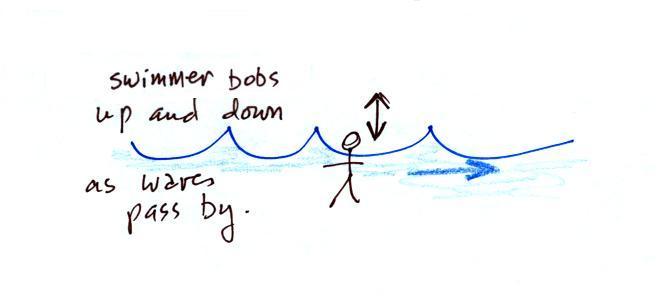
A movie of the + charge,
rather than just a series of snapshots, would show the charge
bobbing up and down much like a swimmer in the ocean would do as
waves passed by.
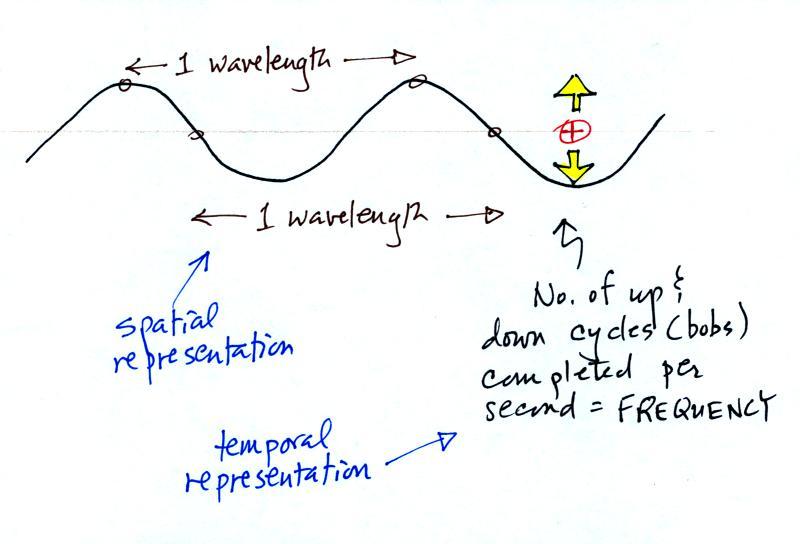
Wavelength and frequency
The wavy pattern used to depict EM radiation can be
described spatially
(what you would see in a snapshot) in terms of its wavelength,
the distance between identical points on the pattern.
Or you can describe the radiation temporally
using the frequency of oscillation (number of up and
down cycles completed by an oscillating charge per
second). By temporally we mean you look at one particular
fixed point and look at how things change with time.
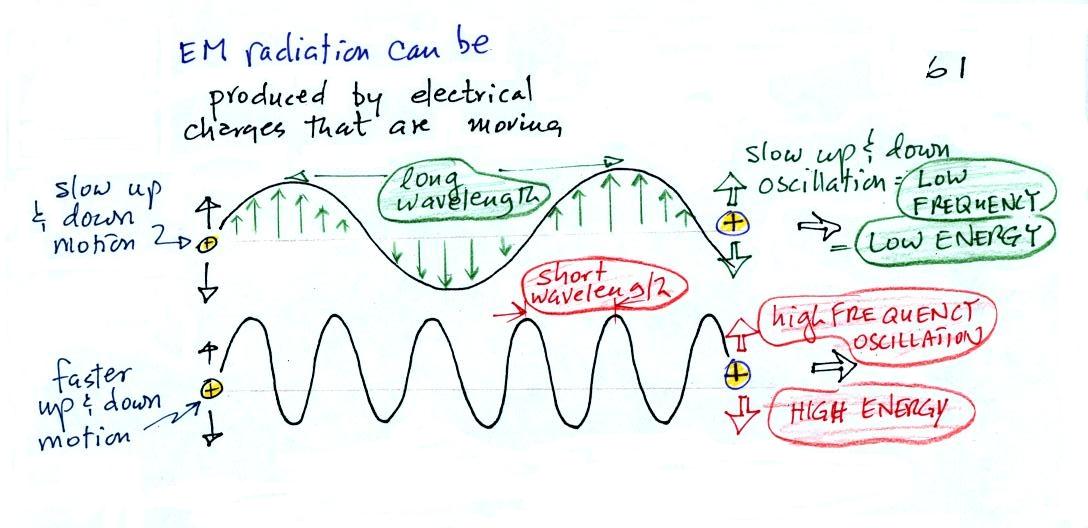
Wavelength, frequency, and energy
EM radiation can be created when you cause a charge to
move up and down. If you move a charge up and down
slowly (upper left in the figure above) you would produce long
wavelength radiation that would propagate out to the right at the
speed of light. If you move the charge up and down more
rapidly you produce short wavelength radiation that propagates at
the same speed.
Once the EM radiation encounters the charges at the right side
of the figure above the EM radiation causes those charges to
oscillate up and down. In the case of the long wavelength
radiation the charge at right oscillates slowly. This is low
frequency and low energy motion. The short wavelength causes
the charge at right to oscillate more rapidly - high frequency and
high energy.
These three characteristics: long
wavelength / low frequency / low energy go
together. So do short wavelength / high
frequency / high energy. Note that the two
different types of radiation both propagate at the same speed.
The
following figure illustrates how energy can be transported
from one place to another (even through empty space) in the
form of electromagnetic (EM) radiation.
You add energy when you cause an
electrical charge to move up and down and create the EM
radiation (top left).
In the middle figure, the EM
radiation that is produced then travels out to the right (it
could be through empty space or through something like the
atmosphere).
Once the EM radiation encounters an electrical charge at
another location (bottom right), the energy reappears as the
radiation causes the charge to move. Energy has been
transported from left to right.
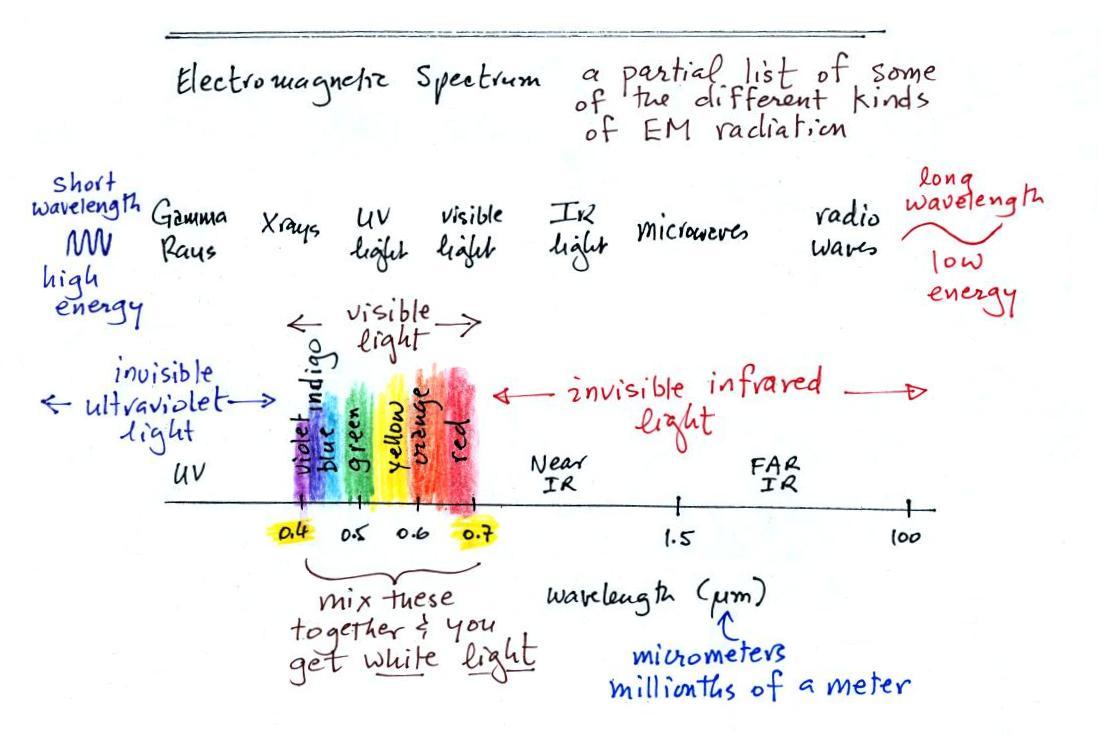
The electromagnetic spectrum
The EM spectrum is just a list of the different kinds of EM
radiation. A partial list is shown below.
In the top list, shortwave wavelength/high energy forms of EM
radiation are on the left (gamma rays and X-rays for
example). Microwaves and radiowaves are longer
wavelength/lower energy forms of EM radiation.
We will mostly be concerned with just ultraviolet light (UV),
visible light (VIS), and infrared light (IR). These are
shown on an expanded scale below. Note the micrometer
(millionths of a meter) units used for wavelength for these kinds
of light. The
visible portion of the spectrum falls between 0.4 and 0.7
micrometers. UV and IR light are both
invisible. All of the vivid colors shown above are just EM
radiation with slightly different wavelengths. When you see
all of these colors mixed together, you see white light.
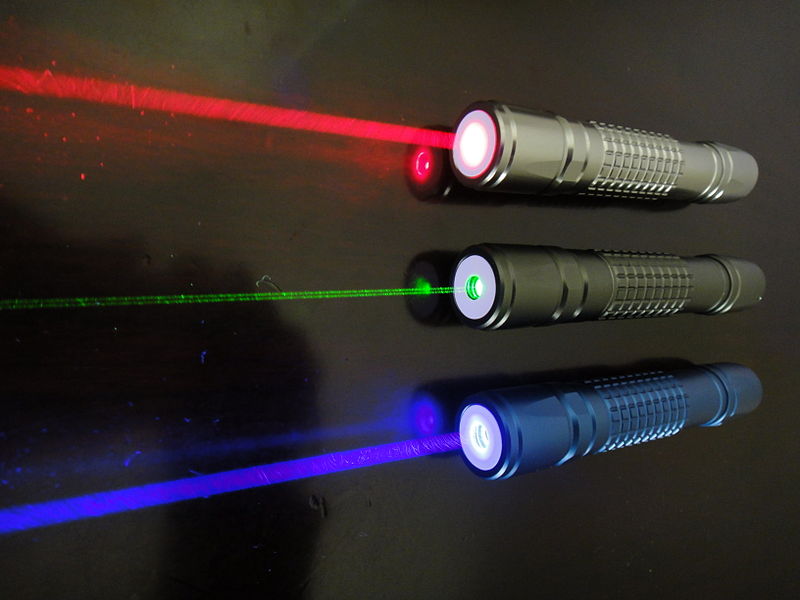
I've tried to demonstrate colors mixing together to make white
light using laser pointers.
But it's too hard to get them adjusted so that the small spots
of colored light all fall on top of each other on the screen at
the front of the room. And even if you do the small spot of
light is so small that it's hard to see clearly in a large
classroom (you need to do the experiment on a piece of paper a few
feet away).
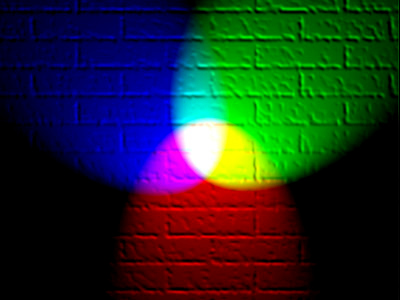
Here's the basic idea, you mix red green and blue light
together. You see white light were the three colors overlap
and mix in the center of the picture above.
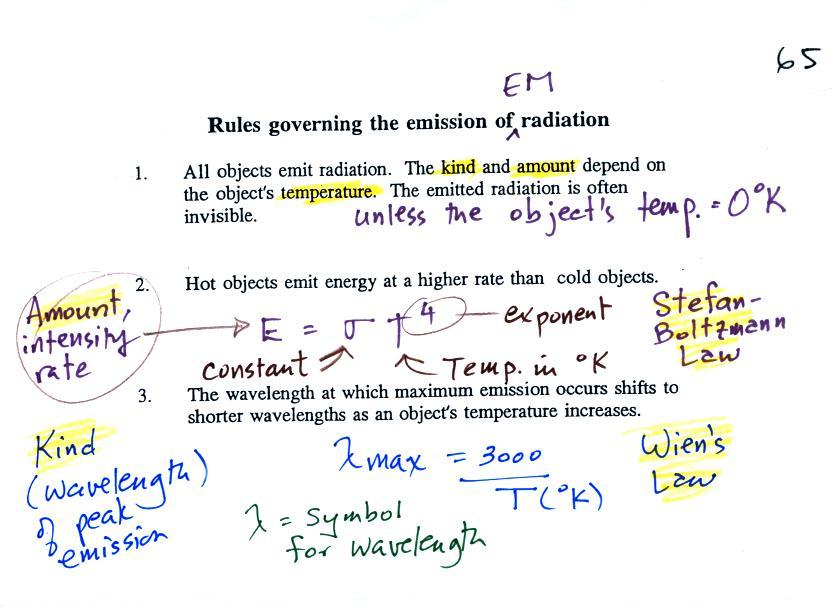
Rules governing the
emission of EM radiation
We'll spend a big part of the
class learning about some rules governing the emission of
electromagnetic radiation. Here they are:
1.
Everything
warmer than 0 K will emit EM radiation. Everything in
the classroom: the people, the furniture, the walls and the
floor, even the air, are emitting EM radiation.
Often this radiation will be invisible so that we can't see it
and weak enough that we can't feel it (or perhaps because it
is always there we've grown accustomed to it and ignore
it). Both the amount and kind (wavelength) of the
emitted radiation depend on the object's temperature. In
the classroom most everything has a temperature of around 300
K and we will see that means everything is emitting
far-infrared (FIR) radiation with a wavelength of about 10µm.
2.
The second rule allows you to determine the
amount of EM radiation (radiant energy) an object will
emit. Don't worry about the units (though they're given
in the figure below), you can think of this as amount, or
rate, or intensity. Don't worry about σ (the Greek character rho) either, it is
just a constant. The amount depends
on temperature to the fourth power. If the temperature
of an object doubles the amount of energy emitted will
increase by a factor of 2 to the 4th power (that's 2 x 2 x 2 x
2 = 16). A hot object just doesn't emit a little more
energy than a cold object it emits a lot more energy than a
cold object. This is illustrated in the following
figure:
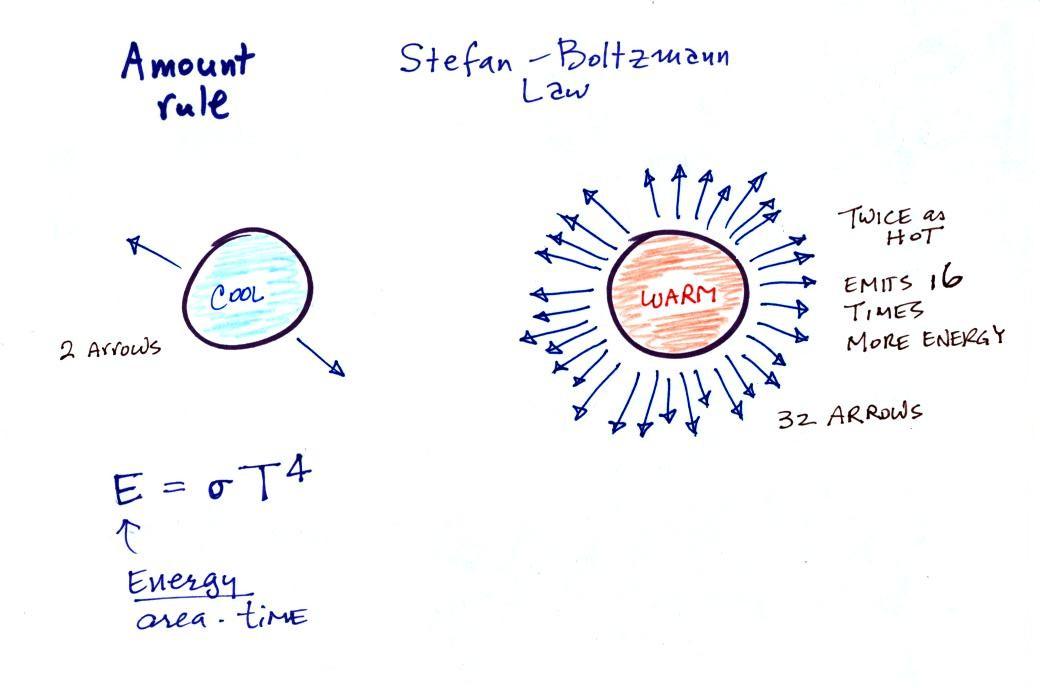
The cool object is emitting 2
arrows worth of energy. This could be the earth at 300
K. The warmer object is 2 times warmer, the earth heated
to 600 K. The earth then would emit 32 arrows (16 times
more energy).
The earth has a temperature of 300 K. The sun is 20
times hotter (6000 K). Every square foot of the sun's
surface will emit 204 (160,000)
times more energy per second than a square foot of the
earth's surface.
3.
The third rule tells you something about the kind of
radiation emitted by an object. We will see that objects
usually emit radiation at many different wavelengths but not in
equal amounts. Objects emit more of one particular
wavelength than any of the others. This is called λmax
("lambda max", lambda is the Greek character used to represent
wavelength) and is the wavelength of maximum emission. The
third rule allows you to calculate λmax.
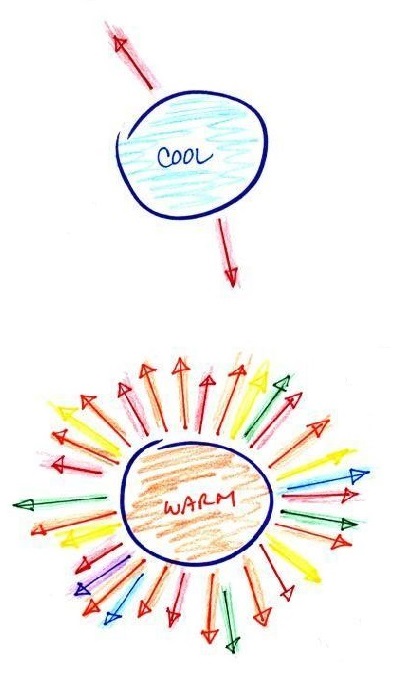
The tendency for warm objects to emit radiation at shorter
wavelengths is shown below.
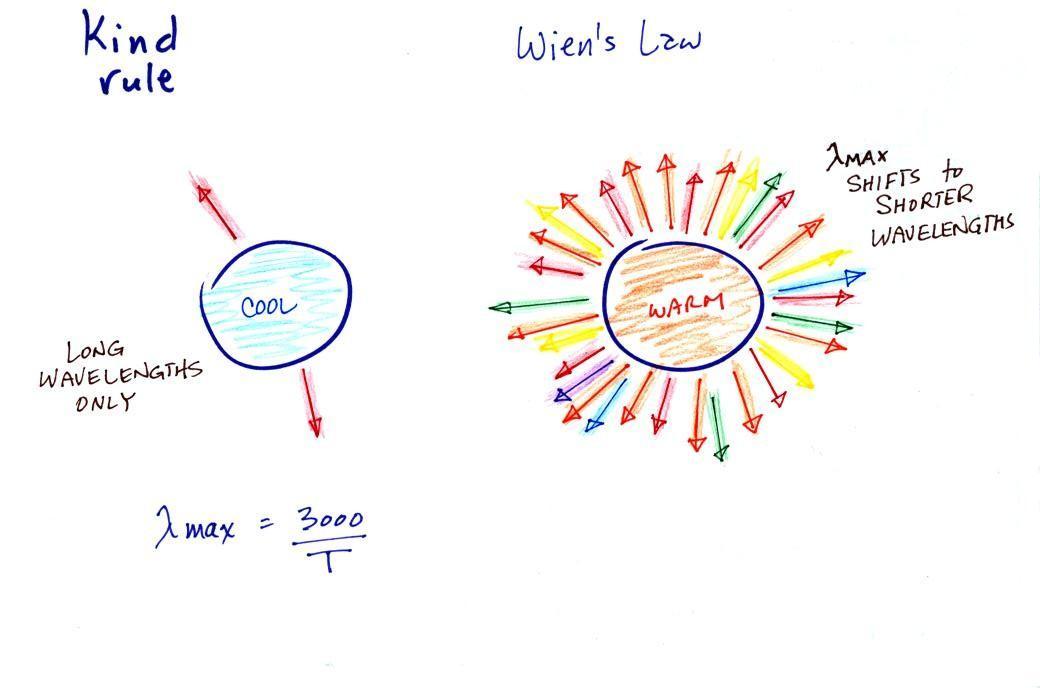
The cool object could be emitting infrared light
(that would be the case for the earth at 300 K). It might be
emitting a little bit of red light that we could see. That's
the 2 arrows of energy that are colored red. The warmer
object will also emit IR light but also shorter wavelengths such
as yellow, green, blue, and violet (maybe even some UV if it's hot
enough). Remember though when
you start mixing different colors of visible light you get
something that starts to look white. The cool object
might appear to glow red, the hotter object would be much
brighter and would appear white.
Here's another way of understanding Stefan Boltzmann's law and
Wien's Law (the graph
below is on the bottom of p. 65 in the ClassNotes).
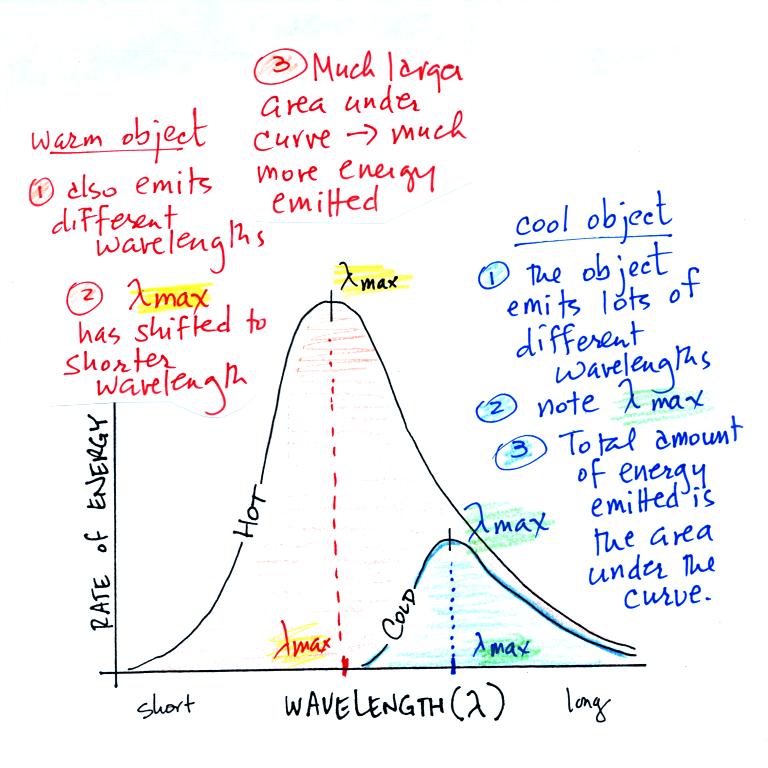
1.
Notice
first that both and warm and the cold objects emit radiation
over a range of wavelengths (the curves above are like quiz
scores, not everyone gets the same score, there is a
distribution of grades). The warm object emits all the
wavelengths the cooler object does plus lots of additional
shorter wavelengths.
2.
The peak of
each curve is λmax
the wavelength of peak emission (the
object emits more of that particular wavelength than any other
wavelength). Note that λmax
has shifted toward shorter wavelengths for the warmer
object. That is Wien's law in action. The warmer
object is emitting lots of types of short wavelength radiation
that the colder object doesn't emit.
3.
The area under the curve is the total radiant
energy emitted by the object. The area
under the warm object curve is much bigger than the area
under the cold object curve. This
illustrates the fact that the warmer object emits a lot more
radiant energy than the colder object.
This is as
far as we were able to get in class today (we spent too much
time on the section on latent heat. We'll review the
rules governing the emission of EM radiation at the start of
class next Tuesday and I'll show the following demonstration.
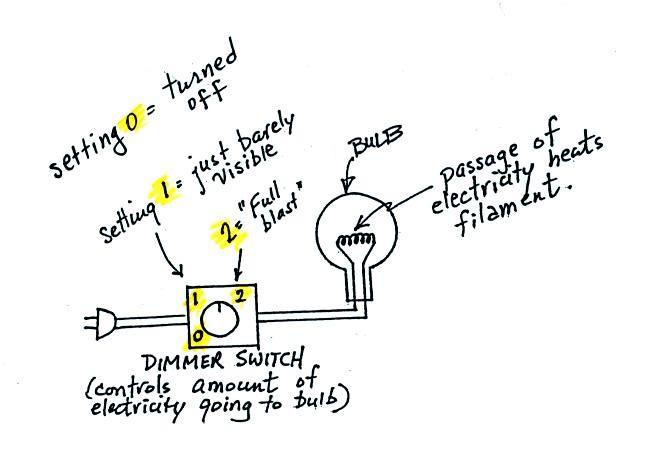
It is relatively easy to see Stefan-Boltzmann's law and Wien's
Law in action. The class demonstration consisted of an
"ordinary" 200 W tungsten bulb is connected to a dimmer switch
(see p. 66 in the photocopied ClassNotes). We'll be looking
at the EM radiation emitted by the bulb filament.
The graph at the bottom of p. 66 has been split up into 3 parts
and redrawn for improved clarity.
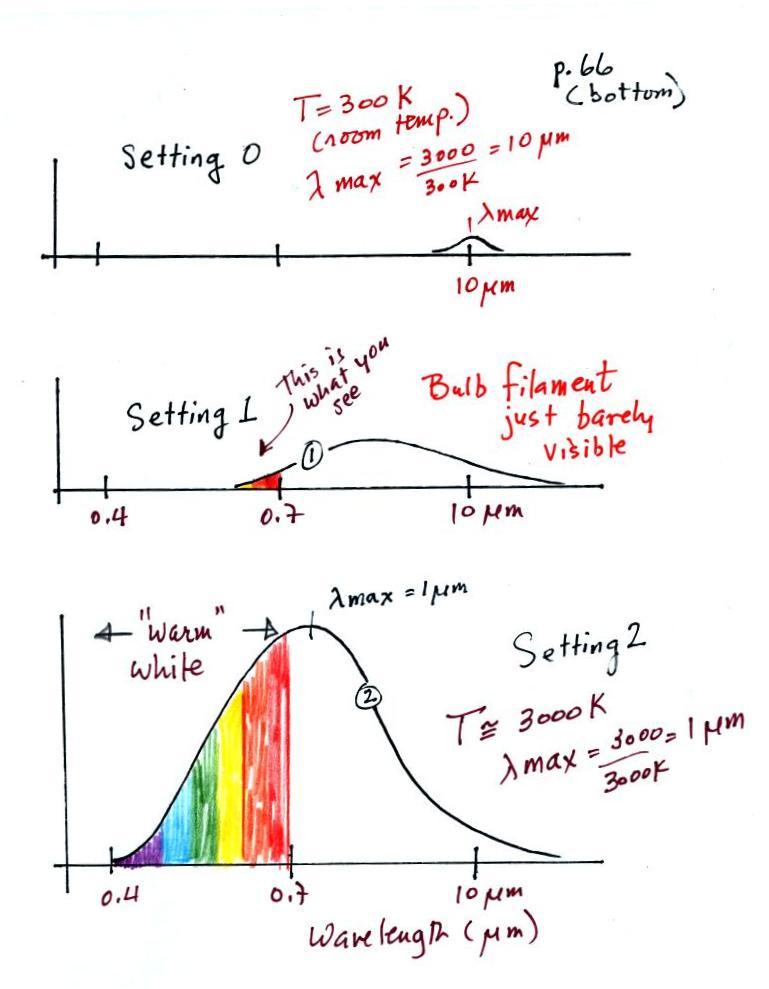
We start with the bulb turned off (Setting 0). The
filament will be at room temperature which we will assume is
around 300 K (remember that is a reasonable and easy to remember
value for the average temperature of the earth's surface).
The bulb will be emitting radiation, it's shown on the top graph
above. The radiation is very weak so we can't feel it.
We can use Wien's Law to calculate the wavelength of peak
emission, λmax
. The wavelength of peak emission is
10 micrometers which is long wavelength, far IR radiation so we can't see
it.
Next we use the dimmer switch to just barely turn the bulb on
(the temperature of the filament is now about 900 K). The
bulb wasn't very bright at all and had an orange color. This
is curve 1, the middle figure. Note the far left end of the
emission curve has moved left of the 0.7 micrometer mark - into
the visible portion of the spectrum. That is what you were
able to see, just the small fraction of the radiation emitted by
the bulb that is visible light (but just long wavelength red and
orange light). Most of the radiation emitted by the bulb is
to the right of the 0.7 micrometer mark and is invisible IR
radiation (it is strong enough now that you could feel it if you
put your hand next to the bulb).
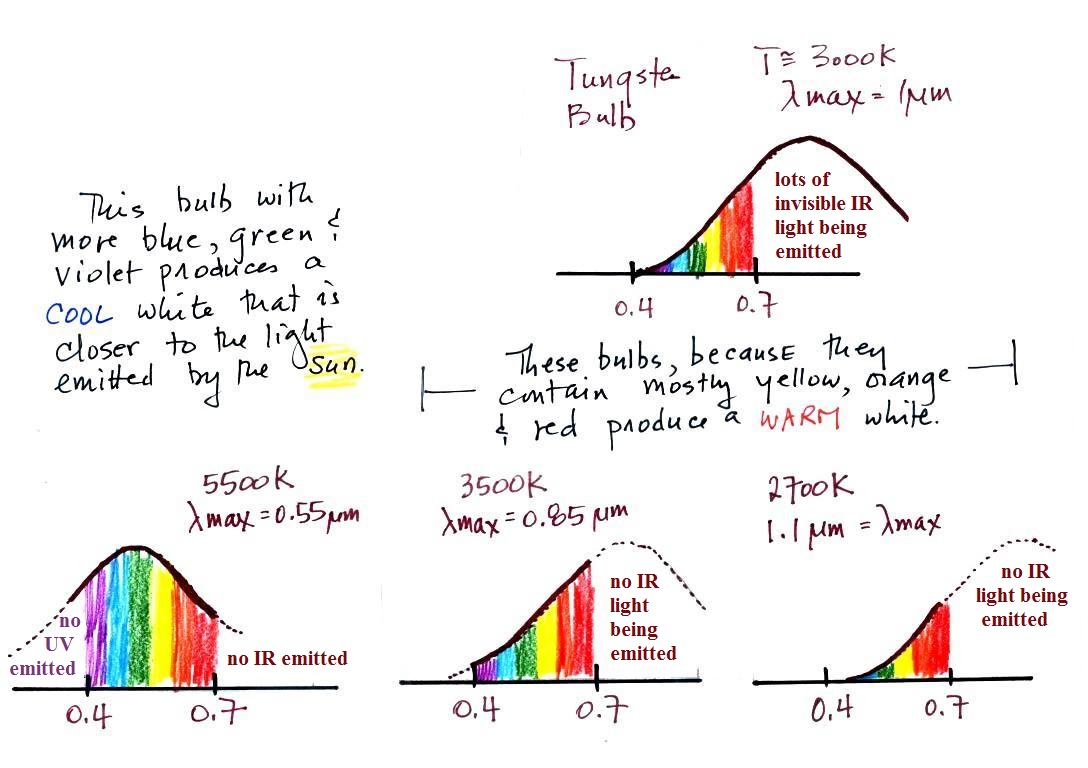
Finally we turn on the bulb completely (it is a 200 Watt bulb
so it got pretty bright). The filament temperature is now
about 3000K. The bulb is emitting a lot more visible light,
all the colors, though not all in equal amounts. The mixture
of the colors produces a "warm white" light. It is warm
because it is a mixture that contains a lot more red, orange, and
yellow than blue, green, and violet light. It is interesting
that most of the radiation emitted by the bulb is still in the IR
portion of the spectrum (lambda max is 1 micrometer). This
is invisible light. A tungsten bulb like this is not
especially efficient, at least not as a source of visible light.
Light emitted by the earth and sun; warm
and cool white; tungsten bulbs, compact fluorescent bulbs,
and LED bulbs
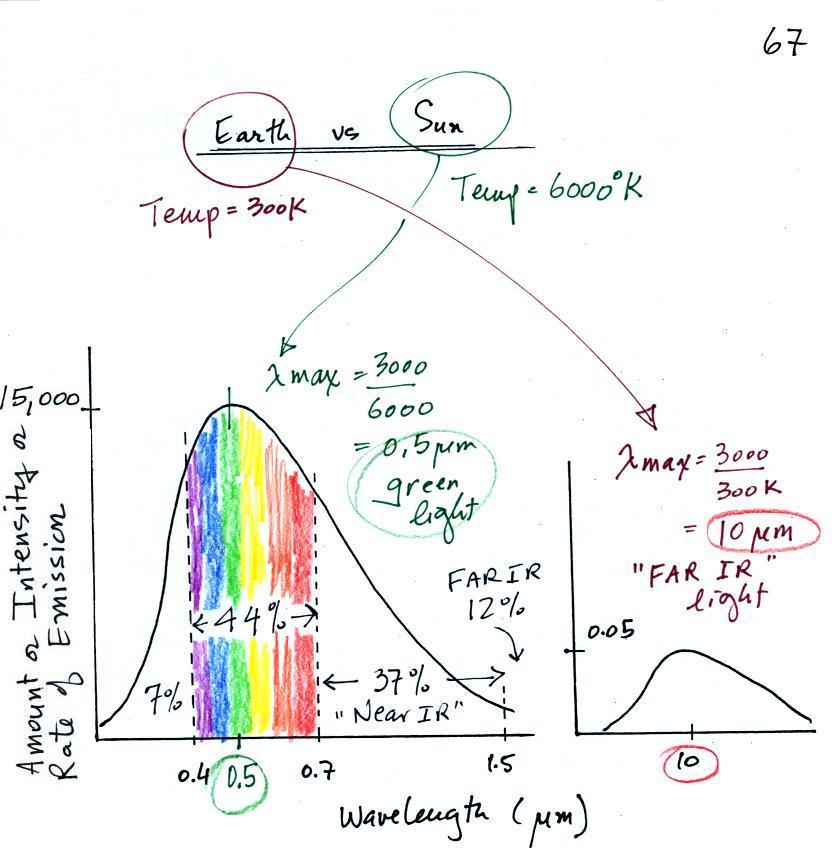
The figure compares the light emitted by the sun and
the earth.
The curve on the left is for the sun. The surface of the
sun has a temperature of 6000 K so we can use Wien's law to
calculate λmax
. It turns out to be 0.5 micrometers. This is green
light; the sun emits more green
light than any other kind of light.
The sun doesn't appear green because it is also emitting lesser
amounts of violet, blue, yellow, orange, and red - together this
mix of colors appears white (it's a cooler white than
emitted by a tungsten bulb). 44% of the radiation emitted by
the sun is visible light, Very nearly half of sunlight (49%)
is IR light (37% near IR + 12% far IR). 7% of sunlight is
ultraviolet light. More than half of the light emitted by
the sun (the IR and UV light) is invisible.
100% of the light emitted by the earth (temperature = 300 K) is
invisible far IR light. The wavelength of peak emission for
the earth is 10 micrometers.
Because the sun (surface of the sun) is 20 times hotter
than the earth the sun's surface emits energy at a much higher
rate than the earth (160,000 times higher). Note
the vertical scale on the earth curve is different than on the sun
graph. If both the earth and sun were plotted with the same
vertical scale, the earth curve would be much too small to be
seen.
Ordinary tungsten bulbs (incandescent bulbs)
produce a lot of wasted energy. This is because they
emit a lot of invisible infrared light that doesn't light up a
room (it will warm up a room but there are better ways of
doing that). The light that they do produce is a warm
white color (tungsten bulbs emit lots of orange, red, and
yellow light and not much blue, green or violet).
Energy efficient compact fluorescent lamps (CFLs) are being
touted as an ecological alternative to tungsten bulbs because
they use substantially less electricity, don't emit a
lot of wasted infrared light, and also last longer. CFLs
come with different color temperature ratings.
The bulb with the hottest temperature rating (5500 K ) in the
figure above is meant to mimic or simulate sunlight
(daylight). The temperature of the sun is 6000 K and lambda
max is 0.5 micrometers. The spectrum of the 5500 K bulb is
similar. Even though the color temperature is
high this is referred to as cool white because it contains more
blue, green, and violet light.
The tungsten bulb (3000 K) and the CFLs with temperature
ratings of 3500 K and 2700 K produce a warmer white.
Three CFLs with the temperature ratings above were set up in
class so that you actually could see the difference between warm
and cool white light. Personally I find the 2700 K bulb "too
warm," it makes a room seem gloomy and depressing (a student in
class once said the light resembles Tucson at night). The
5500 K bulb is "too cool" and creates a stark sterile atmosphere
like you might see in a hospital corridor. I prefer the 3500
K bulb in the middle.
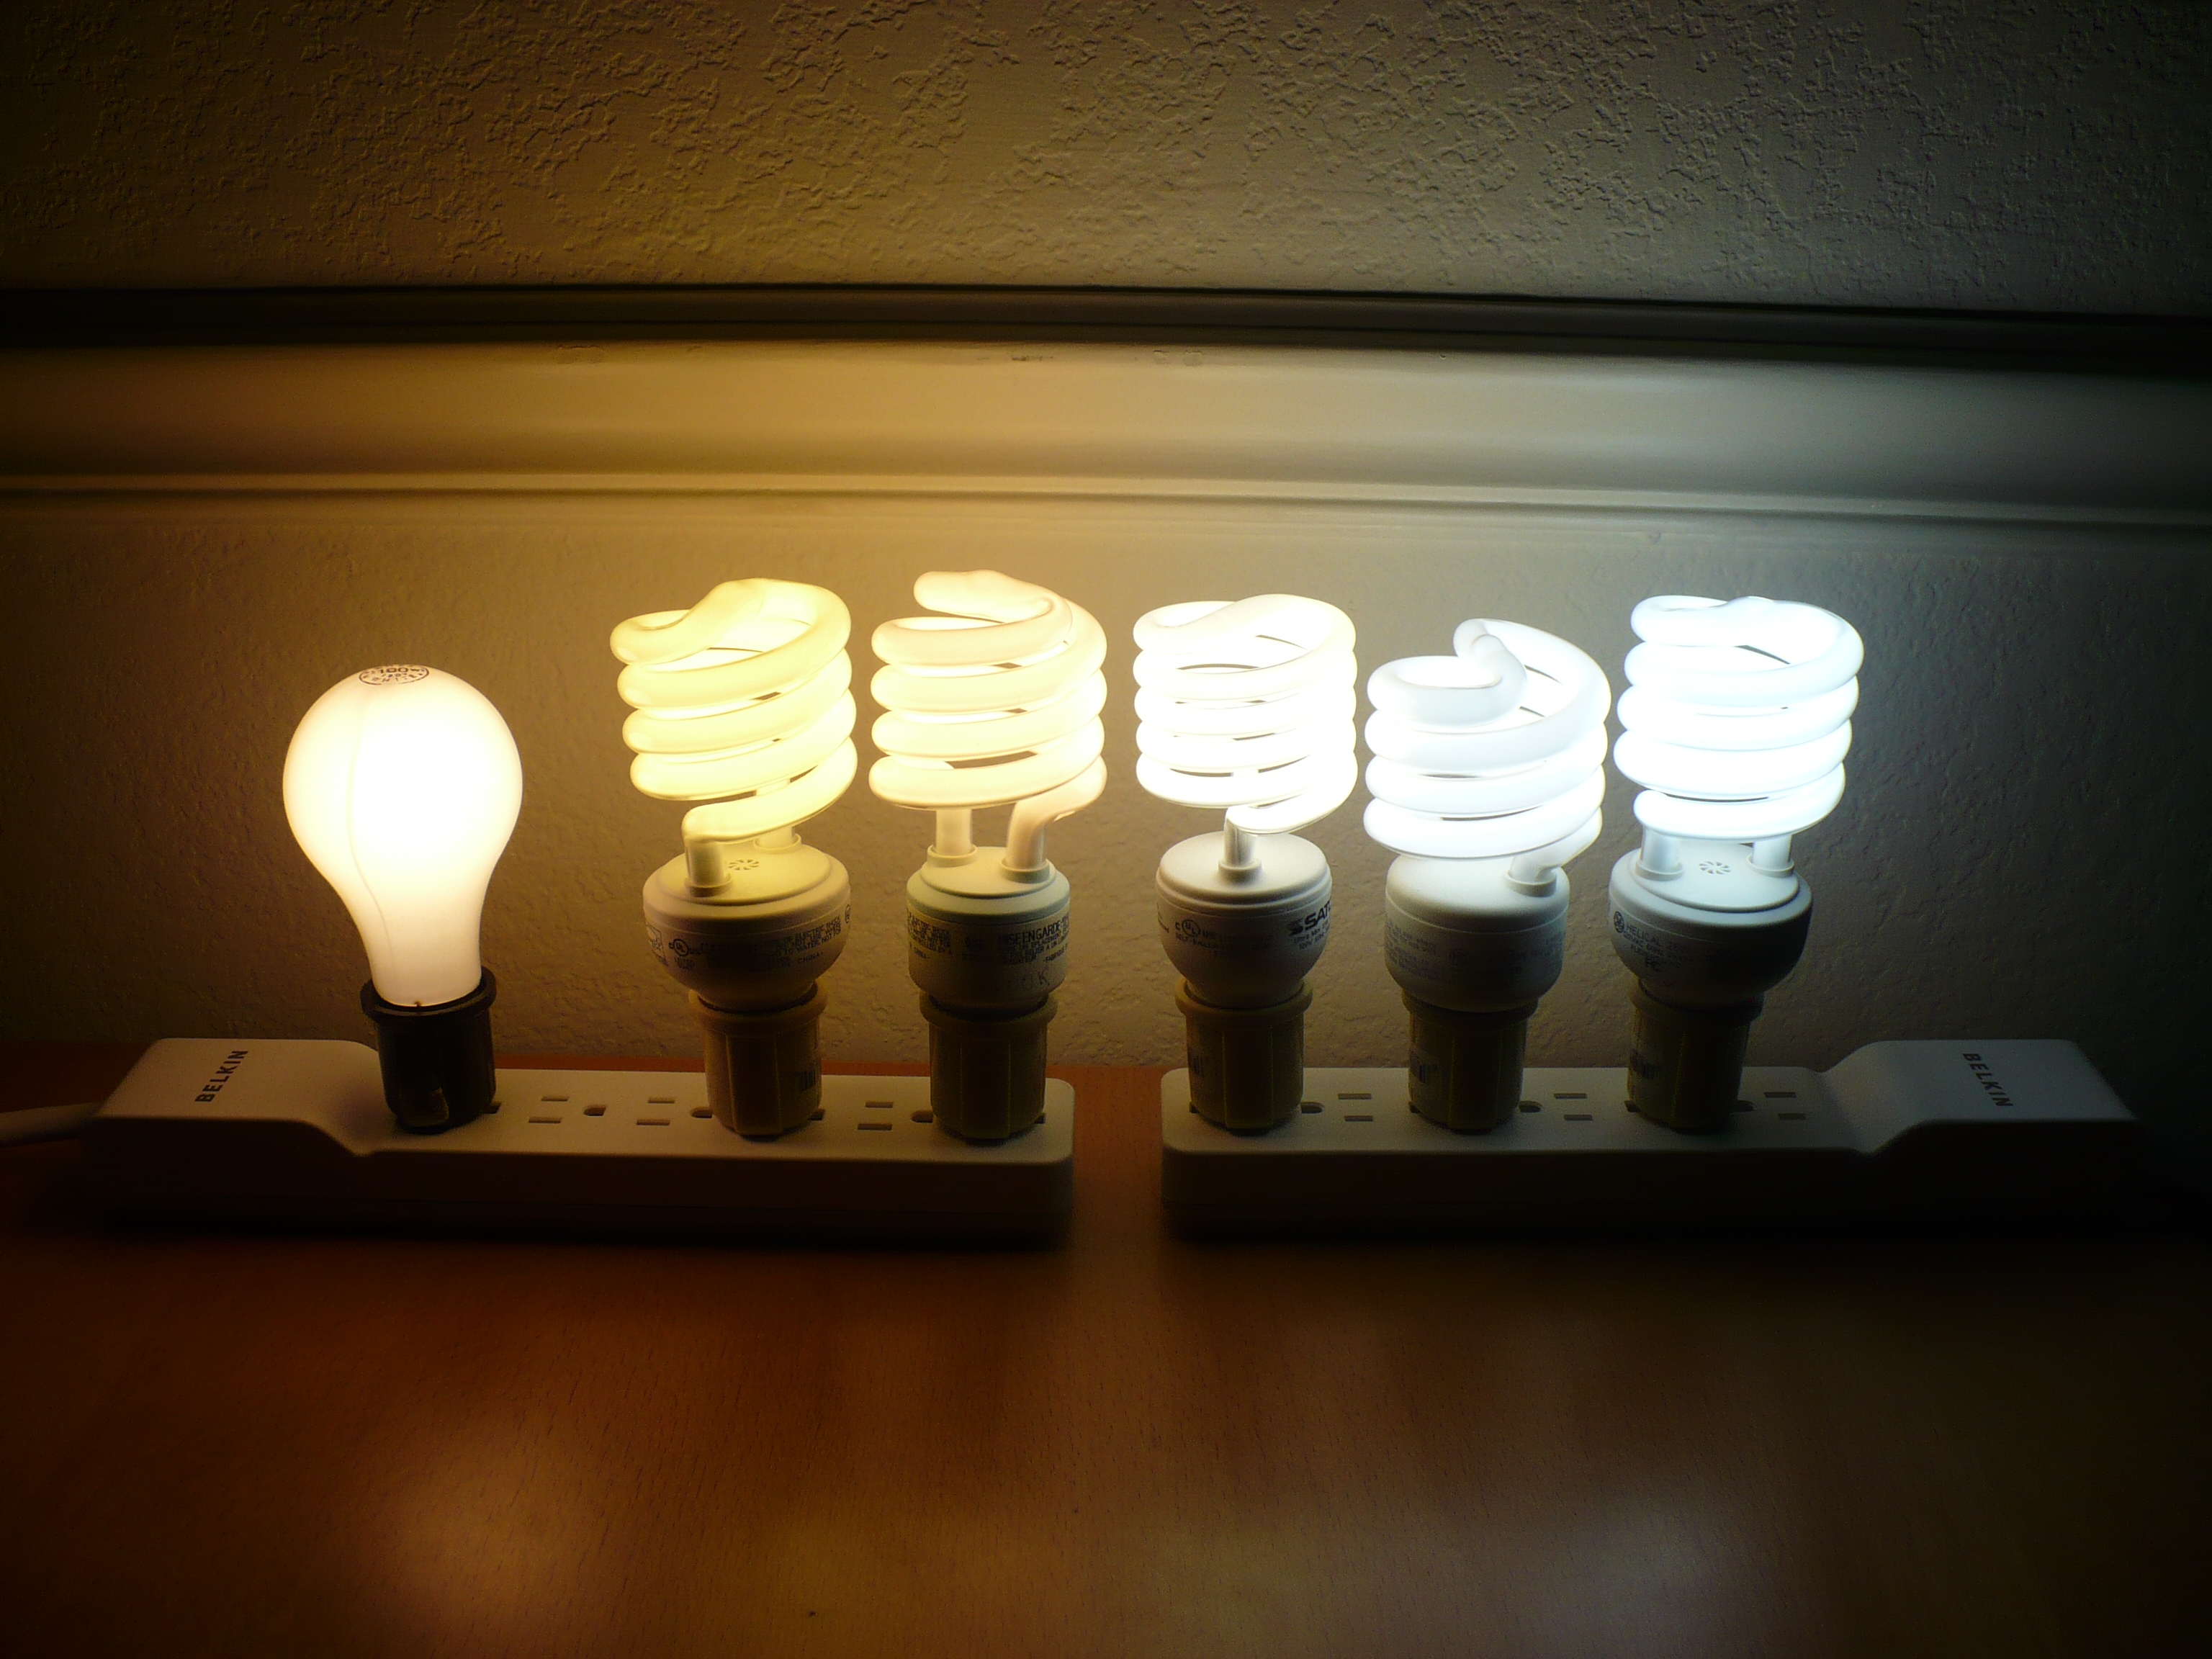
The photograph below (from this
source) showing the difference between warm white and cooler
white is one of the best I've seen. It's better than the
demonstration shown in class because there are more bulbs (guess
what I'll be doing this weekend).
The bulb on the left has a tungsten filament and a color
temperature of 3000K. Then moving from left to right are CFL
bulbs with color temperatures of 2700 K, 3500 K, 4100 K, 5500 K,
and 6500 K.
There is one downside to these energy efficient CFLs. The
bulbs shouldn't just be discarded in your ordinary household trash
because they contain mercury. They should be disposed of
properly (at a hazardous materials collection site or perhaps at
the store where they were purchased). I suspect
a lot of people don't do that.
It probably won't be long before LED bulbs begin
to replace tungsten and CFL bulbs. The price has been
dropping in the last year or two.
LED stands for light emitting diode. We won't be looking
at them in detail except to say that a single LED can produce only
a single color, it can't produce white light. What is done
instead is to put three small LEDS, producing red green and blue
light, in close proximity. When they are illuminated the
three colors mix together to produce white light.
CFLs sometimes take 30 seconds or a minute to come to full
brightness. LED bulbs turn on instantaneously.