Web links for ATMO 170A1 - Section 1
Chapter 6 and 8
Station data resources:
1. Appendix C (p. 488-489) in the class textbook (Ahrens 2015, 7th edition)
3. Appendix B from Lutgens and Tarbuck (2016, 13th edition)
Map of
surface station, fronts, and satellite image
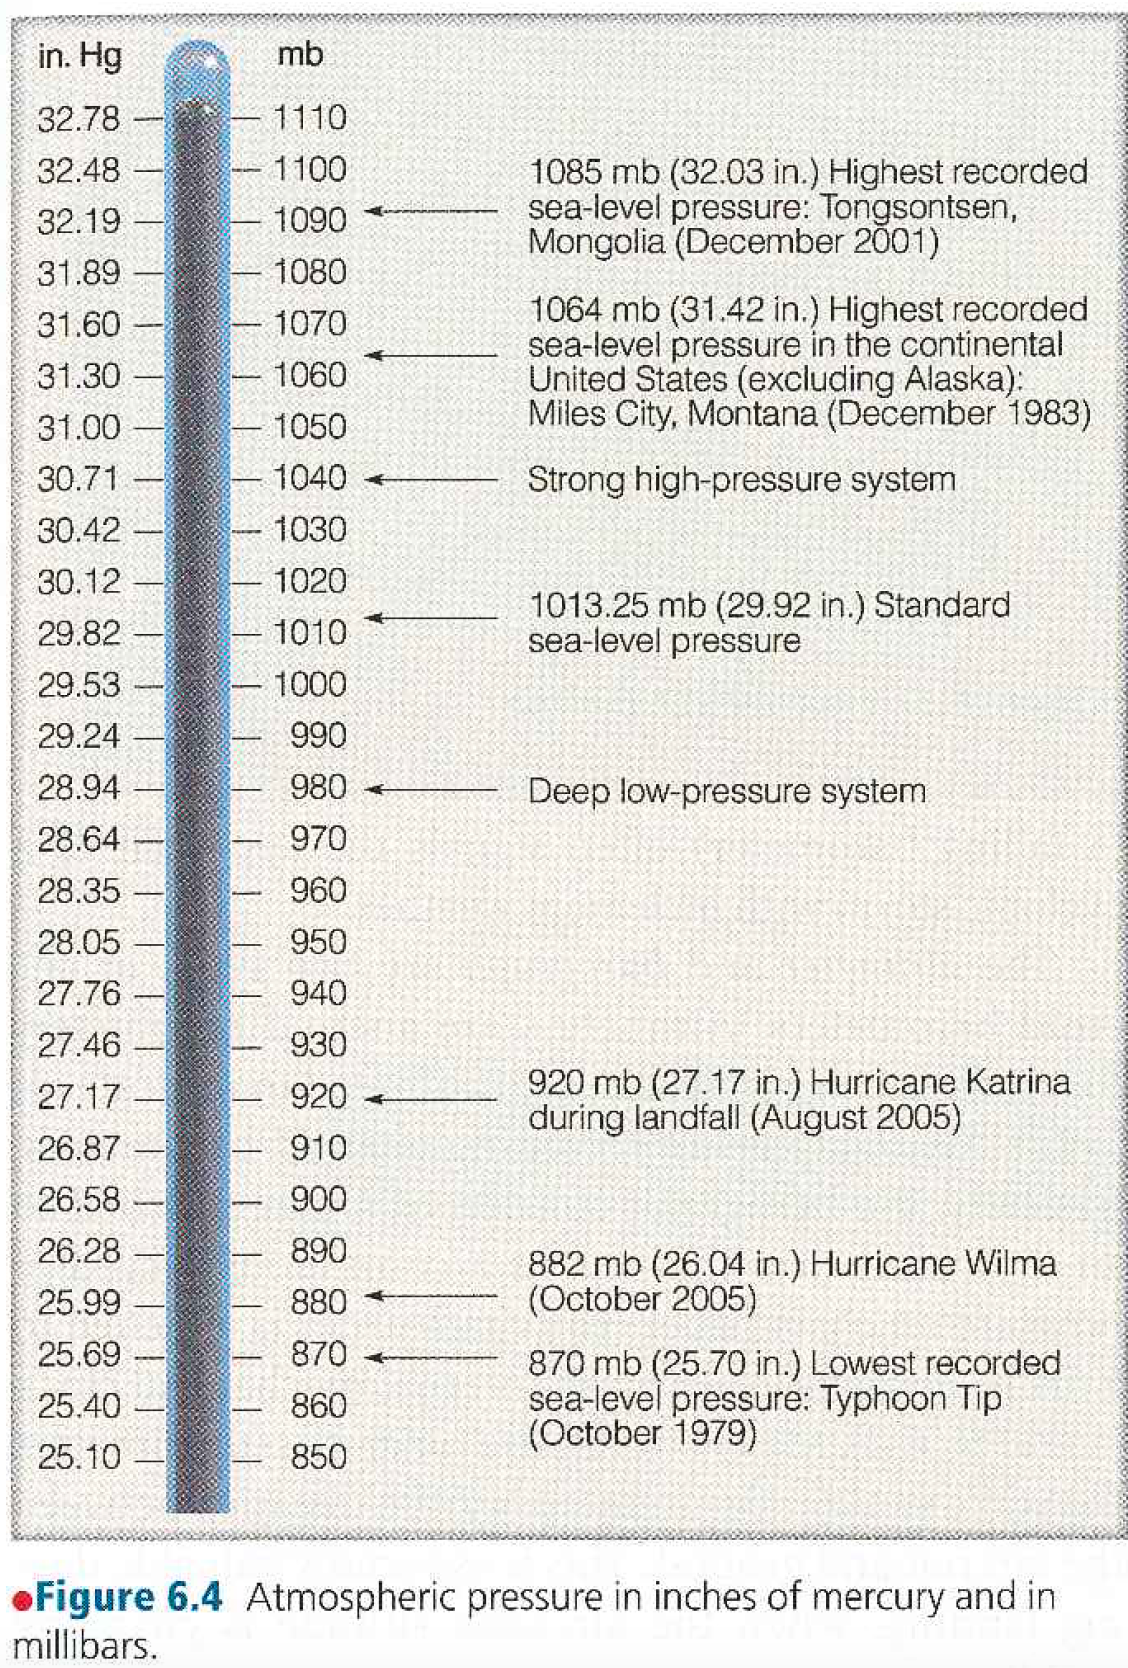
Fig. 6.4 (Atmospheric pressure normal and extremes)
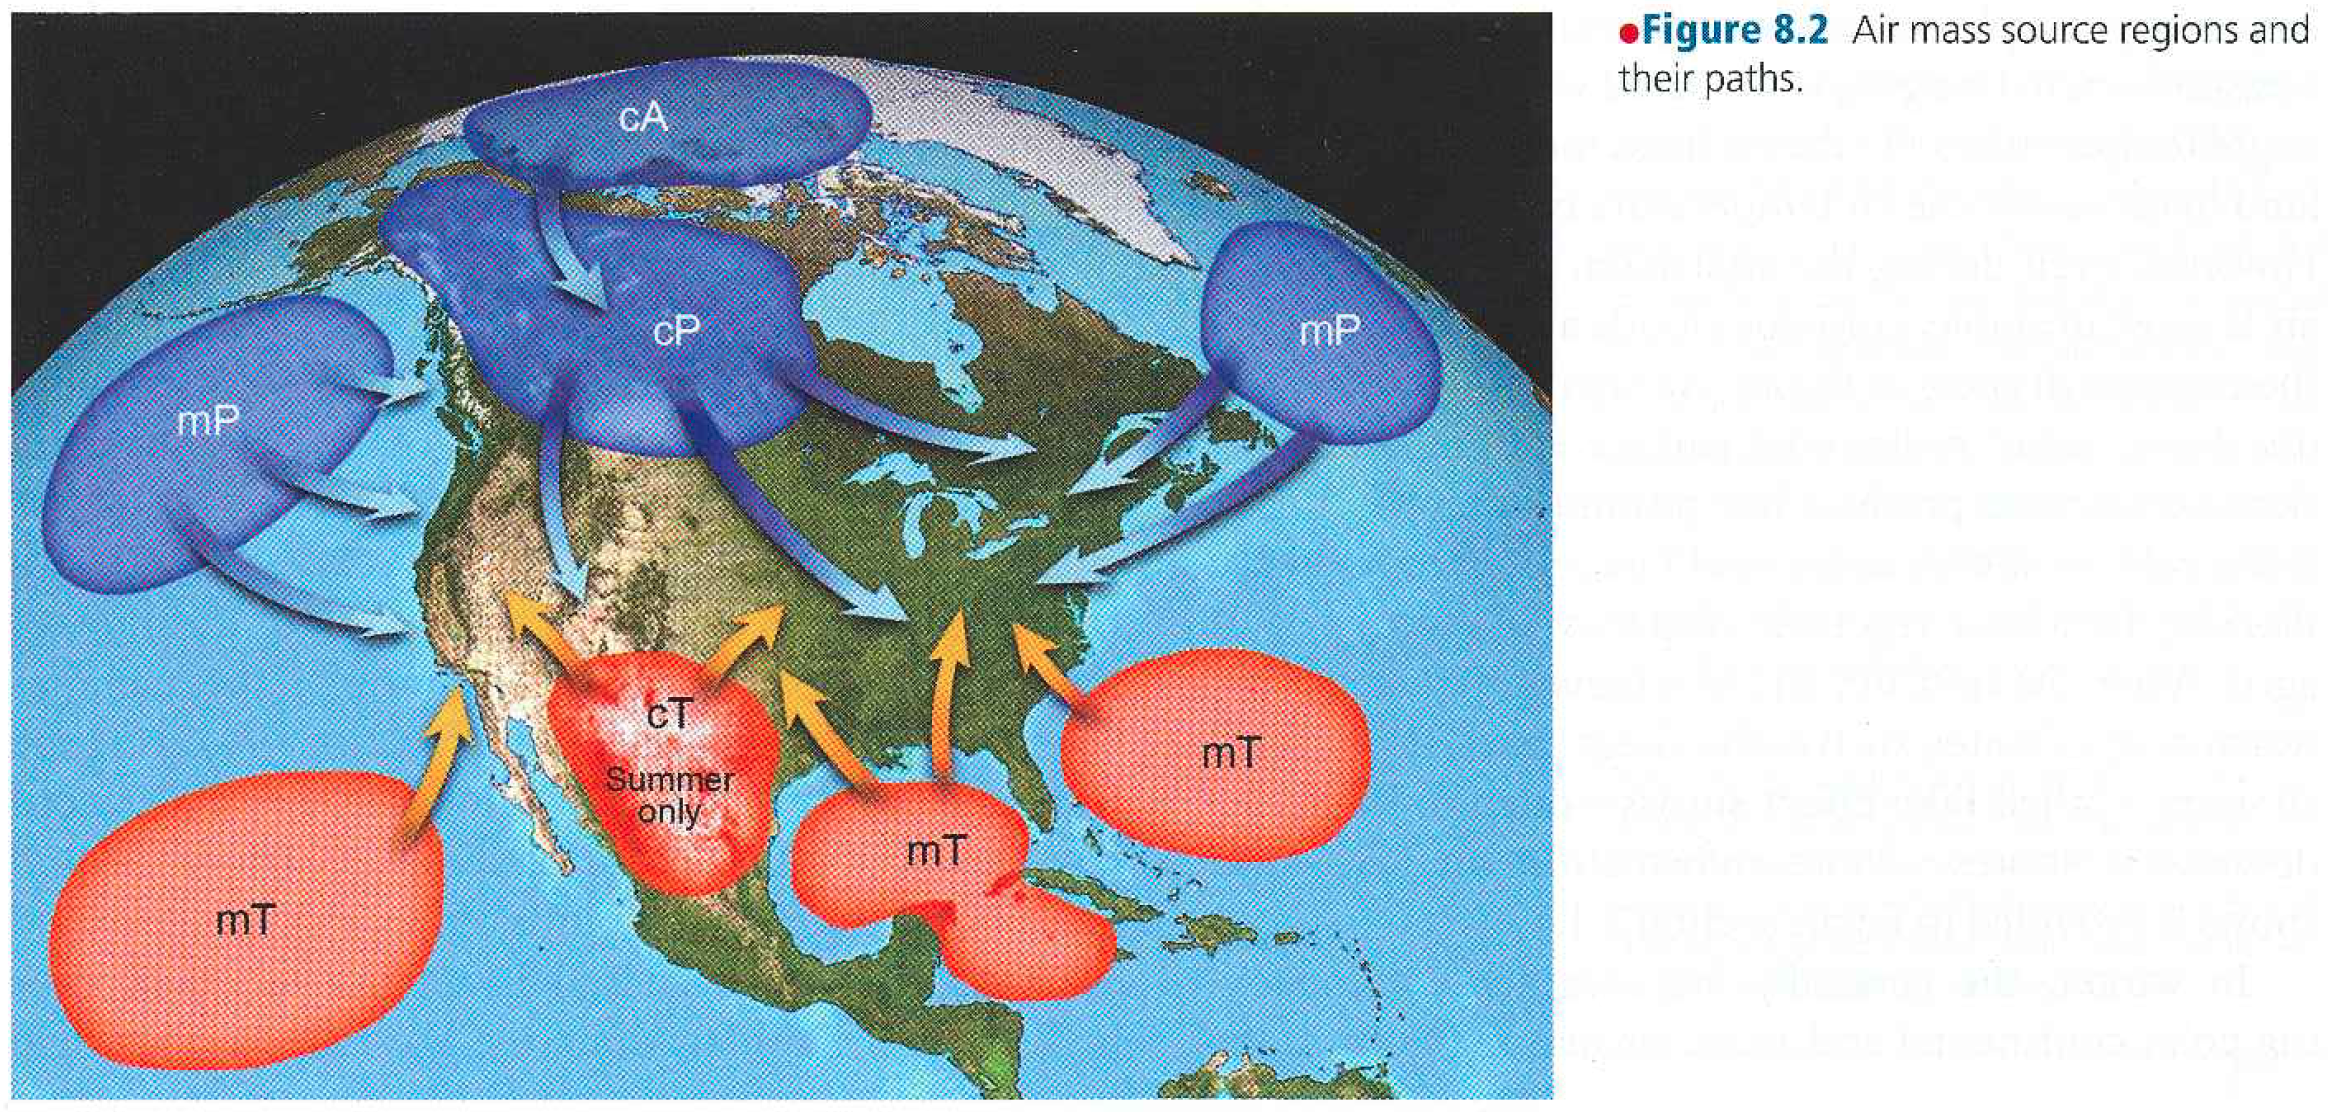
Fig. 8.2 (Air mass source regions)
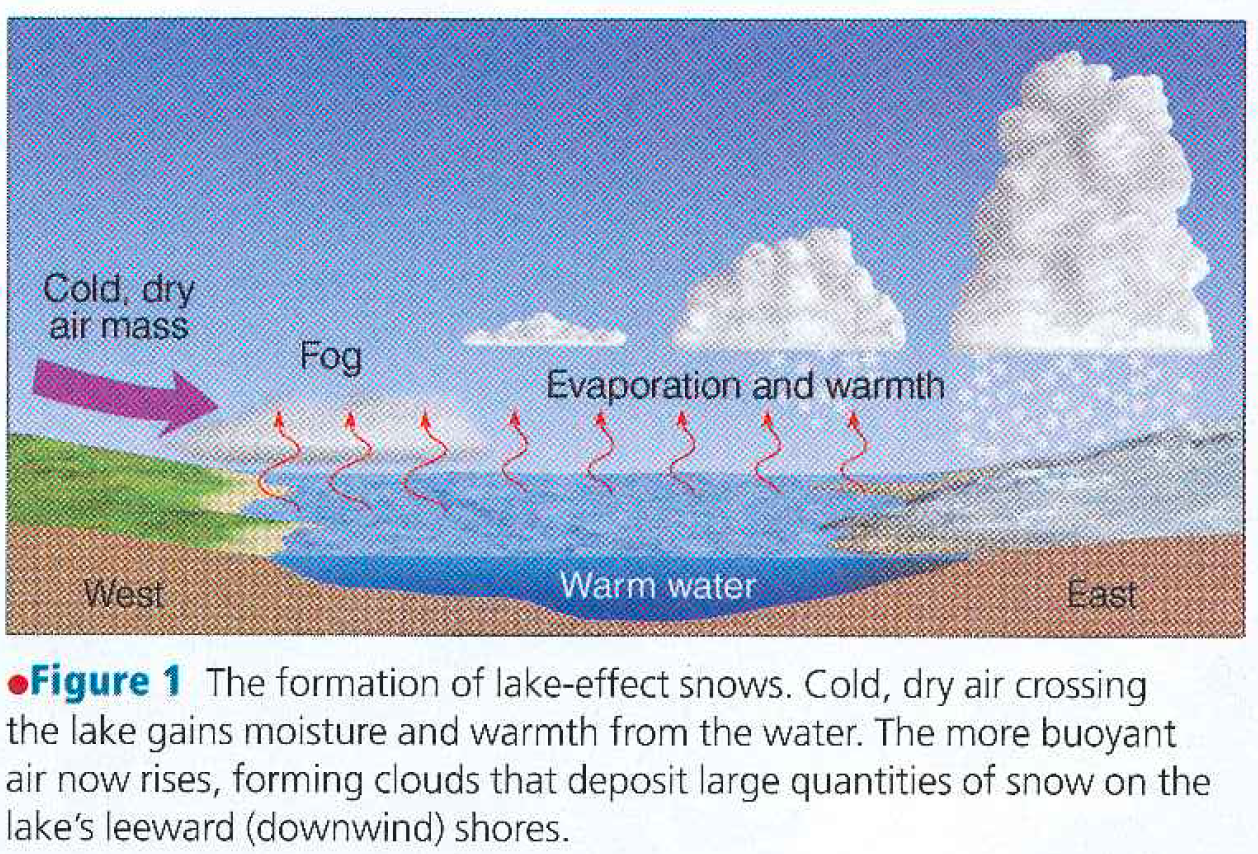
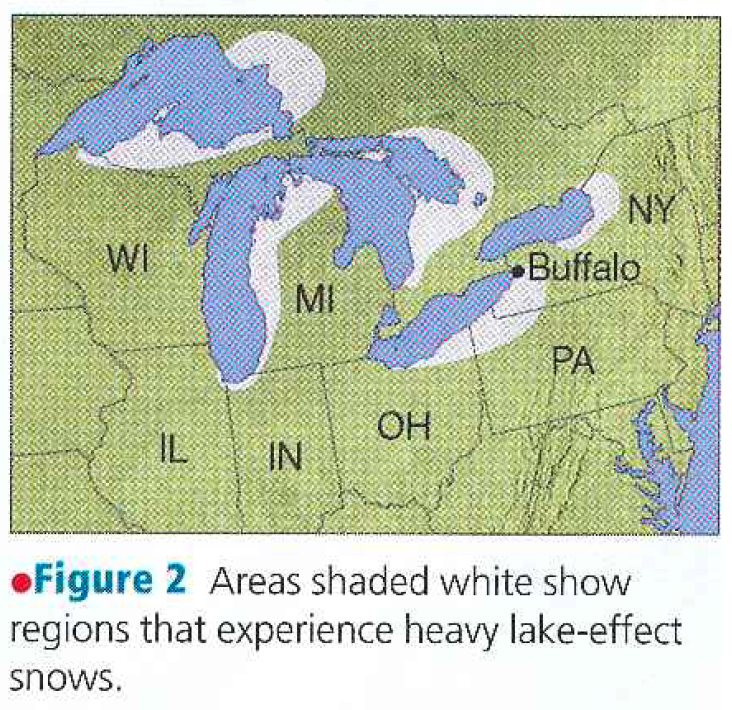
Fig. 1 and 2 on p. 227 (lake effect snow); thundersnow; Buffalo lake effect snowstorm
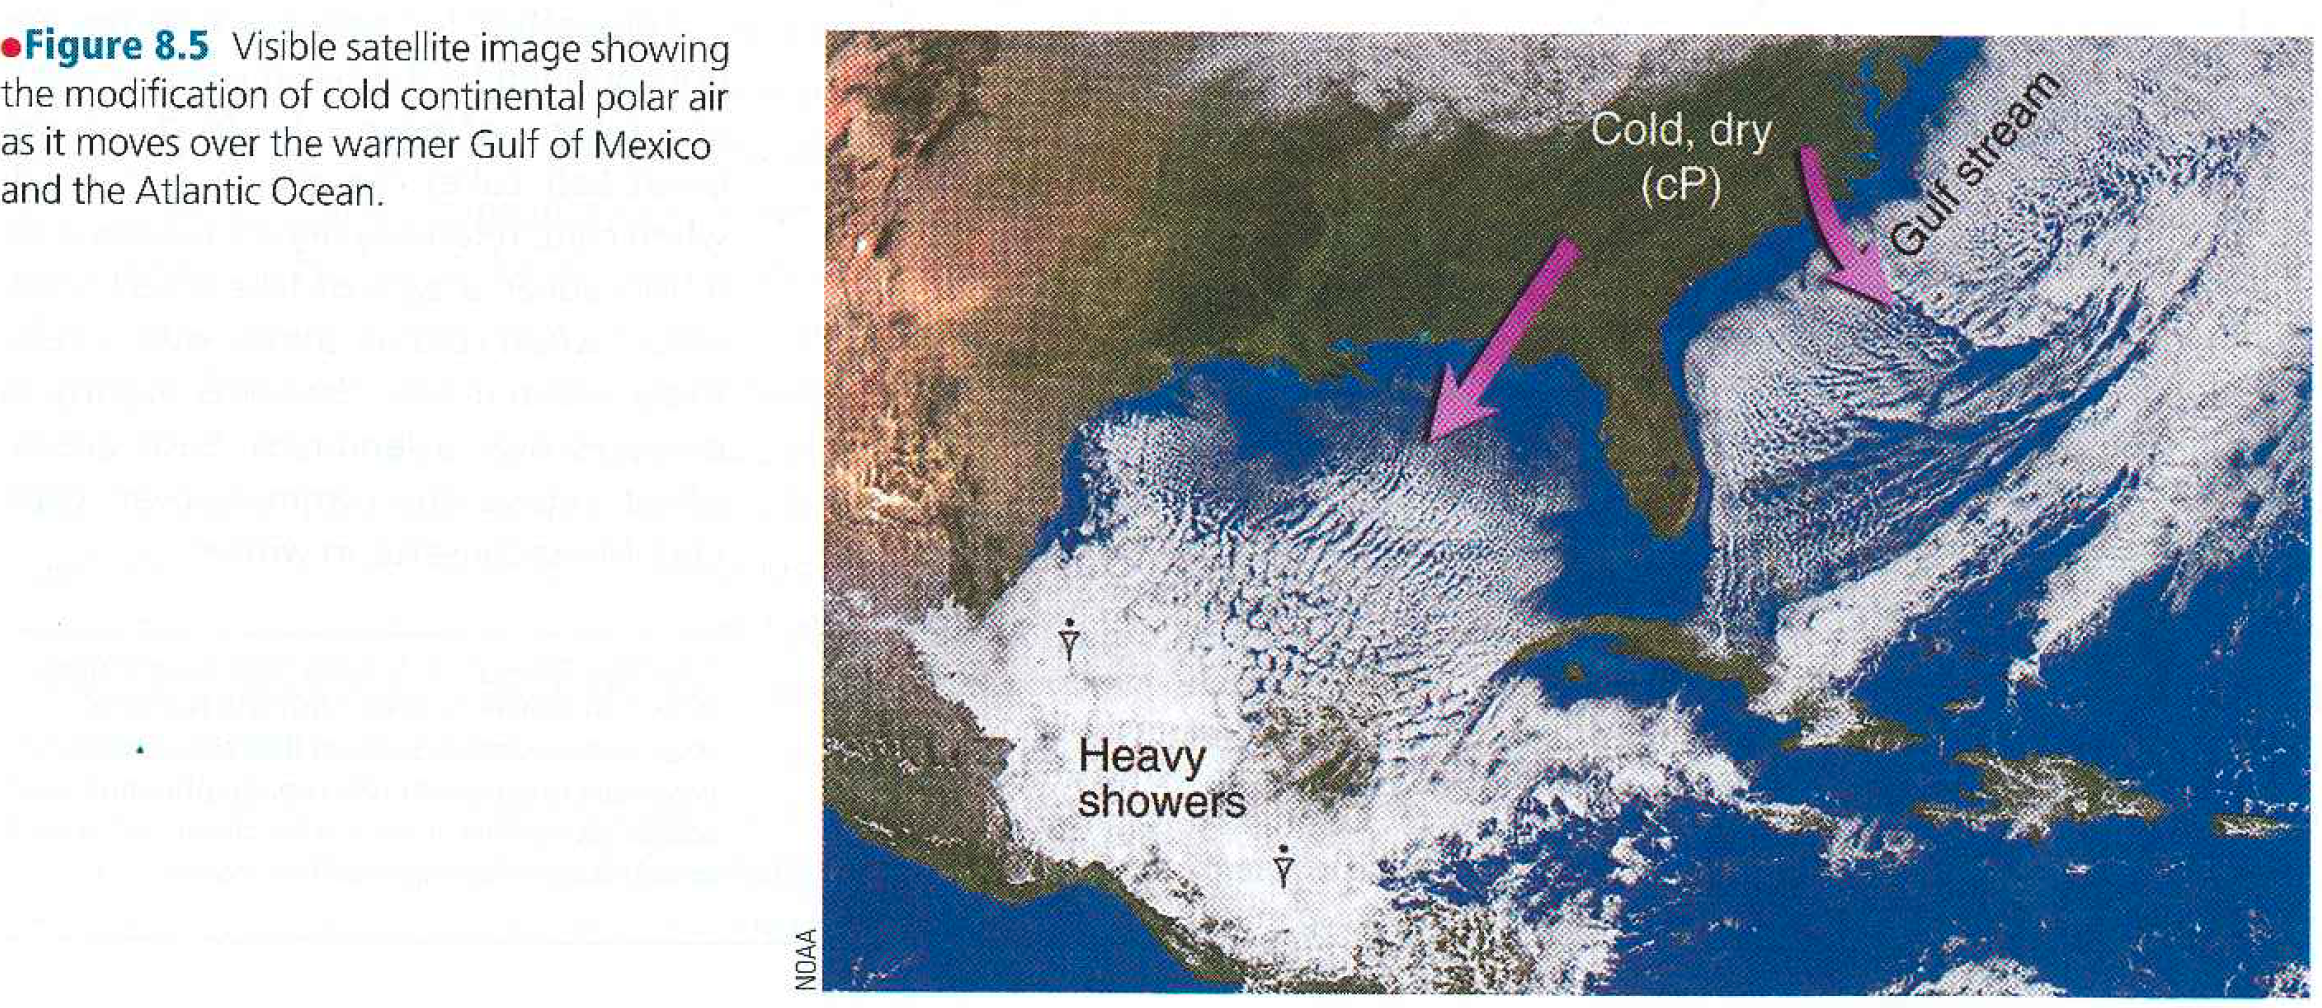
Fig. 8.5 (shallow convection); coastal cyclone
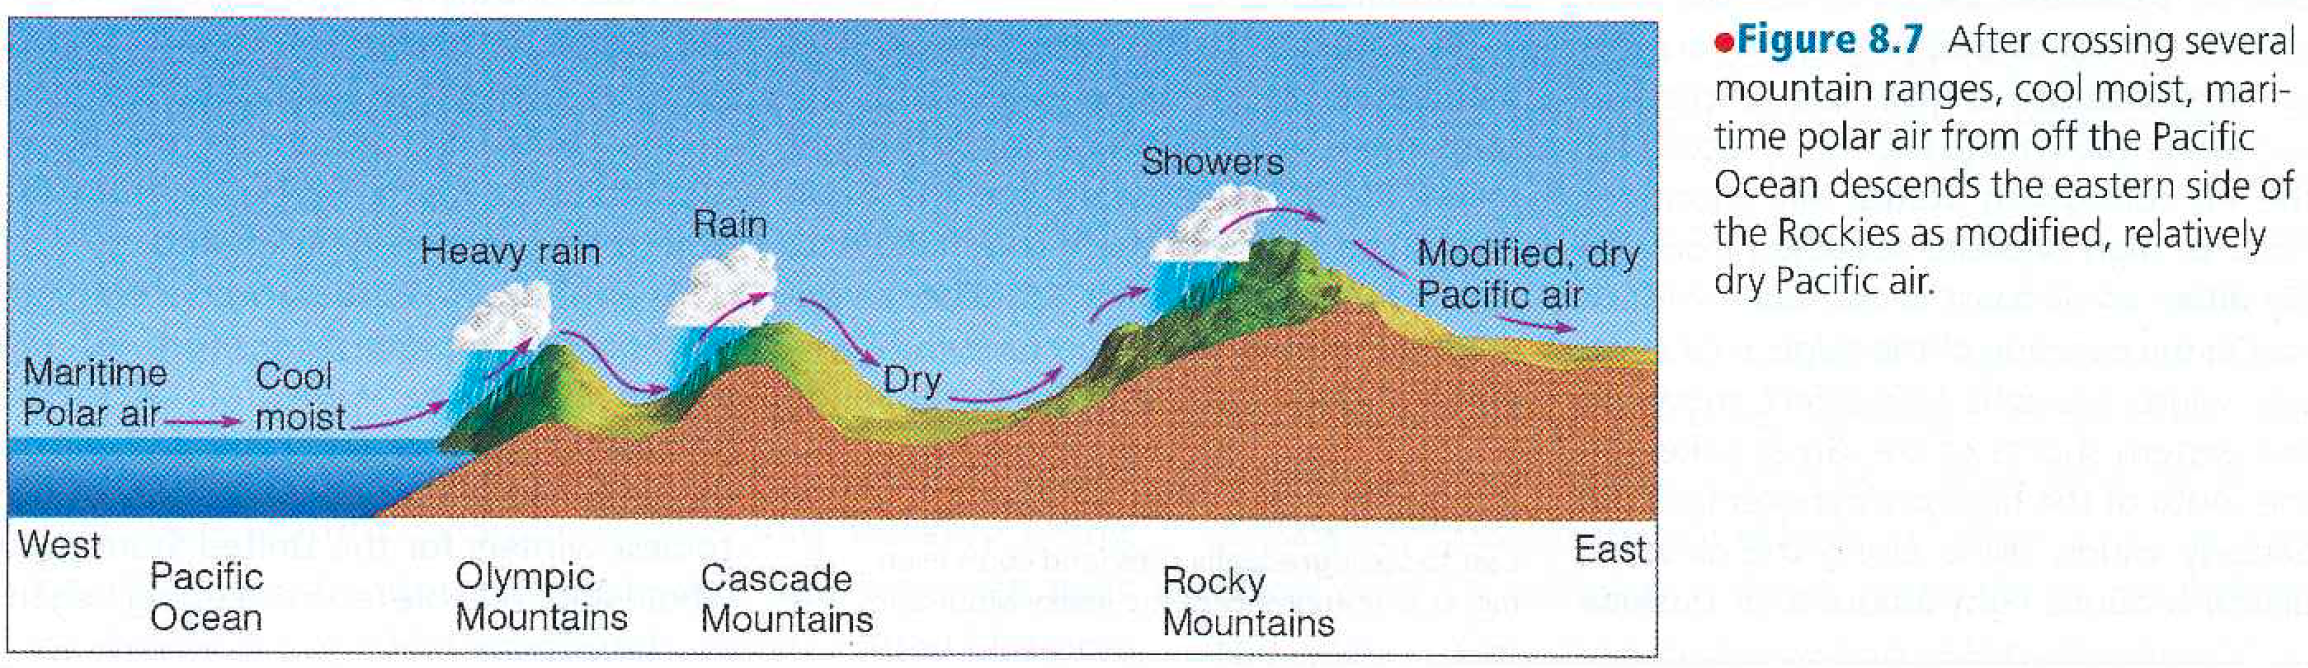
Fig. 8.7 (mP air over Intermountain West)
Fig. 8.9 (atmospheric river)
Fig. 8.10 (flood damage)
Fig. 8.26 (family of cyclones)
Map
of 500 mb height and water vapor