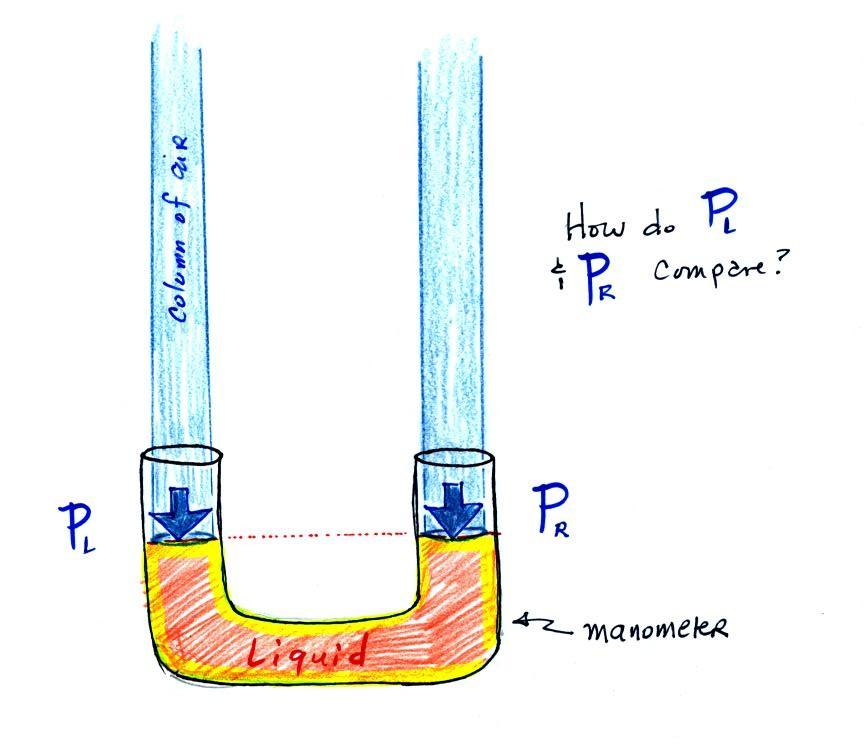
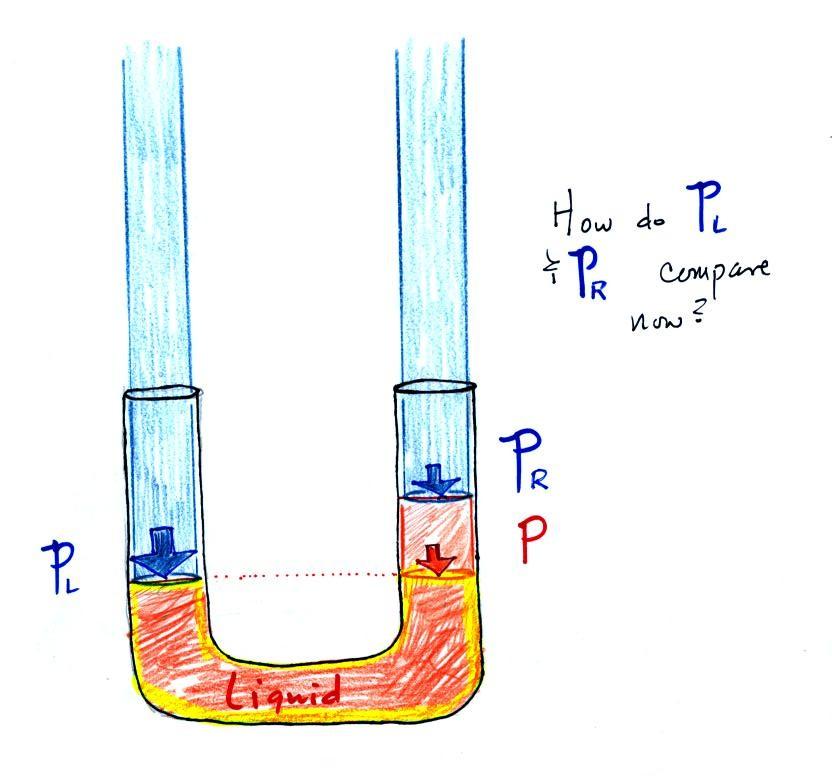
The instrument in the left figure above ( a
u-shaped glass tube filled with a liquid of some kind)
is actually called a manometer and can be used to
measure pressure difference. The two ends of
the tube are open so that air can get inside and air
pressure can press on the liquid. Given that the
liquid levels on the two sides of the manometer
are equal, what could you say about PL and PR?
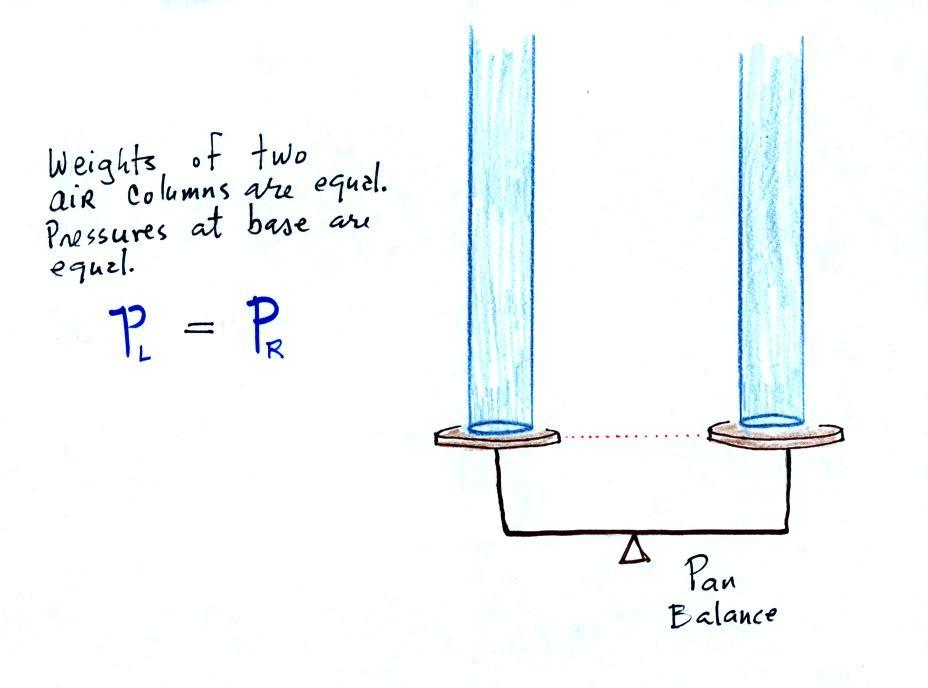
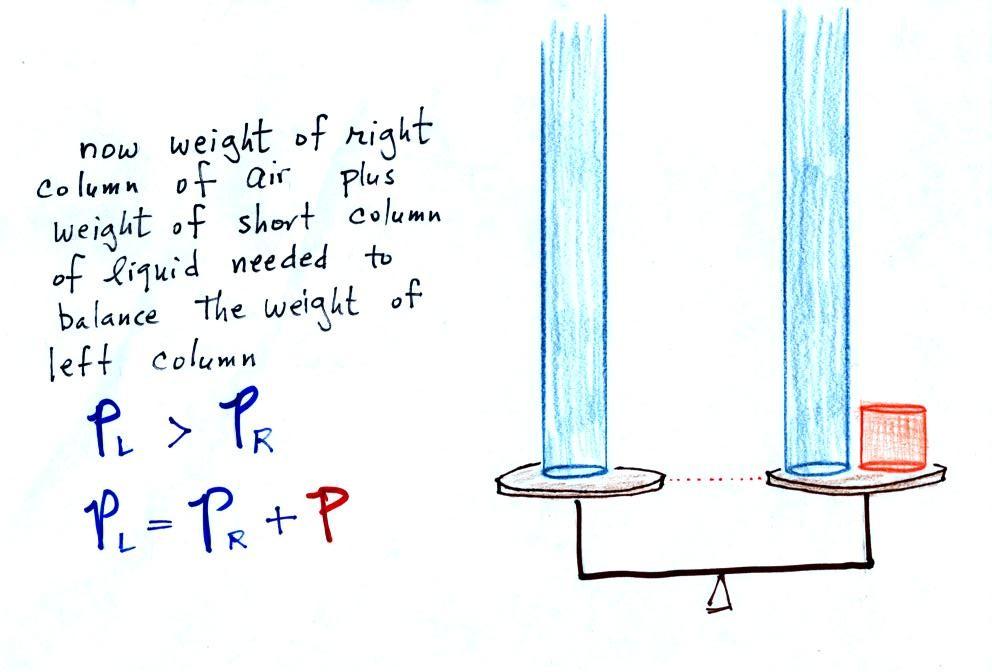
The liquid can slosh back and forth just like
the pans on a balance can move up and down. A
manometer really behaves just like a pan balance
(pictured above at right) or a teeter totter (seesaw).
Because the two pans are in balance, the two columns of
air have the same weight. PL and PR are equal.
Note: you don't really know what either pressure is,
just that they are equal).
 |
|
Now the situation is a
little different, the liquid levels are no longer
equal. You probably realize that the air pressure on
the left, PL, is a
little higher than the air pressure on the right, PR. PL is now being balanced
by PR + P acting together. P is the pressure produced by
the weight of the extra fluid on the right hand side of the
manometer (the fluid that lies above the dotted line).
The height of the column of extra liquid provides a
measure of the difference between PL and PR.
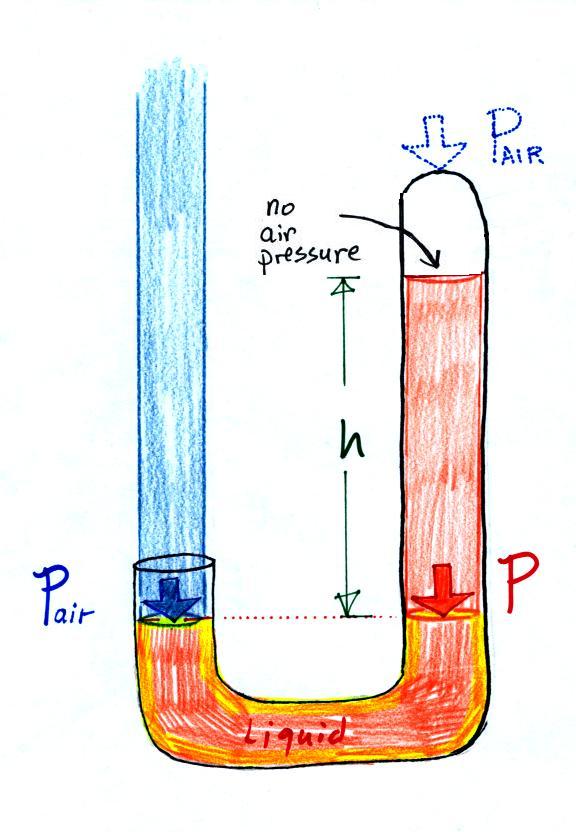
Next we will just go and close off the right hand side of
the manometer.
|
|
Air pressure can't get
into the right tube any more. Now at the level of
the dotted line the balance is between Pair and P (pressure by the extra
liquid on the right). If Pair changes, the height
of the right column, h, will change. You now
have a barometer, an instrument that can measure and
monitor the atmospheric pressure.
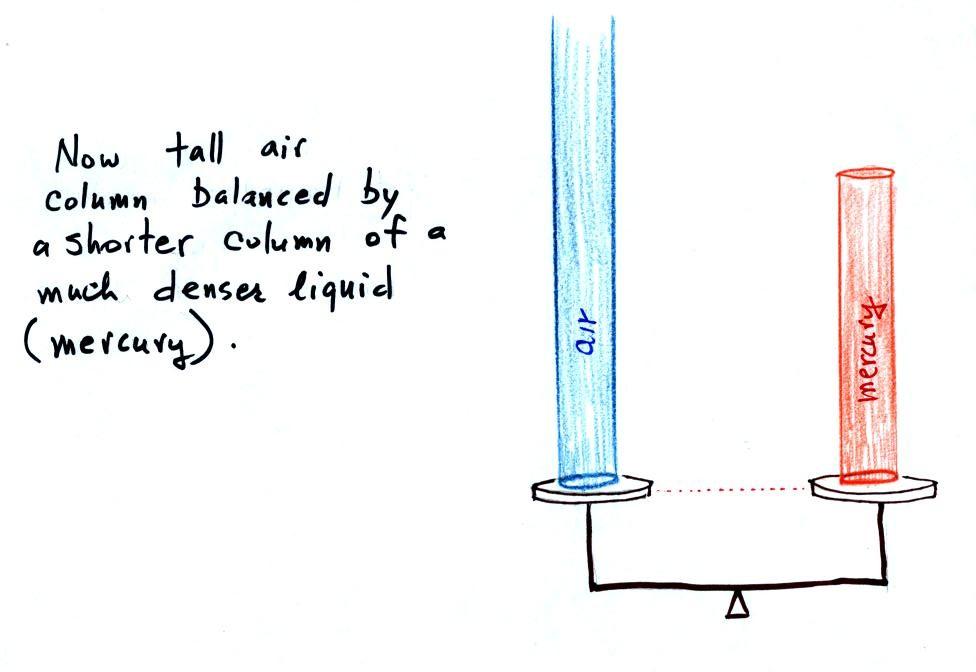
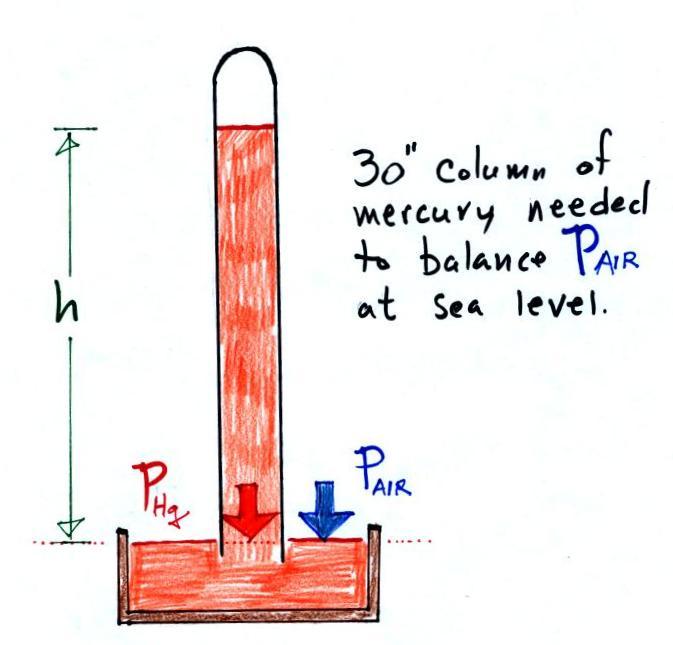
Barometers like this are usually filled with
mercury. Mercury is a liquid. You need a
liquid that can slosh back and forth in response to
changes in air pressure. Mercury is also very dense
which means the barometer won't need to be as tall as if
you used something like water. A water barometer
would need to be over 30 feet tall. With mercury you
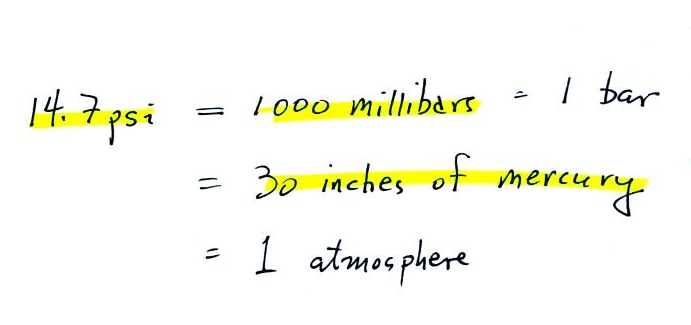
will need only a 30 inch tall column to balance the
weight of the atmosphere at sea level under normal
conditions (remember the 30 inches of mercury pressure
units mentioned earlier). Mercury also has a low
rate of evaporation so you don't have much mercury gas at
the top of the right tube (there's some gas, it doesn't
produce much pressure, but it would be hazardous you if
you were to start to breath it).
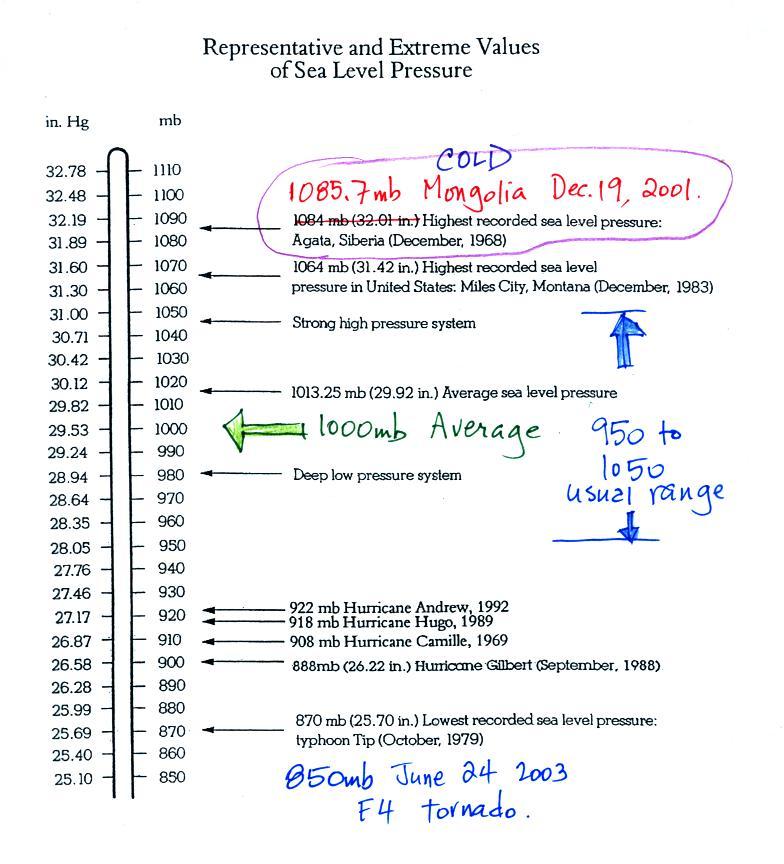
Average and extreme sea level pressure values
Average sea level atmospheric pressure is about 1000 mb.
The figure above (p. 30 in the photocopied Class Notes) gives
1013.25 mb but 1000 mb is close enough in this class.
The actual pressure can be higher or lower than this average
value and usually falls between 950 mb and 1050
mb.
The figure also includes record high and low pressure
values. Record high sea level pressure
values occur during cold weather. The TV
weather forecast will often associate hot weather with high
pressure. They are generally referring to upper level
high pressure (high pressure at some level above the ground)
rather than surface pressure. You'll
sometimes here this upper level high pressure referred to as a
ridge, we'll learn more about this later in the semester.
There is some question about the accuracy of the 1085.7 mb
value above. The problem is that the pressure was
measured at over 5000 feet altitude and a calculation was
needed to figure out what the pressure would have been if the
location were at sea level. That calculation can
introduce uncertainty. But you don't really need to be
concerned with all that, I just wanted to give you an idea of
how high sea level pressure can get.
Most of the record low pressure values have all been set by
intense hurricanes. Hurricane Wilma in 2005 set a new
record low sea level pressure reading for the Atlantic, 882
mb. Hurricane Katrina had a pressure of 902 mb.
The following table lists some of the information on hurricane
strength from p. 146a in the photocopied ClassNotes.
2005 was a very unusual year, 3 of the 10 strongest N.
Atlantic hurricanes ever occurred in 2005.
Most
Intense North Atlantic Hurricanes
|
Most
Intense Hurricanes
to hit the US Mainland
|
Wilma
(2005) 882 mb
Gilbert (1988) 888 mb
1935 Labor Day 892 mb
Rita (2005) 895 mb
Allen (1980) 899
Katrina (2005) 902
|
1935
Labor Day 892 mb
Camille (1969) 909 mb
Katrina (2005) 920 mb
Andrew (1992) 922 mb
1886 Indianola (Tx) 925 mb |
What makes hurricanes so intense is the pressure gradient,
i.e. how quickly pressure changes with distance (horizontal
distance). Pressure can drop from near average values
(1000 mb) at the edges of the storm to the low values shown
above at the center of the storm. This large pressure
gradient is what causes the strong winds found in a hurricane.
The 850 mb pressure value measured in 2003 inside a strong
tornado in Manchester, South Dakota (F4 refers to the Fujita
scale rating, F5 is the highest level on the scale).
This is very difficult (and very dangerous) thing to try to
do. Not only must the instruments be built to survive a
tornado but they must also be placed on the ground ahead of an
approaching tornado and the tornado must then pass over the
instruments (also the person placing the instrument needs to
get out of the way of the approaching tornado).
You can experience much lower pressure values than shown above
(roughly 700 mb) by just driving up to Mt. Lemmon.
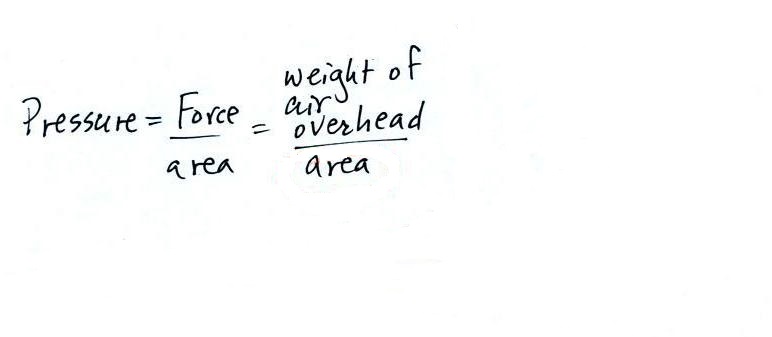
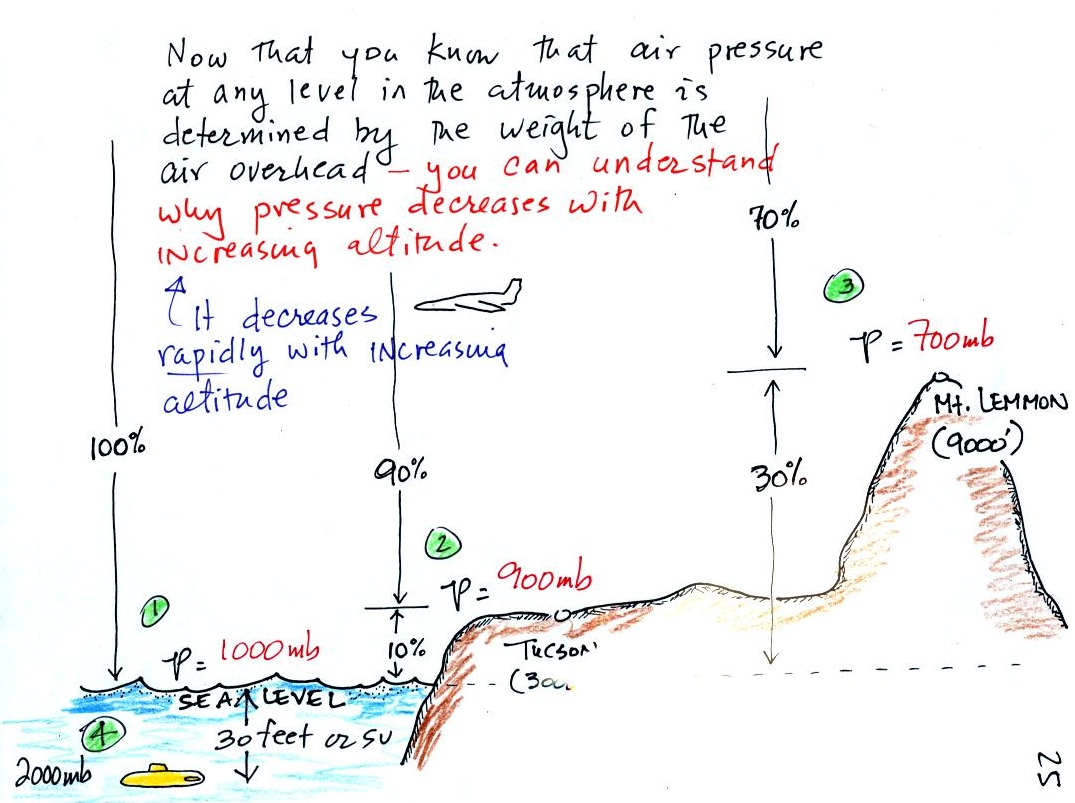
Changes in atmospheric pressure with altitude
If you remember and understand the statement
atmospheric
pressure at any level in the atmosphere
depends on (is determined by)
the
weight of the air overhead
You can quickly and easily figure out what happens to air
pressure as you move upward in the atmosphere. A
pile of bricks can also help; here's
a picture of 5 bricks stacked on top of each
other.
Each of the bricks weighs 5 pounds, there's a
total of 25 pounds of weight. At
the bottom of the pile you would measure a weight of
25 pounds. If you moved up a brick you would
measure a weight of 20 pounds, the weight of the four
bricks that are still above. The pressure would
be less. Weight and pressure will decrease as
you move up the pile.
Layers
of air in the atmosphere is not too
much different from a pile of
bricks. Pressure at any level is
determined by the weight of the air
still overhead. Pressure
decreases with increasing altitude
because there is less and less air
remaining overhead.
At sea level altitude, at Point 1, the
pressure is normally about 1000 mb. That is
determined by the weight of all (100%) of the air in
the atmosphere.
Some parts of Tucson, at Point 2, are 3000
feet above sea level (most of central Tucson is a
little lower than that around 2500 feet). At
3000 ft. about 10% of the air is below, 90% is still
overhead. It is the weight of the 90% that is
still above that determines the atmospheric pressure
in Tucson. If 100% of the atmosphere produces a
pressure of 1000 mb, then 90% will produce a pressure
of 900 mb.
Pressure is typically about 700 mb
at the summit of Mt. Lemmon (9000 ft. altitude at Point 3) because
70% of the atmosphere is overhead..
Pressure decreases rapidly
with increasing altitude. We will find that
pressure changes more slowly if you move
horizontally. Pressure changes about 1 mb for
every 10 meters of elevation change. Pressure
changes much more slowly normally if you move
horizontally: about 1 mb in 100 km. Still the
small horizontal changes are what cause the wind to
blow and what cause storms to form.
Point
4 shows a submarine at a depth of about 30
ft. or so. I didn't
point this out in class. The pressure
there is determined by the weight of the air and the
weight of the water overhead. Water is much
denser and much heavier than air. At 30 ft., the
pressure is already twice what it would be at the
surface of the ocean (2000 mb instead of 1000 mb).
I'll try to show a short video segment about what would happen
to a human head if it were taken down to a depth of 10,000
feet in the ocean where the surrounding pressure is
enormous.
I learned about a relatively new sport called free diving
as semester or two ago. Basically divers see how deep
they can go while holding their breath. They must
descend and return to the surface on just a single lungful of
air. It is a very hazardous sport. Here is a link
to an article about a diver that made it to a depth of 236
feet but died upon reaching the
surface. Death was caused by
the high pressure deep under water forcing fluid from
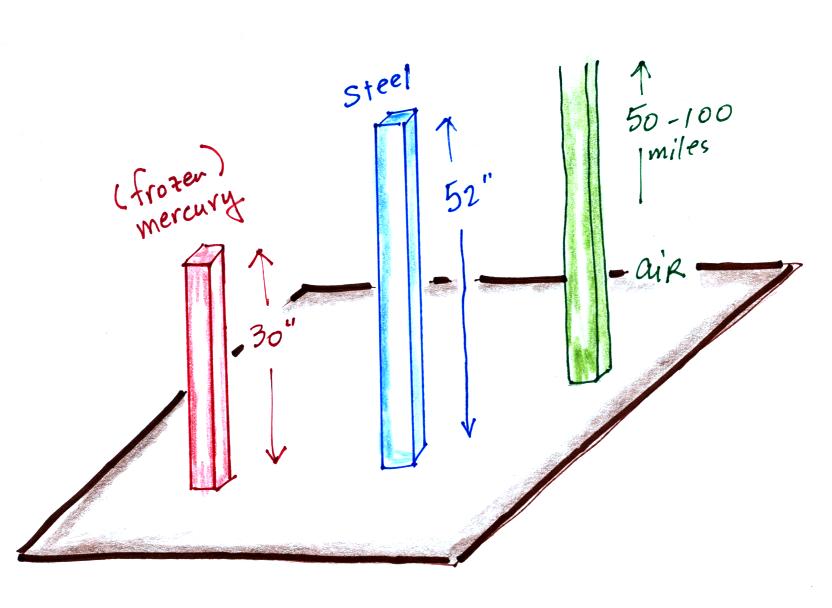
the blood into the diver's lungs.
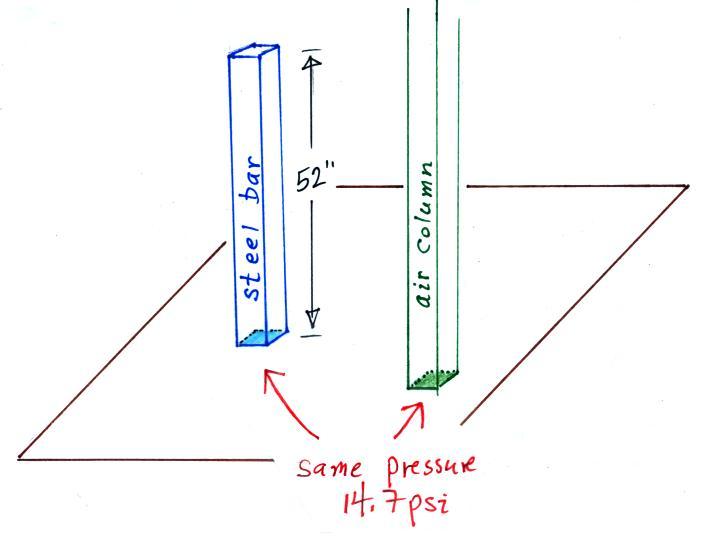
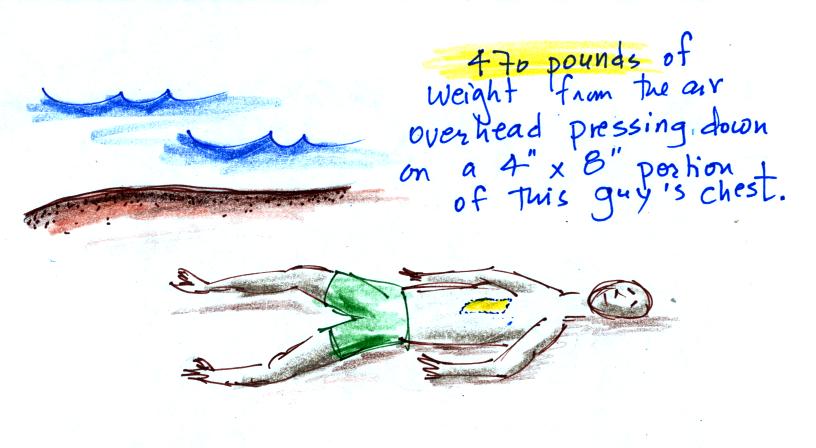
The downward force of air pressure
Sea level pressure, 14.7 psi, might not sound like
much. But when you start to multiply 14.7 by all the
square inches on your body it turns into a lot of pounds of
force.
The yellow box on the person's chest in the picture is a brick
size, 4" x 8" = 32 square inch, area. If you multiply
14.7 psi by 32 sq. in. you get 470 pounds! It would take
a stack of 90 to 100 bricks to produce that much weight.
Why isn't the person in the picture
above crushed by the weight of the atmosphere
above. The answer is that the person's body
pushes back with the same amount of force. Air
does the same thing. This is the topic we will
explore next.
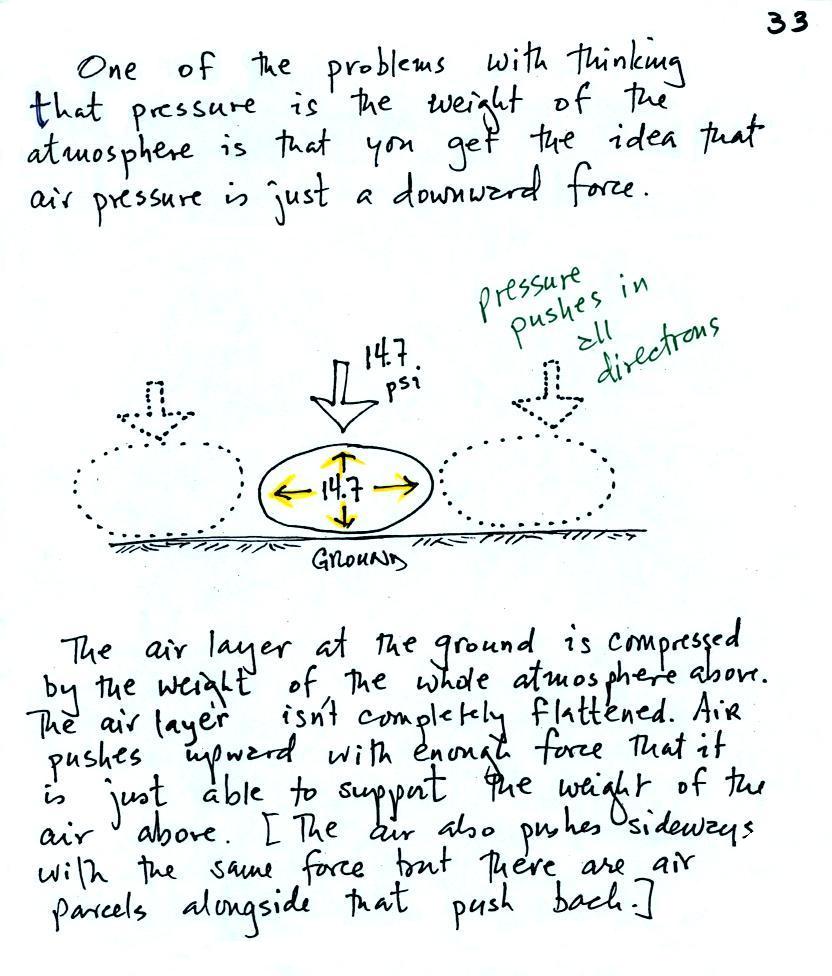
The upward (and sideways) force of air pressure
Air pressure is a force that
pushes downward, upward, and sideways. If you fill a
balloon with air and then push downward on it, you can feel
the air in the balloon pushing back (pushing upward).
You'd see the air in the balloon pushing sideways as
well.
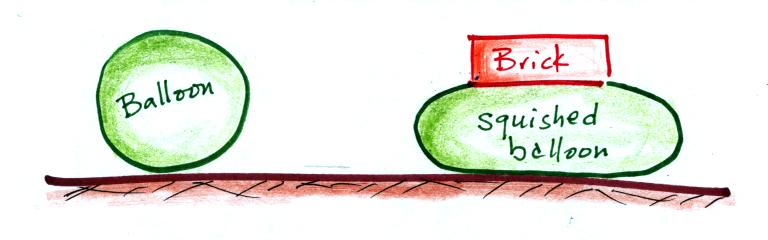
We were able to see this by placing a
brick on top of a balloon. The balloon gets squished
(pushed out sideways) but not flattened. It eventually
pushes upward with enough force to support the brick.
The squished balloon is what air at the bottom of the
atmosphere looks like. And it is supporting more than
just one brick, it is supporting a pile 90 to 100 bricks
tall (just like the yellow box on the chest of the guy at
the beach).
Another helpful
representation of air in the atmosphere might be a
people pyramid.
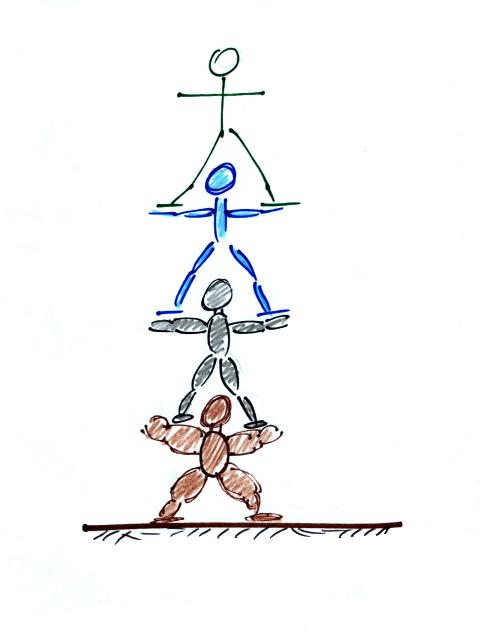
The people in the figure are like
layers of air in the atmosphere all stacked on top of each
other.
If the bottom person in the stack above were standing on a
scale, the scale would measure the total weight of all the
people in the pile. That's analogous to sea level
pressure being determined by the weight of the all the air
above.
The bottom person in the picture above must
be strong enough to support the weight of all the people
above. The bottom layer of the atmosphere pushes
upward with enough pressure to support the weight of the
air above.
Here's probably the most amazing example of air
pressure pushing upward.
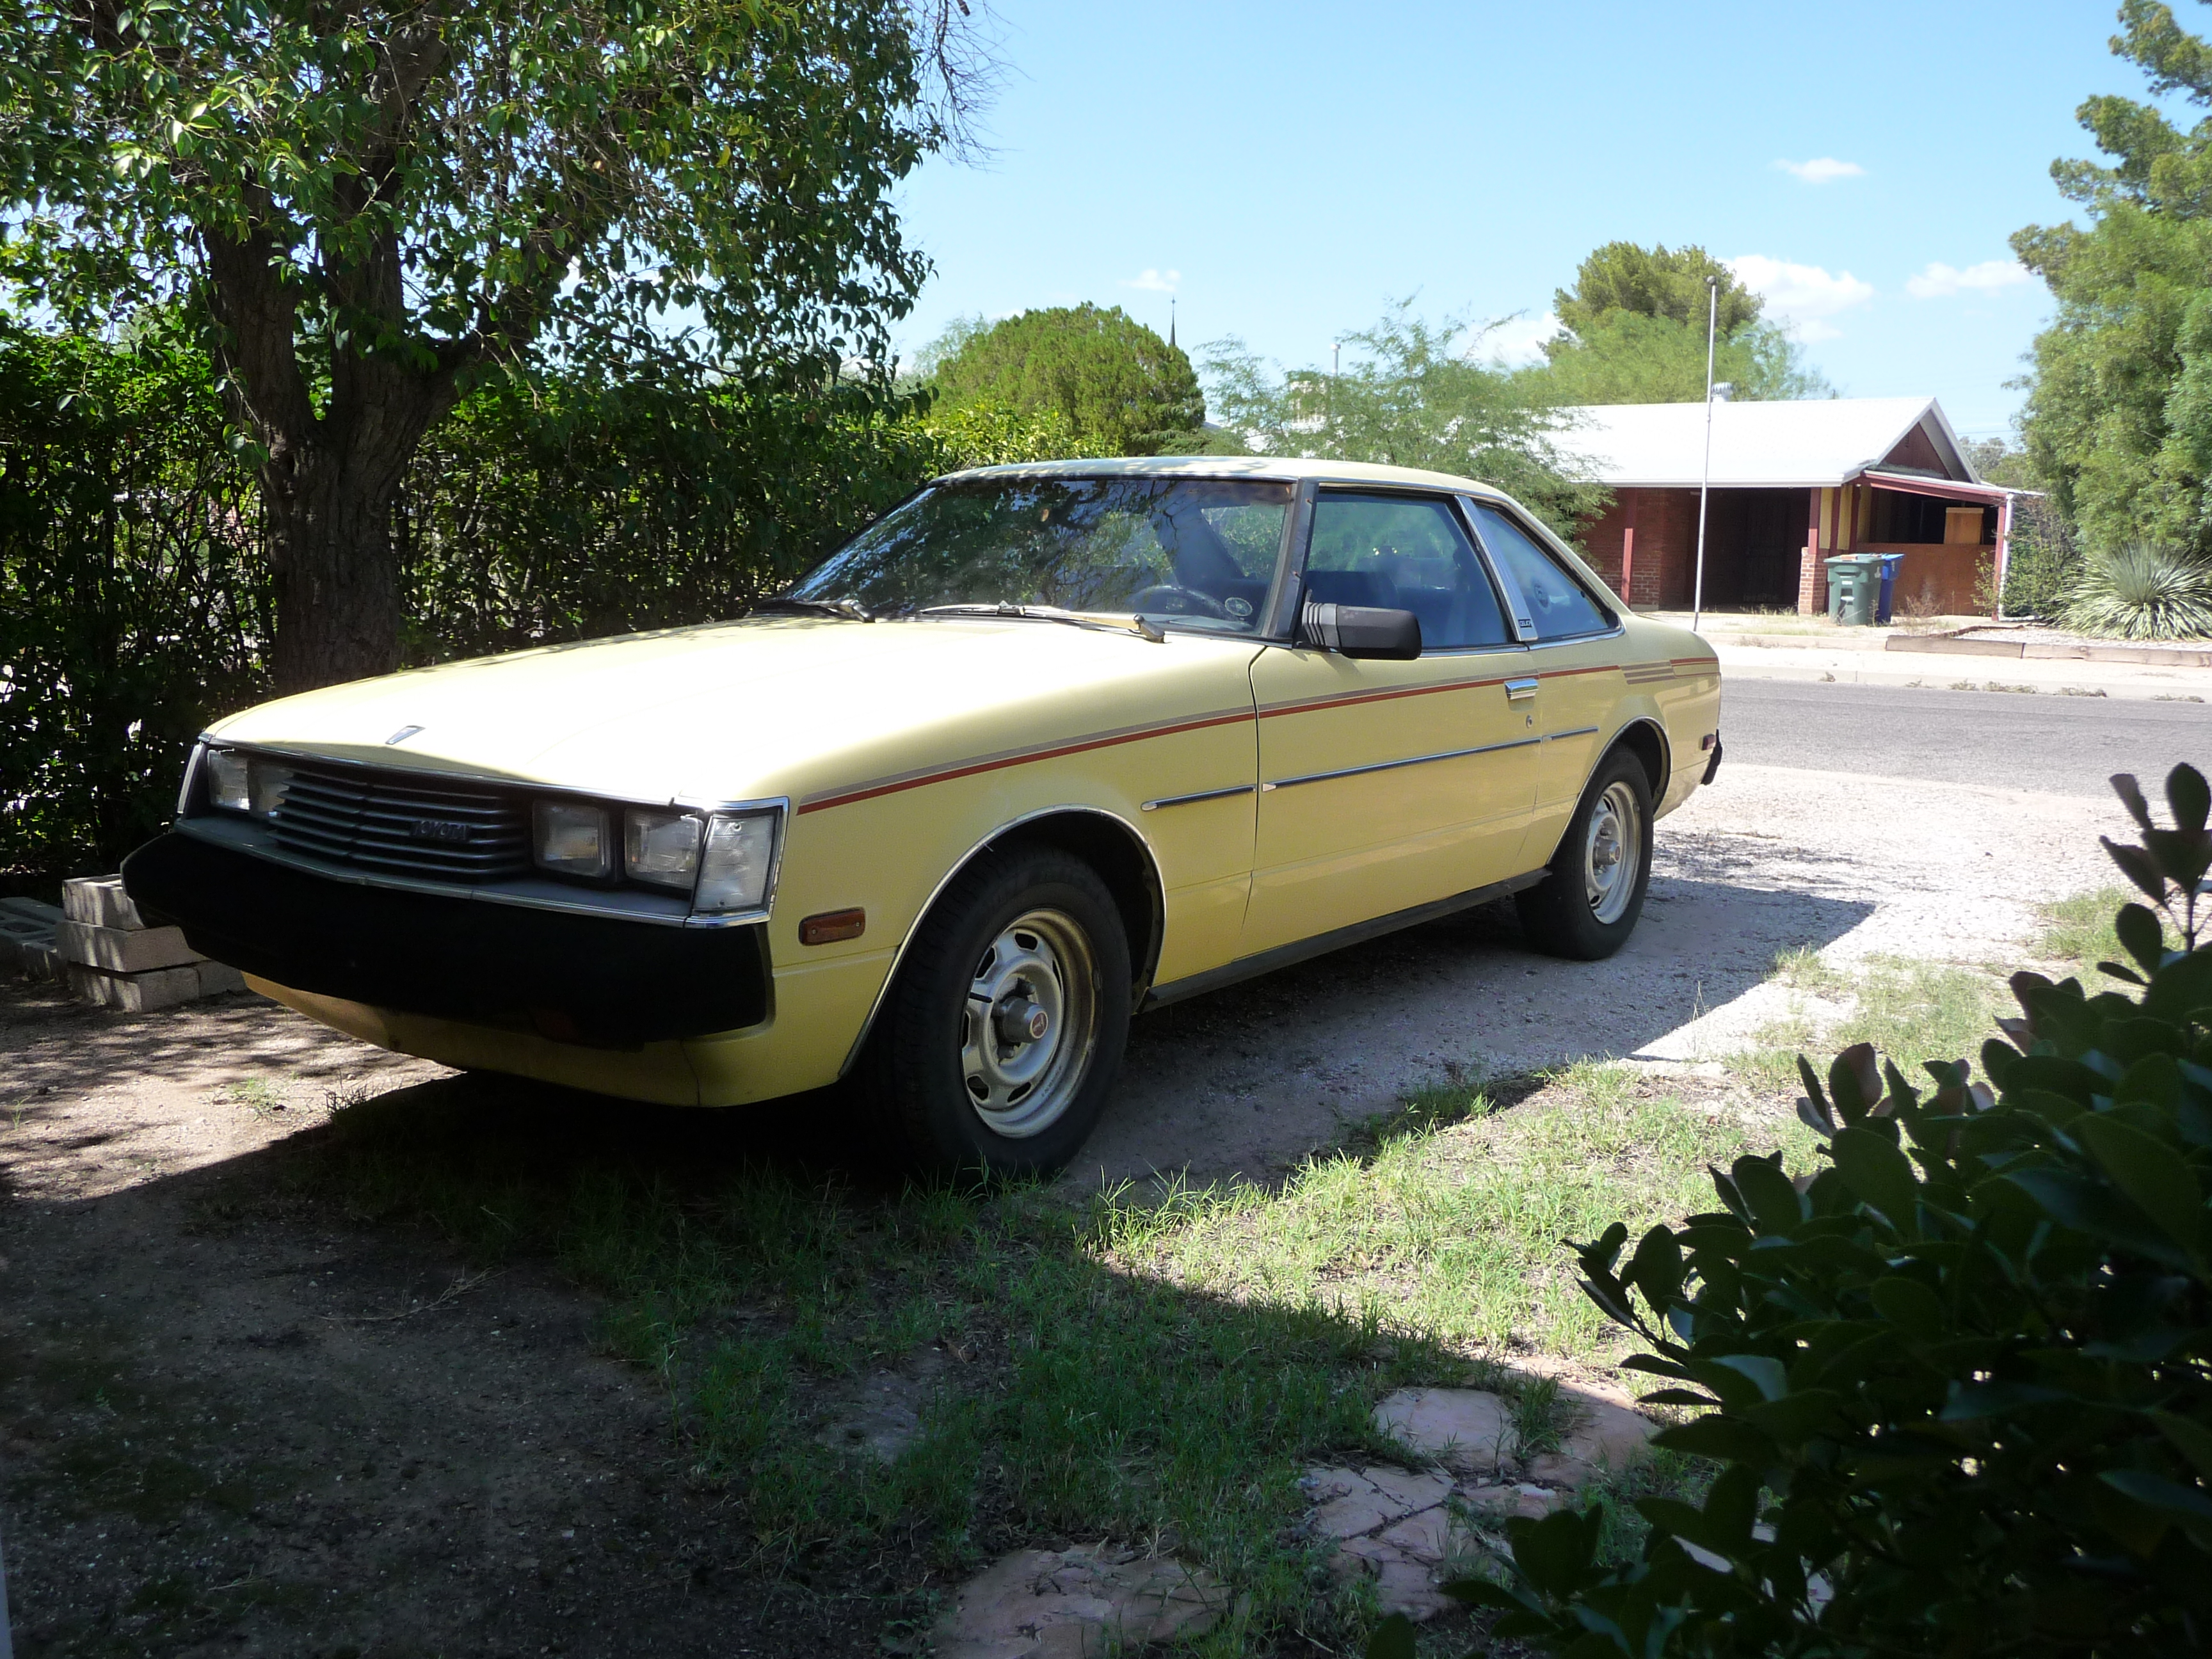
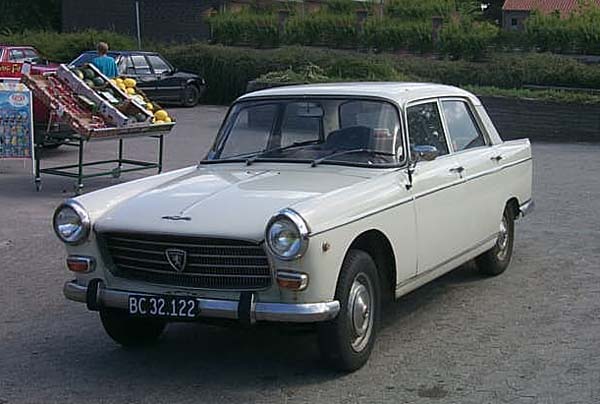
My present day car (a 1980 Toyota Celica) sits on 4
tires, which are really nothing more than balloons. The
air pressure in the four tires pushes upward with
enough force to keep the 1000 or 2000 pound vehicle off the
ground. The air pressure also pushes downward, you'd
feel it if the car ran over your foot. The air also
pushes sideways with a lot of force; tires need to be strong
to keep from exploding or coming off the wheel.
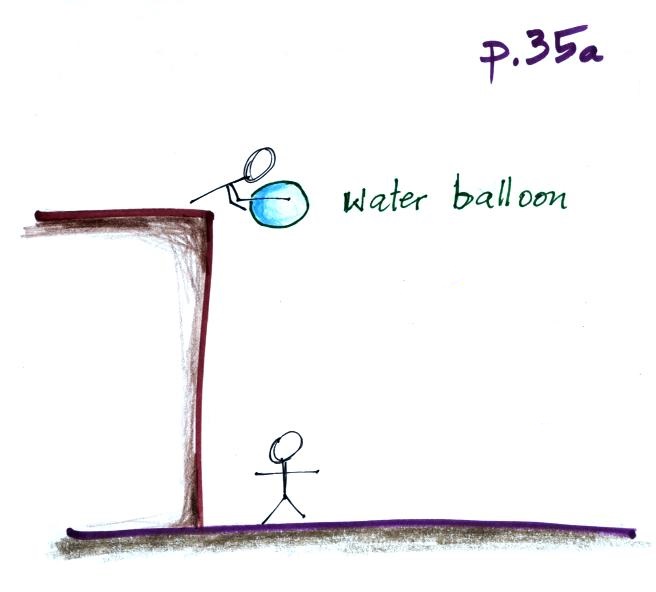
Upward Air Pressure force demonstration
This was a logical point to do a demonstration. A
demo that tries to prove that air pressure really does push
upward as well as downward. Not only that but that the
upward force is fairly strong. The demonstration is
summarized on p. 35a in the ClassNotes.
It's pretty obvious that if you fill a balloon with a
little water and let go it will drop. And most
everyone in the class knows why (see below - I broken the
figure on p. 35b into pieces for clarity).
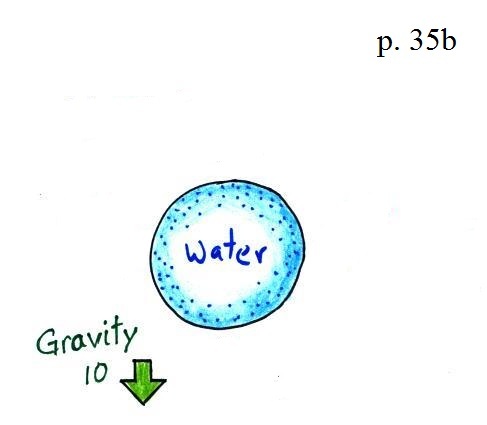
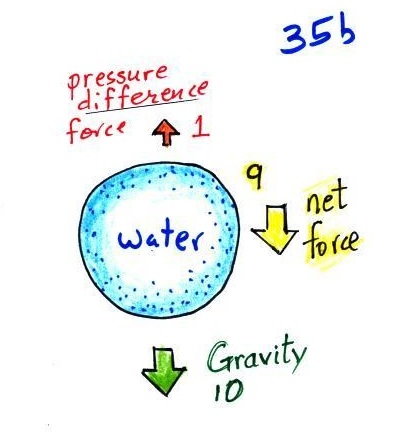
Gravity
exerts a downward force on the balloon. I just
made up a number, 10, to give you some idea of its
strength.
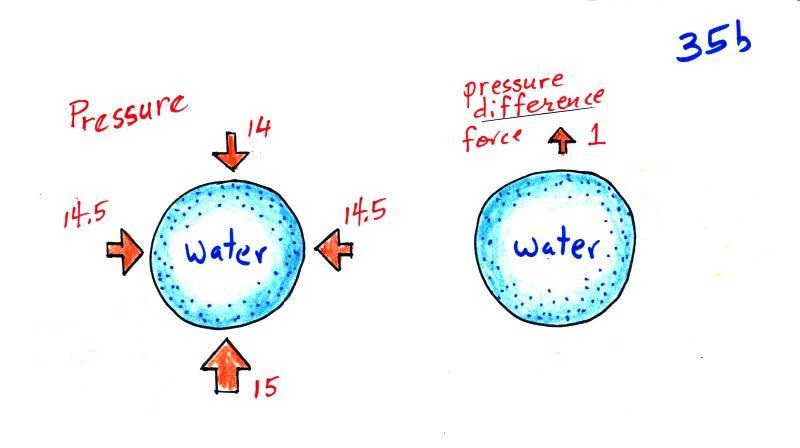
But the picture above isn't quite complete.
The water balloon is surrounded by air that
is pushing upward, downward, and sideways on the
balloon. These pressure
forces are strong but mostly cancel each
other out. The sideways forces do cancel out
exactly.
The up and down forces aren't quite equal because
pressure decreases with increasing altitude. The
upward pointing force at the bottom is stronger (15
units) than the downward force at the top (14
units). They don't cancel and there is a weak upward pressure difference force
(1 unit strong). I'm pretty sure that most people
in the class don't know about this pressure difference
force.
This picture includes
all the forces (gravity and pressure
difference). The downward gravity force is
stronger than the upward pressure difference
force and the balloon falls.
It seems like we could change things
a little bit and somehow keep the upward and
downward pressure forces from working against each
other. We
did that in a class demonstration.
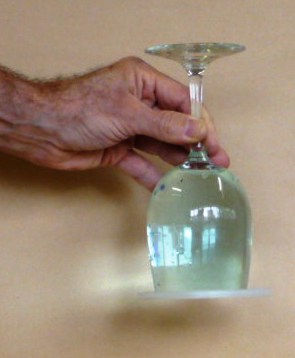
In
the demonstration a wine glass is filled
with water (about the same amount of
water that you might put in a small
water balloon).
A small plastic lid is used to cover the wine glass (you'll
need to look hard to see the lid in the photo above).
The wine glass is then turned upside and the water does not
fall out.
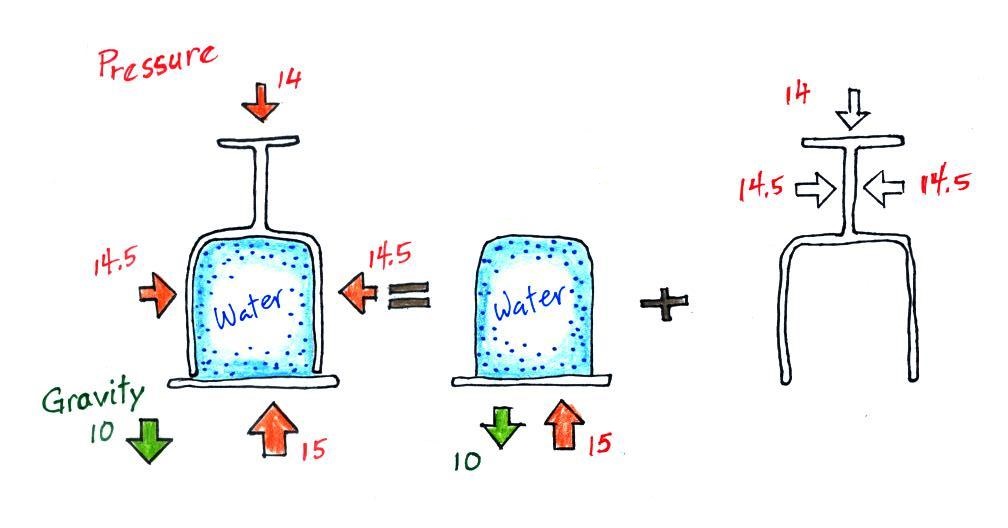
All the same forces are shown again in the left most
figure. We'll split that into two parts - a water and
lid part and an empty glass part.
The 14 units of pressure force is pushing on the glass
now and not the water. I was holding onto the glass,
I'm the one that balanced out this downward pressure force.
Gravity still pulls downward on the water with the same
10 units of force. But with 15 units, the upward
pressure force is able to overcome the downward pull of
gravity. It can do this because all 15 units are used
to overcome gravity and not to cancel out the downward
pointing pressure force.
The Magdeburg hemispheres
experiment (sideways pressure force)
Air pressure pushes downward with hundreds of pounds of
force on someone lying on the beach.
The pressure of the air in tires
pushes upward with enough force to keep a 1 ton automobile
off the ground.
What about the sideways air pressure
force?
Here's a description of a
demonstration that really needs to be done in Arizona
Stadium at half time during a football game. It
involves Magdeburg hemispheres and two teams of horses
(the following quote and the figure below are from an
article in Wikipedia):
" ... Magdeburg hemispheres
are a pair of large copper hemispheres with mating rims,
used to demonstrate the power of atmospheric pressure.
When the rims were sealed with grease and the air was
pumped out, the sphere contained a vacuum and could not
be pulled apart by teams of horses. The Magdeburg
hemispheres were designed by a German scientist and mayor
of Magdeburg, Otto von Guericke in 1656 to demonstrate the
air pump which he had invented, and the concept of
atmospheric pressure."
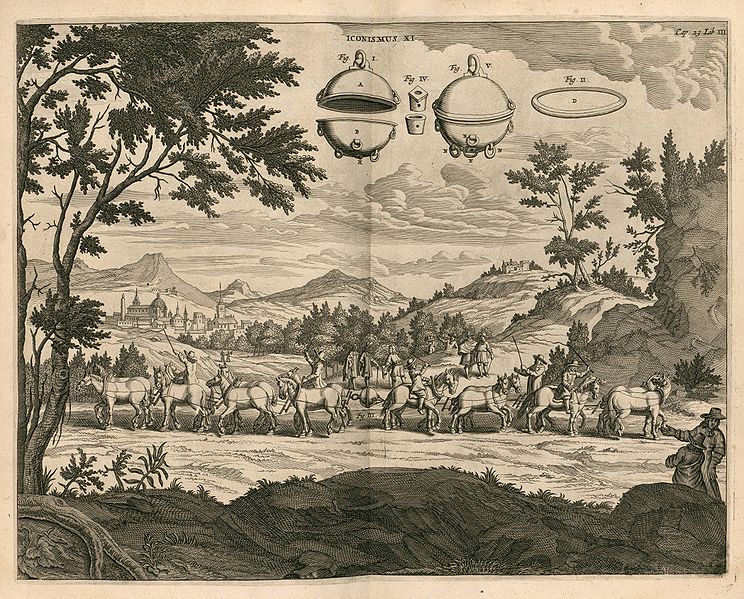
Gaspar Schott's sketch of Otto von
Guericke's Magdeburg hemispheres experiment (from the
Wikipedia article referenced above)
It is the pressure of the air
pushing inward against the outside surfaces of the
hemispheres that keeps them together. The
hemispheres appear to have had pretty large surface
area. There would be 15 pounds of force pressing
against every square inch (at sea level) of the
hemisphere which could easily have been several
thousand pounds of total force.
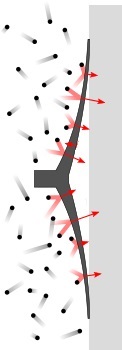
Suction cups work the same way
The suction cup has been pressed
against smooth surface. The cup is flexible and can be
pulled away from the wall leaving a small volume between the
wall and the cup where there isn't any air (a vacuum).
There's no air pressure pushing outward in the space between
the wall and the suction cup. There's just pressure
from the air surrounding the suction cup that is pushing and
holding it against the wall.
I suspect that if I were to attach the suction cup I had
in class to a white board mounted to a wall and were to ask
a couple of strong people to come down and try to pull it
off the white board they would end up pulling the white
board off the wall. The Facilities Management people
wouldn't appreciate that very much.
Changes in air density with altitude
(see p. 34 in the ClassNotes)
We've spent a lot of time (too much?)
looking at air pressure and how it changes with
altitude. Next we'll consider air density.
How does air density change with increasing
altitude? You should know the answer to that
question. You get out of breath more
easily at high altitude than at sea level. Air
gets thinner (less dense) at higher altitude. A
lungful of air at high altitude just doesn't contain as many
oxygen molecules as it does at lower altitude or at sea
level.
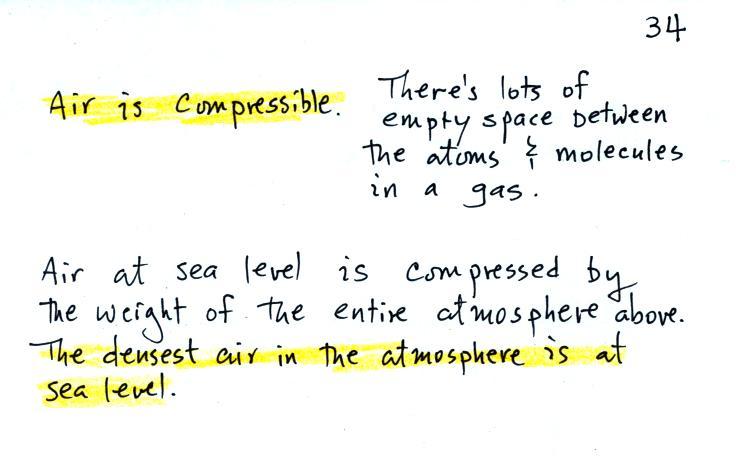
It would be nice to also understand why air density
decreases with increasing altitude.
The people pyramid reminds you that there is more
weight, more pressure, at the bottom of the atmosphere than
there is higher up.
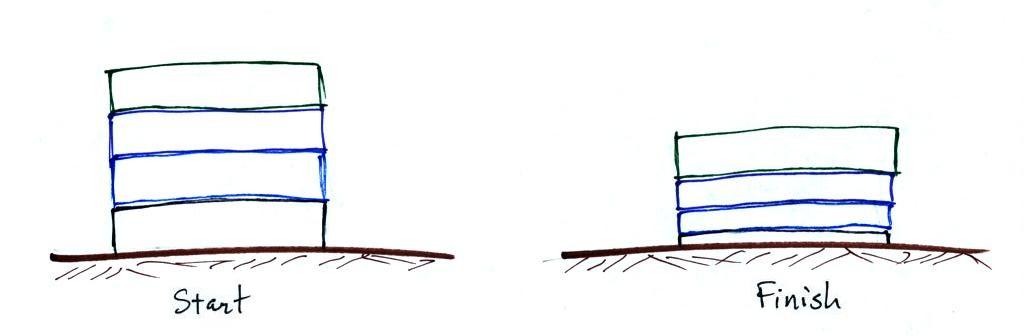
Layers of air are not solid and rigid like in a stack of
bricks. Layers of air are more like mattresses stacked
on top of each other. Mattresses are
compressible, bricks (and people) aren't. Mattresses
are also reasonably heavy, the mattress at the bottom of the
pile would be squished by the weight of the three mattresses
above. This is shown at right. The mattresses
higher up aren't compressed as much because there is less
weight remaining above. The same is true with layers
of air in the atmosphere.
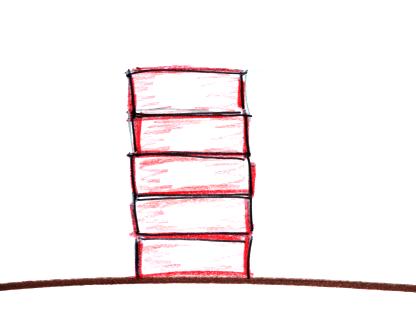
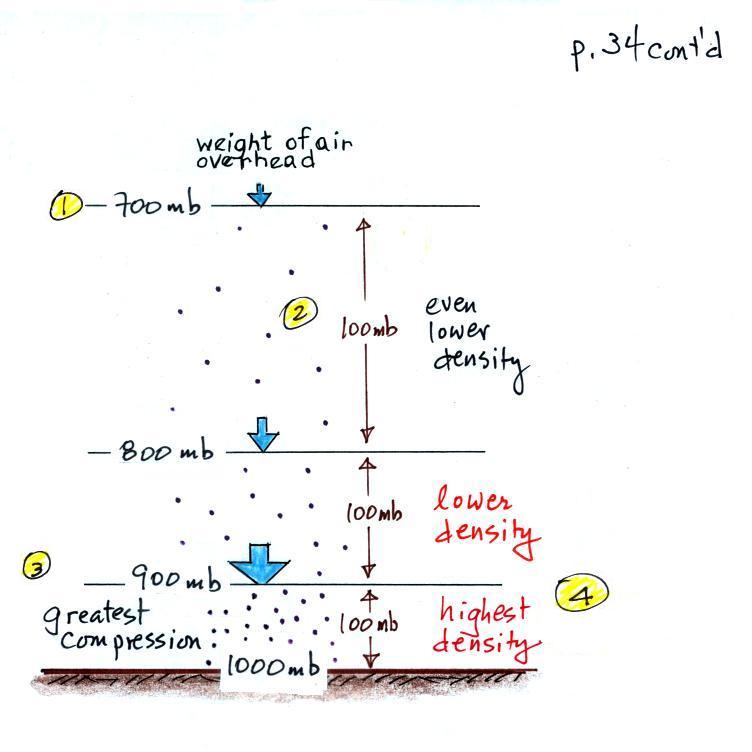
The statement above is at the top of p. 34 in the photocopied
ClassNotes. I've redrawn the figure found at the bottom
of p. 34 below.
There's a surprising amount of information in this figure and
it is worth spending a minute or two looking for it and
thinking about it.
1. You can first notice and remember that pressure
decreases with increasing altitude. 1000 mb at the
bottom decreases to 700 mb at the top of the picture.
You should be able to explain why this happens.
2. Each layer of air contains the same amount (mass)
of air. This is a fairly subtle point. You can
tell because the pressure drops by the same amount, 100 mb, as
you move upward through each layer. Pressure depends on
weight. So if all the pressure changes are equal, the
weights of each of the layers must be the same. Each of
the layers must contain the same amount (mass) of air (each
layer contains 10% of the air in the atmosphere).
3. The densest air is found at the bottom of the
picture. The bottom layer is compressed the most because
it is supporting the weight of all of the rest of the
atmosphere. It is the thinnest layer in the picture and
the layer with the smallest volume. Since each layer has
the same amount of air (same mass) and the bottom layer has
the smallest volume it must have the highest density.
The top layer has the same amount of air but about twice the
volume. It therefore has a lower density (half the
density of the air at sea level). Density is decreasing
with increasing altitude. That's the main point in
this figure.
4. A final point that you shouldn't worry too much about
yet. Pressure decreases 100 mb in a fairly
short vertical distance in the bottom layer of the picture - a
rapid rate of decrease with altitude. The same 100 mb
drop takes place in about twice the vertical distance in the
top layer in the picture - a smaller rate of decrease with
altitude. Pressure is decreasing most
rapidly with increasing altitude in the densest air in the
bottom layer. We'll make use of this concept again at
the end of the semester when we try to figure out why/how
hurricanes intensify and get as strong as they do.