Tuesday Oct. 13, 2015
Ballyhoo! "Phantoms",
"Overnight
Sensation", "Walk Away",
"Battle
Cry", "Cali Girl"
Both the 1S1P Scattering of Sunlight reports and the 1S1P Surface
Weather Map Analyses have been graded and were returned in class
today. There are a handful of people that have reached 45
pts, the maximum number of 1S1P pts allowed. Those students
do not need to write any additional 1S1P reports. I will
soon be putting a link on the class web page with the names of
students that have earned 45 1S1P pts.
Several other students are close to 45 pts. The Causes of
the Seasons reports haven't been graded yet. I will try to
let students that are close to 45 pts and have turned in a Causes
of the Seasons know as soon as I can if that report will be enough
to get them to 45 pts.
Quiz #2 is Thursday this week (Oct. 15). Reviews are
scheduled for Tuesday and Wednesday afternoons, see the Quiz #2 Study Guide for times and
locations.
The Experiment #2 reports were collected today. Those take a
little while to get graded. I hope to have them all graded
in time to return on Thursday Oct. 22. If you haven't
returned the experiment materials, please bring them to class on
Thursday. We need the thermometers for Expt. #3.
The revised Expt. #1 reports are due by Thursday this week (Oct.
15).
The Experiment #3 materials will be handed out before the
quiz on Thursday.
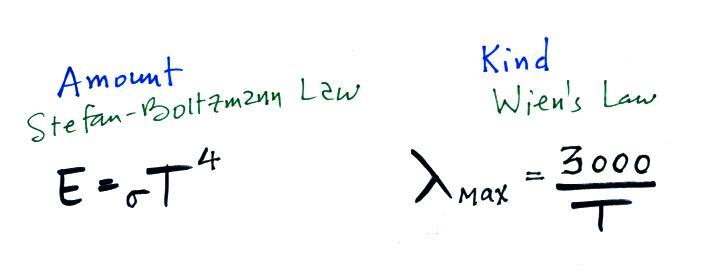
Light emitted by the earth and the sun
Here's a short topic, the light emitted by
the earth & sun, that I stuck onto the end of the last Thursday's class notes.
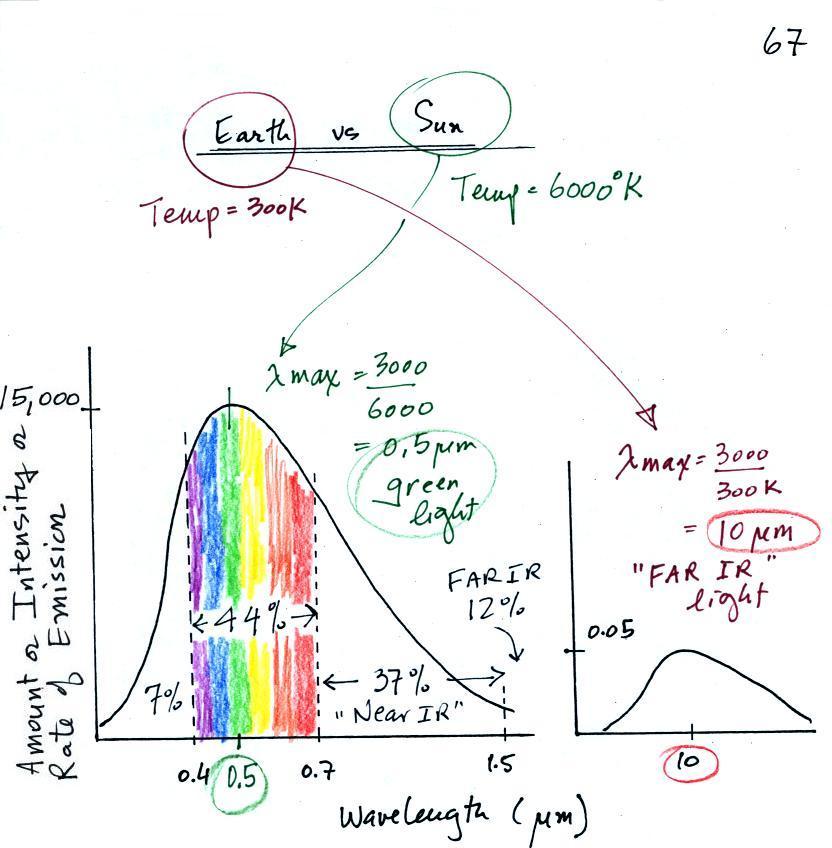
We looked at a couple of curves like these in class last
week. Note the wavelength scale on the bottom of the
figure. The interval from 0.4 to 0.7 micrometers is visible
light. The sun is 20 times hotter than the earth; every
square foot of the sun will emit 160,000 times as much radiant
energy as a square foot on the earth. The type (wavelength)
of light is very different.
The curve on the right is for the earth. Note the peak on
the vertical axis is only 0.05 compared to 15,000 on the curve at
left. Obviously the light emitted by the earth is much
weaker than the sun. 100% of the
light emitted by the earth (temperature = 300 K) is invisible
far IR light. The wavelength of peak emission for the
earth is 10 micrometers.
The curve on the left is for the sun. The surface of the sun
has a temperature of 6000 K so we can use Wien's law to calculate
λmax
. It turns out to be 0.5 micrometers, green
light. The sun emits more green
light than any other kind of light but appear green
because it is also emitting lesser amounts of violet, blue,
yellow, orange, and red - together this mix of colors appears
white (it's a cooler white than you would get from a
tungsten bulb). 44% of the radiation emitted by the sun is
visible light, Almost as much, 37%, is near IR light.
More about that below. Almost half of the light
emitted by the sun (37% + 12% = 49%) is invisible IR light.
Only 7% of sunlight is UV light and most of that gets absorbed by
the ozone layer in the stratosphere.
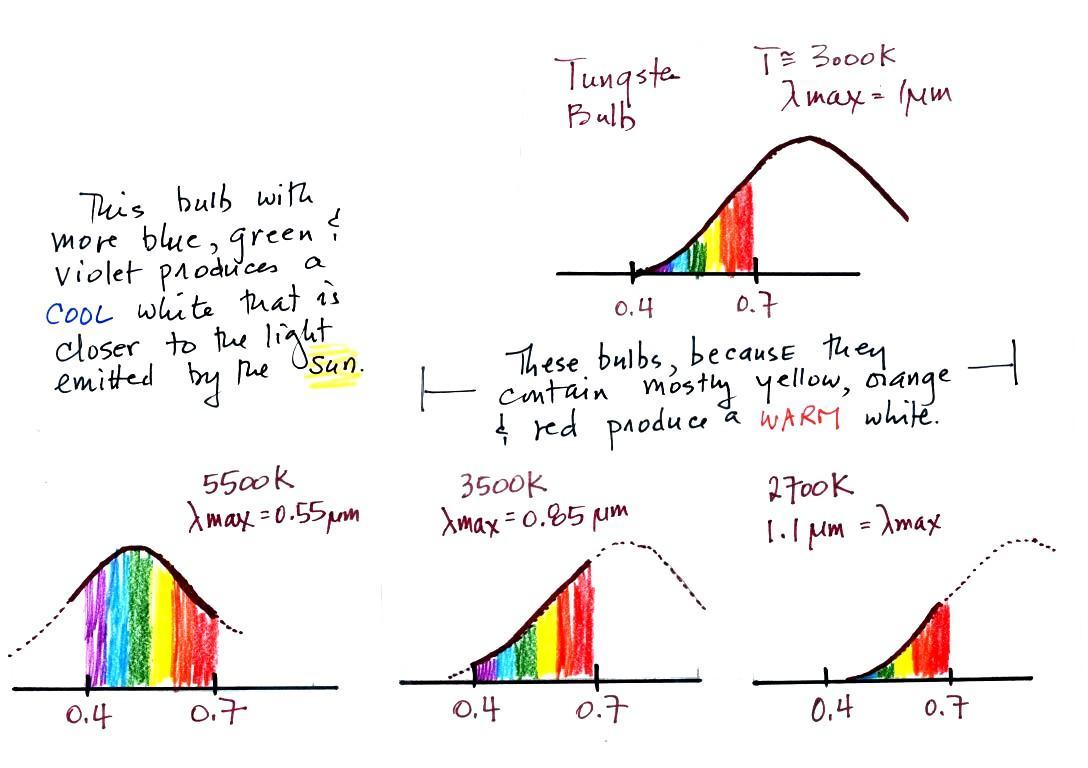
Compact fluorescent lamps (CFL) and LED bulbs
Ordinary tungsten bulbs (incandescent
bulbs) produce a lot of wasted energy. This is
because they emit a lot of invisible infrared light that
doesn't light up a room (it will warm up a room but there
are better ways of doing that). The light that they
do produce is a warm white color (tungsten bulbs emit lots
of orange, red, and yellow light and not much blue, green
or violet).
Energy efficient compact fluorescent lamps (CFLs) are
being touted as an ecological alternative to tungsten
bulbs because they use substantially less electricity,
don't emit a lot of wasted infrared light, and also
last longer. CFLs come with different color
temperature ratings, different mixtures of the colors that
make up visible light
The bulb with the hottest temperature rating (5500 K ) in the
figure above is meant to mimic or simulate sunlight
(daylight). The temperature of the sun is 6000 K and lambda
max is 0.5 micrometers. The spectrum of the 5500 K bulb is
similar. Even though the color temperature is
high this is referred to as cool white because it contains more
blue, green, and violet light.
The tungsten bulb (3000 K) and the CFLs with temperature
ratings of 3500 K and 2700 K produce a warmer white.
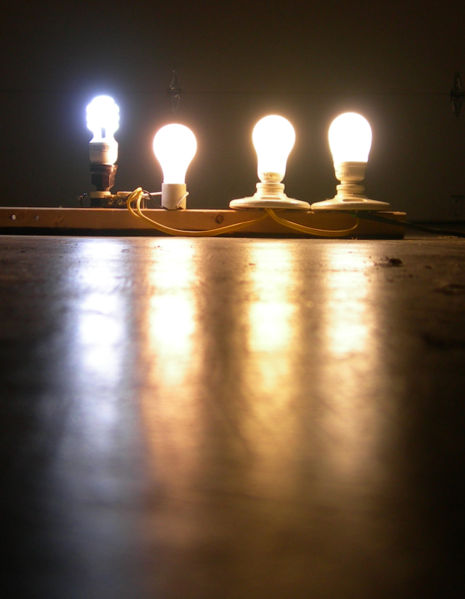
Three CFLs with the temperature ratings above were set up in
class so that you actually could see the difference between warm
and cool white light. Personally I find the 2700 K bulb "too
warm," it makes a room seem gloomy and depressing (a student in
class once said the light resembles Tucson at night). The
5500 K bulb is "too cool" and creates a stark sterile atmosphere
like you might see in a hospital corridor. I prefer the 3500
K bulb in the middle.
The figure below is from an
article on compact fluorescent lamps in Wikipedia for those
of you that weren't in class and didn't see the bulb
display. You can see a clear difference between
the cool white bulb on the left in the figure below and the warm
white light produced by a tungsten bulb (2nd from the left) and 2
CFCs with low temperature ratings (the 2 bulbs at right).
There is one downside to these energy efficient CFLs. The
bulbs shouldn't just be discarded in your ordinary household trash
because they contain mercury. They should be disposed of
properly (at a hazardous materials collection site or perhaps at
the store where they were purchased). I suspect
a lot of people don't do that.
It probably won't be long before LED bulbs begin
to replace tungsten and CFL bulbs. The price has been
dropping in the last year or two.
LED stands for light emitting diode. We won't be looking
at them in detail except to say that a single LED can produce only
a single color, it can't produce white light. What is done
instead is to put three small LEDS producing red green and blue
light in close proximity. When they are illuminated the
three colors mix together to produce white light.
CFLs sometimes take 30 seconds or a minute to come to full
brightness. LED bulbs turn on instantaneously.
The world viewed in near IR light.
The world would not look the same if we were able to see near
IR light instead of visible light.
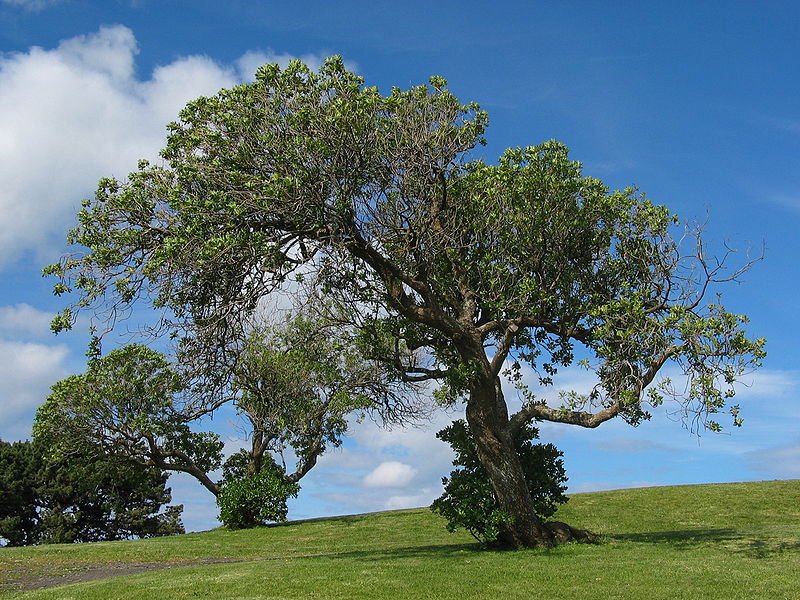
|
|
visible light
reflected by the tree
and photographed with normal
film
|
near IR light
reflected by the tree
and photographed using near
IR film
|
The picture at left
was taken using normal film, film that is sensitive to
visible light. The picture at right used near
infrared film. In both pictures we are looking
at sunlight that strikes the tree or the ground and is
reflected toward the camera where it can
be photographed (i.e. these aren't photographs of
visible light being emitted by the tree or the
ground).
The tree at left is green and relatively dark (it
reflects green light but absorbs the other colors of
visible light). The tree at right and the ground
are white, almost like they were covered with
snow. The tree and grass on the ground are very
good reflectors of near infrared light. Here are
many
more images taken with infrared film.
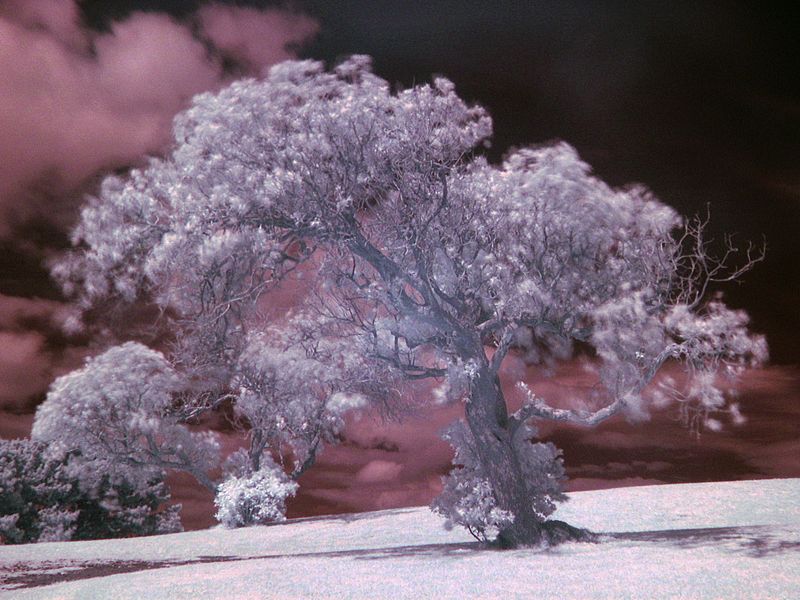
Photographs of the ground taken from an air plane using
ordinary film at left (responds to visible light) and near
infrared film at right. Notice how much clearer the river is
in the picture at right. The IR photograph is able to "see
through" the haze. The haze is light being scattered
predominantly by air molecules. You may remember from the
1S1P topic on scattering that air molecules scatter shorter
wavelengths in much greater amounts that longer wavelengths.
Near IR light is not scattered nearly as much as visible light.
You wouldn't have seen the tree or the river if the photos above
had been taken at night. That is because they are
photographs of reflected sunlight.
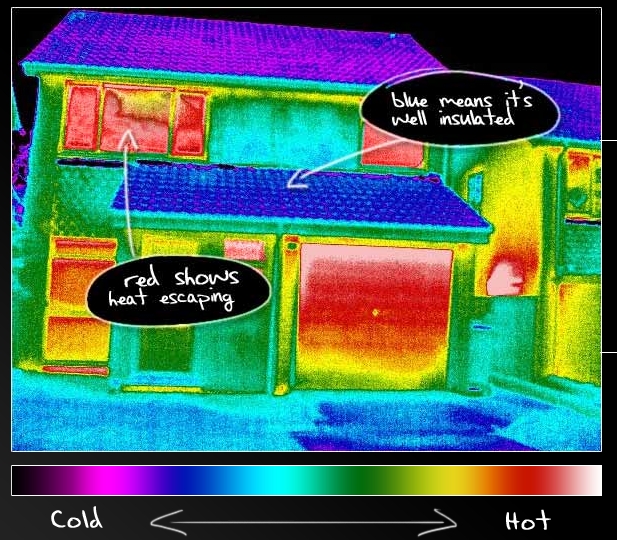
This is a picture of the far IR light
that is emitted by a house (source
of this image). You'd see this during
the day or night, sunlight doesn't need to be present.
Remember that the amount of energy
emitted by an object depends strongly on temperature (temperature
to the 4th power in the Stefan-Boltzmann law). Thus it is
possible to see hot spots that emit a lot of energy and appear
"bright" and colds spots. Photographs like these are often
used to perform an "energy audit" on a home, i.e. to find spots
where energy is being lost. Once you locate one of these hot
spots you can add insulation and reduce the energy loss.
This photograph has been color coded. Reds and orange mean
more intense emission of IR radiation (warmer temperature) than
the blues and greens. The reds show you were energy is being
lost (often through poorly insulating windows). Many of the
roof tops are blue, they are cool. There is probably a lot
of insulation in the attic and little energy is being lost out the
roof.
Later in the semester we will looking at satellite
photographs of clouds. Satellites take pictures of both
the visible light reflected by clouds and also the IR
radiation emitted by clouds.
We now have most of the tools we will need to begin to study
radiant energy balance on the earth. It will be a balance
between incoming sunlight energy and outgoing IR radiation emitted
by the earth. This will ultimately lead us to an explanation
of the atmospheric greenhouse effect.
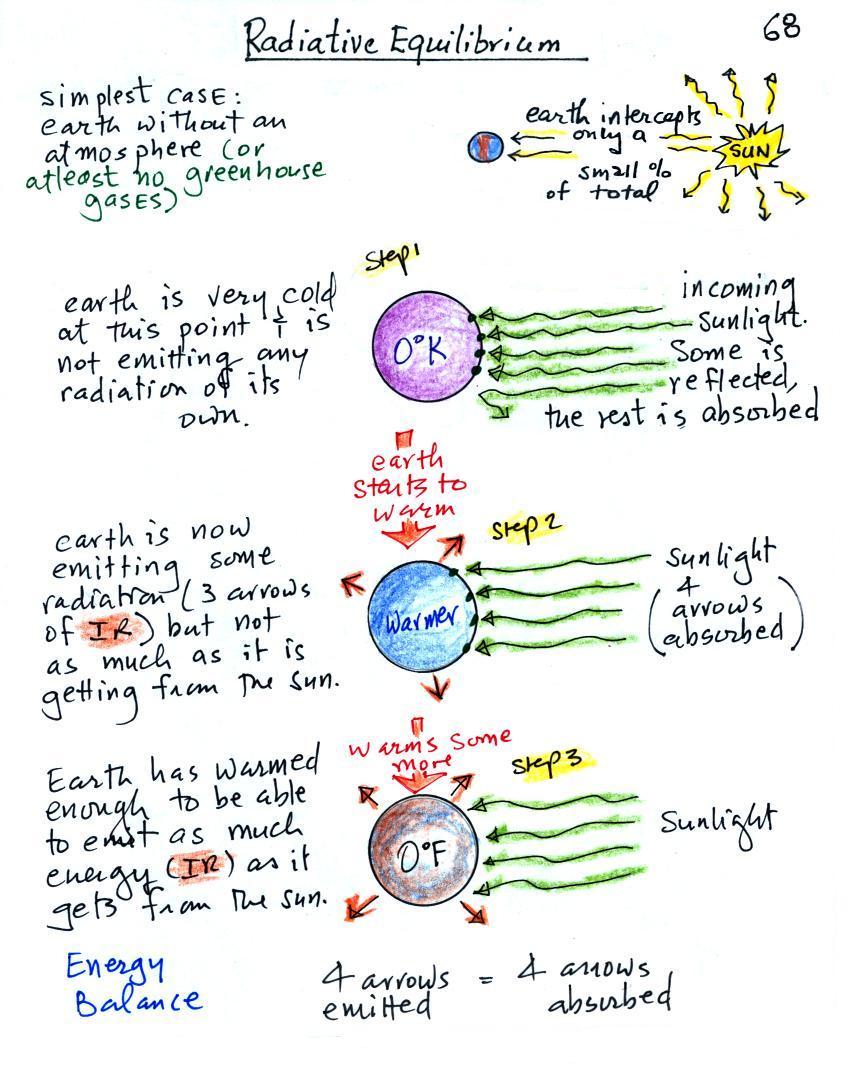
Radiative equilibrium on the earth without an atmosphere
We will first look at the simplest kind of situation, the earth
without an atmosphere (or at least an atmosphere without
greenhouse gases). The next figure is on p. 68 in the
ClassNotes. Radiative equilibrium is really just balance
between incoming and outgoing radiant energy.
You might first wonder how it is possible for the relatively small
and cool earth (with a temperature of around 300 K) to be in
energy balance with the much larger and hotter sun (6000 K).
Every square foot of the sun emits 160,000 times as much energy as
a square foot on the earth. At the top right of the figure,
however, you can see that because the earth is located about 90
million miles from the sun and only absorbs a very tiny fraction
of the total energy emitted by the sun. The earth only needs
to balance the energy is absorbs from the sun.
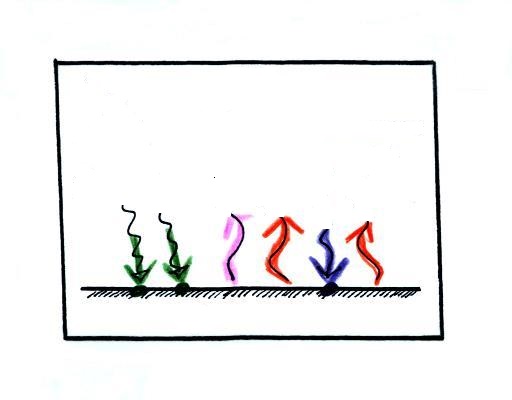
To understand how energy balance occurs we start, in Step #1,
by imagining that the earth starts out very cold (0 K) and is not
emitting any EM radiation at all. It is absorbing sunlight
however (4 of the 5 arrows of incoming sunlight in the
first picture are absorbed, 1 of the arrows is being reflected) so
it will begin to warm This is like opening a bank account,
the balance will start at zero. But then you start making
deposits and the balance starts to grow.
Once the earth starts to warm it will also begin to emit EM
radiation, though not as much as it is getting from the sun (the
slightly warmer earth in the middle picture is now colored
blue). Only the four arrows of incoming sunlight that are
absorbed are shown in the middle figure. The arrow of
reflected sunlight has been left off because they don't really
play a role in energy balance (reflected sunlight is
like a check that bounces - it really doesn't affect your bank
account balance). The earth is emitting 3 arrows
of IR light (in red). Because the earth is still
gaining more energy (4 arrows) than it is losing (3 arrows) the
earth will warm some more. Once you find money in
your bank account you start to spend it. But as long as
deposits are greater than the withdrawals the balance will grow.
Eventually the earth will warm enough that it (now shaded brown
& blue) will emit the same amount of energy as it absorbs from
the sun. This is radiative equilibrium, energy balance (4
arrows of absorbed energy are balanced by 4 arrows of emitted
energy). That is called the temperature of radiative
equilibrium (it's about 0 F for the earth).
Note that it is the amounts of energy, not the kinds of energy
that are important. Emitted radiation may have a different
wavelength than the absorbed energy. That doesn't
matter. As long as the amounts are the same the earth will
be in energy balance. Someone might deposit money into your
bank account in Euros while you spend dollars.
Filtering effect of the atmosphere on ultraviolet, visible,
and infrared light
Before we start to look at radiant energy balance on the earth
with an atmosphere we need to learn about how the atmosphere will
affect the incoming sunlight (a mixture of UV, visible, and
near IR light) and outgoing far IR light emitted by the
earth. We'll draw a filter absorption graph for the earth's
atmosphere.
We will first look at the effects simple blue, green,
and red glass filters have on visible light. This is just to
be sure we understand what an absorption curve
represents.

If you try to shine white light (a mixture
of all the colors) through a blue filter, only the blue light
passes through. The filter absorption curve shows 100%
absorption at all but a narrow range of wavelengths that
correspond to blue light. The location of the slot or
gap in the absorption curve shifts a little bit to the right
with the green and further right with the red filter.
The following figure is a simplified,
easier to remember, representation of the filtering effect of
the atmosphere on UV, VIS, and IR light (found on p. 69 in the
photocopied notes). The figure was redrawn after class.
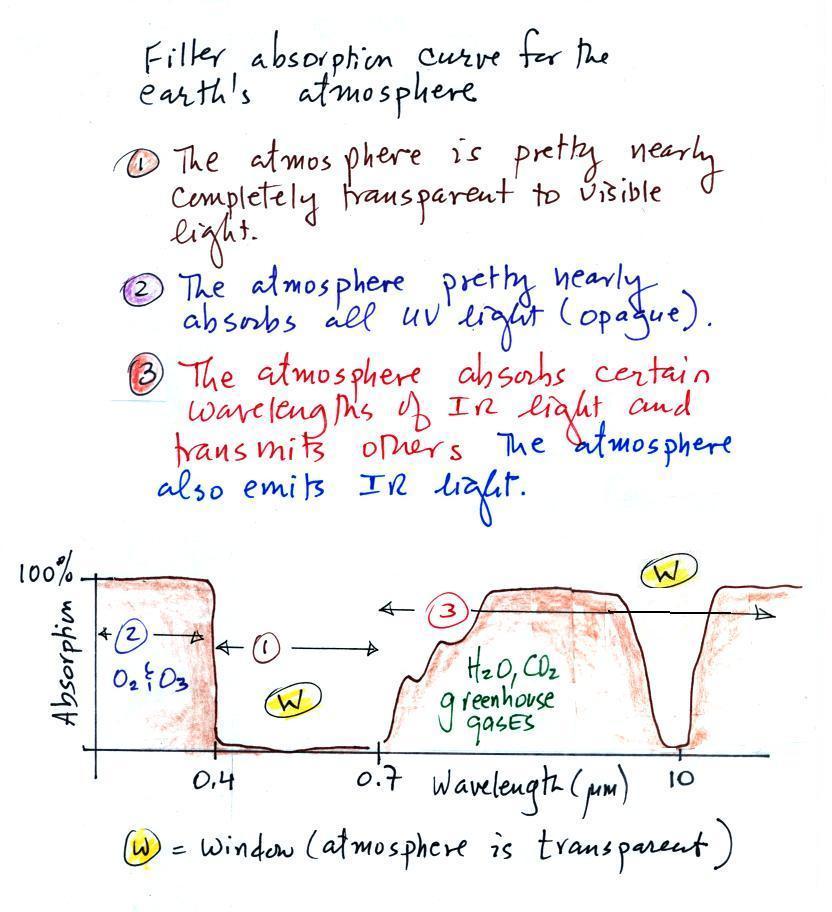
You can use your own eyes to tell you what
effect the atmosphere has on visible light. Air is
clear, it is transparent. The atmosphere transmits
visible light.
In our simplified representation oxygen and ozone make the
atmosphere pretty nearly completely opaque to UV light (opaque
is the opposite of transparent and means that light is blocked
or absorbed; light can't pass through an opaque
material). We assume that the atmosphere absorbs all
incoming UV light, none of it makes it to the ground.
This is of course not entirely realistic.
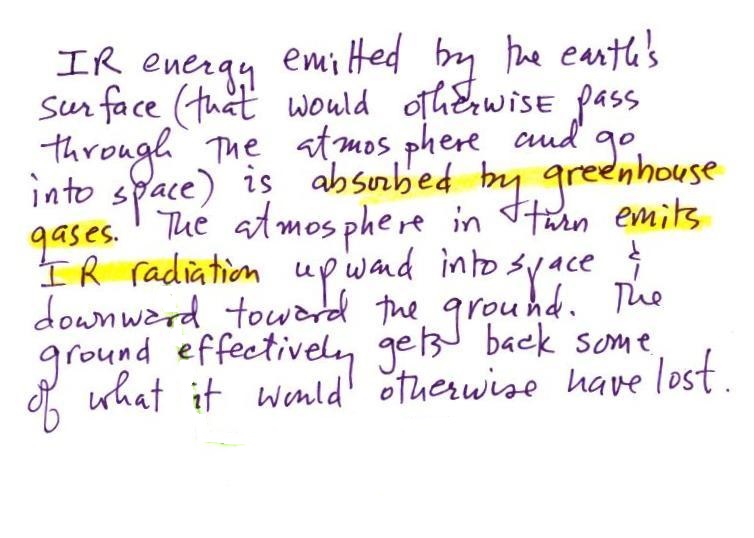
Greenhouse gases make the atmosphere a selective absorber
of IR light - the air absorbs certain IR wavelengths and
transmits others . Wavelengths between
0.7 and 8 or 9 μm
are absorbed (by greenhouse gases), radiation centered at 10μm
is transmitted by the atmosphere. Wavelengths greater
than 10 μm are absorbed
(again by greenhouse gases). It is the atmosphere's
ability to absorb certain wavelengths of infrared light that
produces the greenhouse effect and warms the surface of the
earth. The atmosphere also emits IR radiation.
This is also an important part of the greenhouse effect.
Note "the atmospheric window" centered at 10 micrometers. Light emitted by
the earth at this wavelength (and remember 10 um is the
wavelength of peak emission for the earth) will pass through
the atmosphere. Another transparent region, another
window, is found in the visible part of the spectrum.
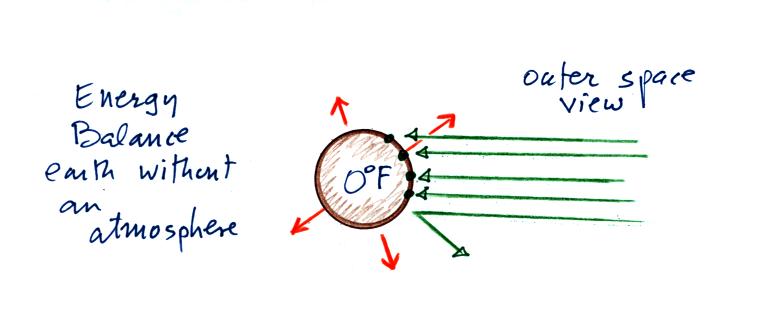
Now back to the outer space view of radiative equilibrium on
the earth without an atmosphere. The important thing to note
is that the earth is absorbing and emitting the same amount of
energy (4 arrows absorbed balanced by 4 arrows emitted). The
arrow of reflected sunlight doesn't any role at all.
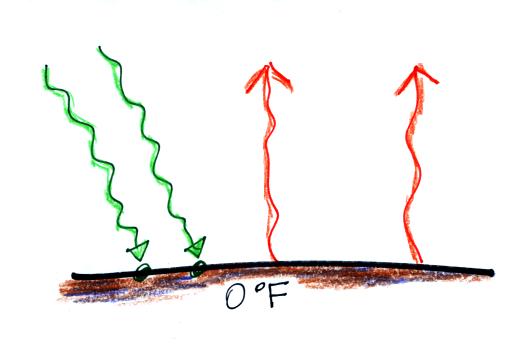
We will be moving from outer space to the earth's surface (the
next two figures below).
Don't let the fact that there are
4 arrows are
being absorbed and emitted in the figure above and
2 arrows absorbed and emitted in the bottom figure below
bother you. The important thing is that there are equal
amounts being absorbed and emitted in both cases.
The reason for only using two
arrows in this picture is to keep the picture as simple as
possible. It will get complicated enough when we add the
atmosphere to the picture.
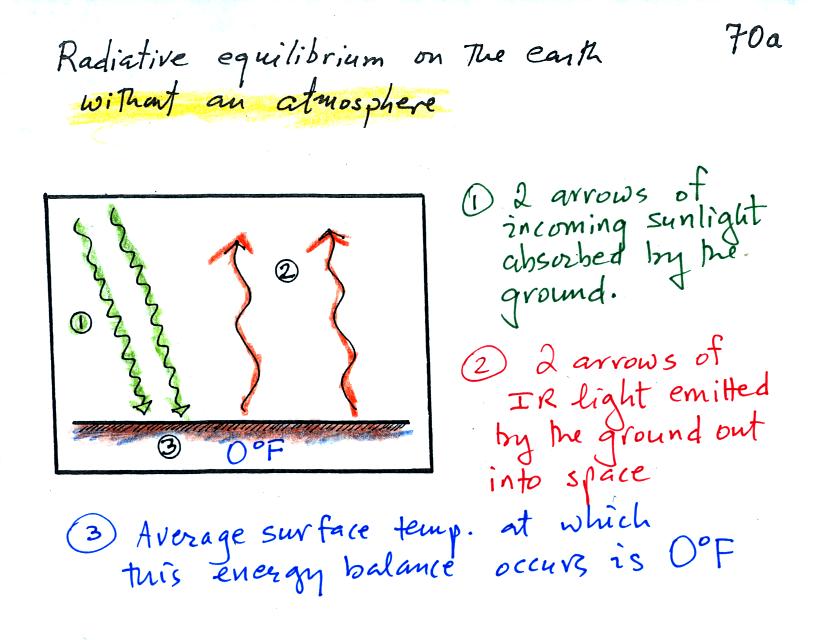
Here's the picture that is in
your ClassNotes (p. 70a). It's the same picture with a
little explanation added.
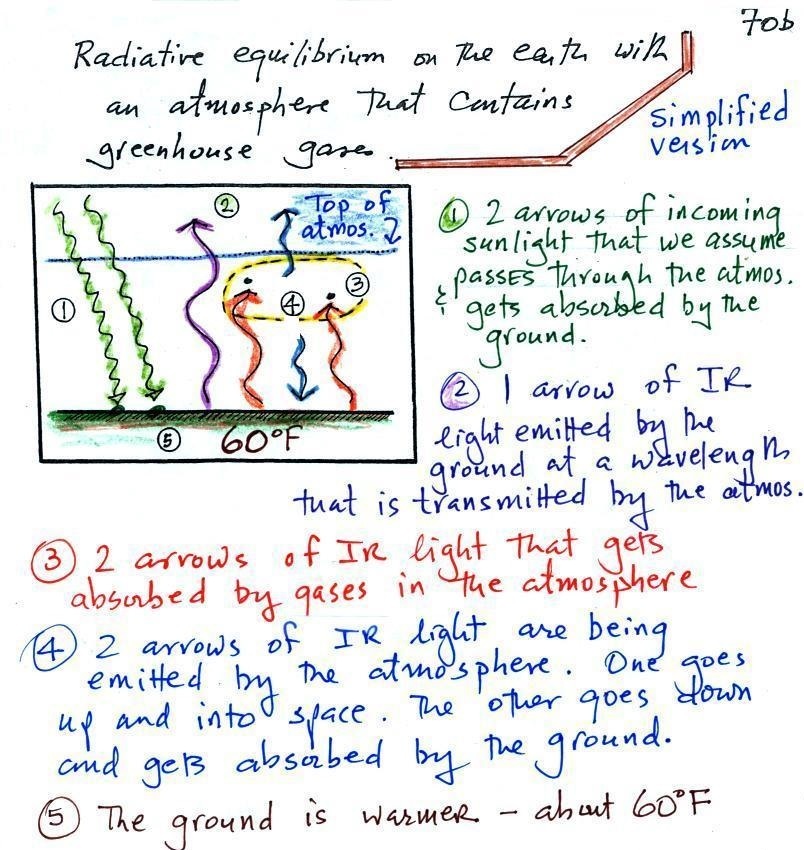
Radiative equilibrium on the earth with an atmosphere
- the greenhouse effect
The next step is to add the atmosphere.
We will study a
simplified version of radiative equilibrium just so
you can identify and understand the various parts of the
picture. Keep an eye out for the greenhouse
effect. Here's a cleaned up version of what we
ended up with in class. Energy balance is a little more
complex in this case, there are more arrows to sort out.
It would be hard to sort through and try
to understand all of this if you weren't in class (difficult
enough even if you were in class). So below we will go
through it again step by step (which you are free to skip
over if you wish). Caution: some of the colors
below may be different from those used in class.
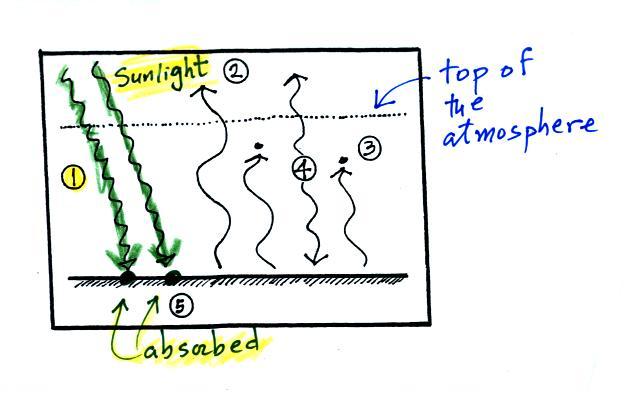
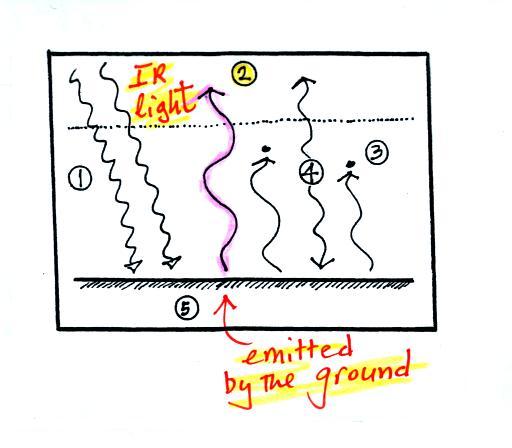
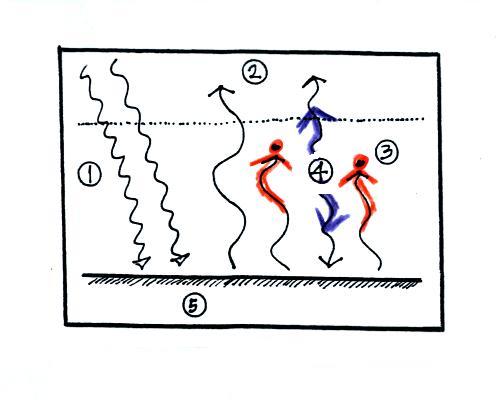
1. In
this picture we see the two rays of incoming sunlight that
pass through the atmosphere, reach the ground, and are
absorbed. 100% of the incoming sunlight is
transmitted by the atmosphere. This wouldn't be too
bad of an assumption if sunlight were just visible
light. But it is not, sunlight is about half IR
light and some of that is going to be absorbed. But
we won't worry about that at this point.
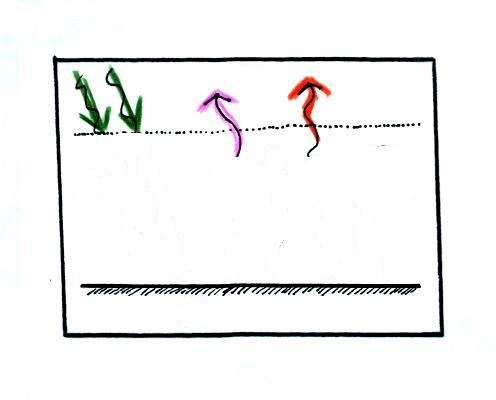
The ground is emitting
a total of 3 arrows of IR radiation. That might seem
like a problem. How can the earth emit 3 arrows when
it is absorbing only 2 from the sun. We'll see how
this can happen in a second.
2. One
of
these
(the
pink
or
purple
arrow
above)
is
emitted
by
the
ground
at
a
wavelength
that
is
not absorbed
by greenhouse gases in the atmosphere (probably around 10
micrometers, in the center of the "atmospheric
window"). This radiation passes through the atmosphere
and goes out into space.
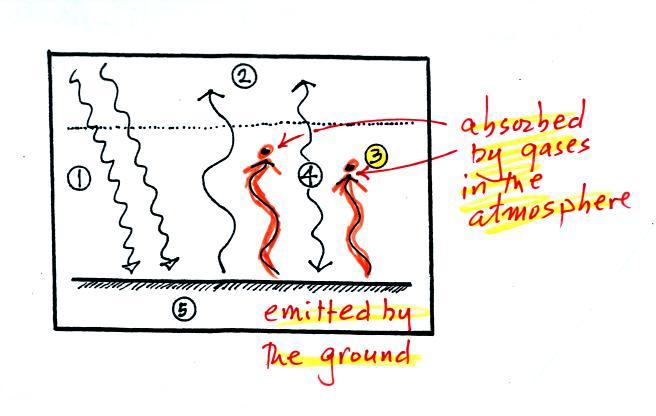
3. The other 2 units of IR radiation emitted
by the ground are absorbed by
greenhouse gases is the atmosphere.
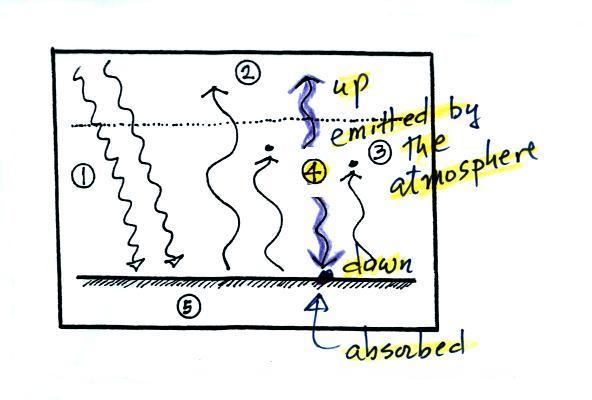
4.
The atmosphere is absorbing 2 units of radiation.
In order to be in radiative equilibrium, the atmosphere must
also emit 2 units of radiation. That's shown
above. 1 unit of IR radiation is sent upward into
space, 1 unit is sent downward to the ground where it is
absorbed. This is probably the part of the picture
that most students have trouble visualizing (it isn't so
much that they have trouble understanding that the
atmosphere emits radiation but that 1 arrow is emitted
upward and another is emitted downward toward the
ground). Both arrows leave the atmosphere, one goes
out into space and the other goes into the ground.
Now that all the arrows are accounted for, we will check to be
sure that every part of this picture is in energy balance.
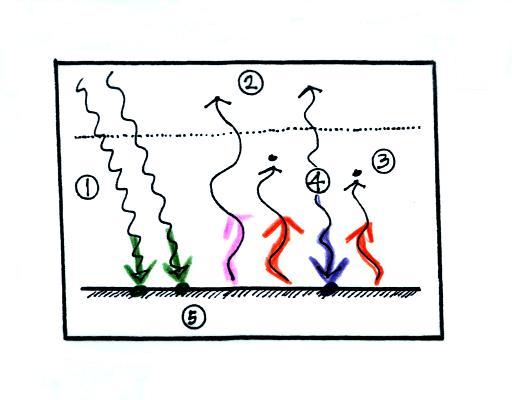
Checking for energy balance
at the ground.
It might help to cover up all but the
bottom part of the picture with a blank sheet of paper
(that's what I tried to do in the right figure below).
The ground is absorbing 3 units
of energy (2 green arrows of sunlight and one blue arrow
coming from the atmosphere) and emitting 3 units of energy
(one pink and two red arrows). The ground is
in energy balance. The earth
emits more energy than it gets from the sun. It can do this
because it gets energy from the atmosphere.
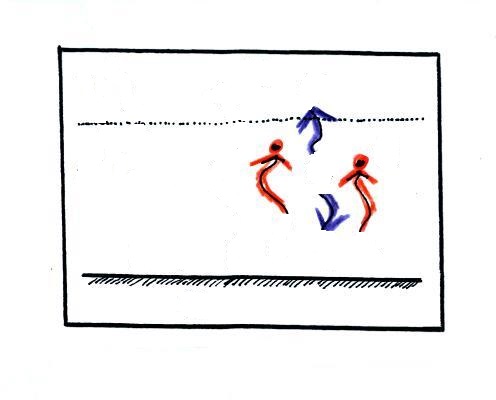
Checking for energy balance in the
atmosphere
The atmosphere is absorbing 2 units of energy (the
2 red arrows coming from the ground) and emitting 2 units of
energy (the 2 blue arrows). One goes upward into
space. The downward arrow goes all the way to the ground
where it gets absorbed (it leaves the atmosphere and gets
absorbed by the ground). We don't care where the arrows
are coming from or where they are going. We are just
interested in the amounts of energy gained and lost by the
atmosphere. The atmosphere is in energy balance.
And we should check to be sure equal amounts
of energy are arriving at and leaving the earth.
2 units of energy arrive at the
top of the atmosphere (green) from the sun after traveling
through space, 2 units of energy (pink and orange) leave
the earth and head back out into space. Energy
balance here too.
Did you spot the greenhouse effect?
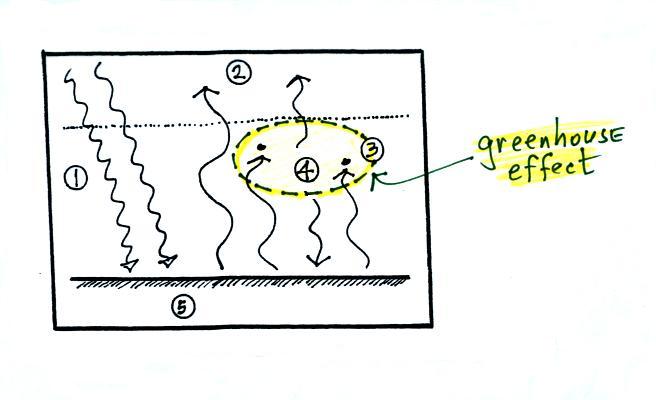
It's Points 3 &
4 in the figure. The greenhouse effect depends on both
absorbing IR radiation and emitting IR
radiation. Here's how you might put it into
words.
The greenhouse effect warms the earth's surface. The
global annual average surface temperature is about 60 F on the
earth with a greenhouse effect. It would be about 0 F
without the greenhouse effect.
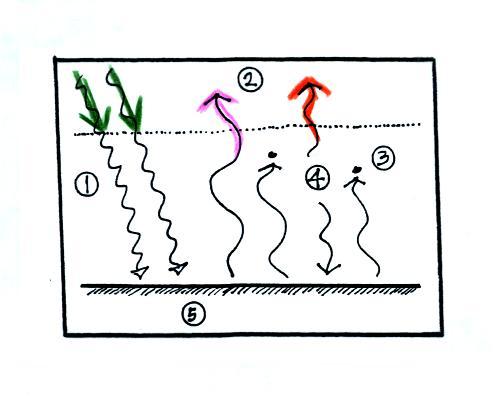
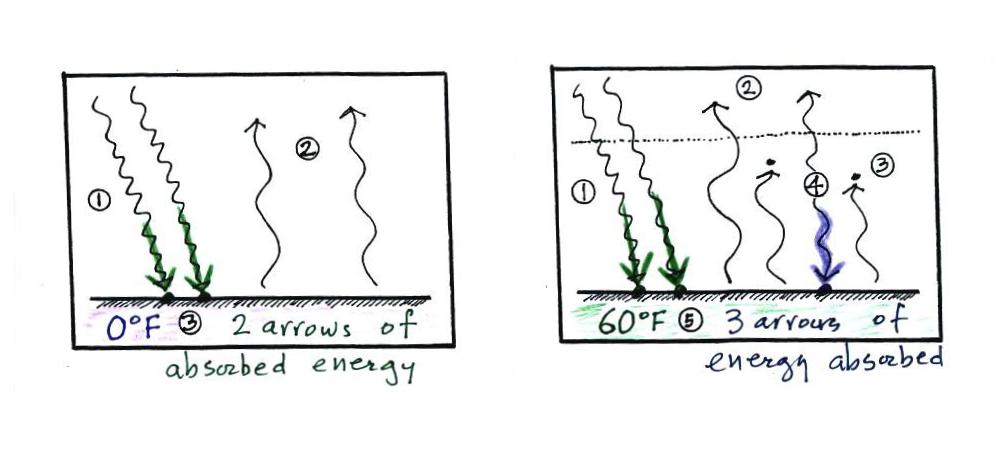
Here are a couple other ways of understanding why/how the
greenhouse effect warms the earth.
The
picture at left is the earth without an atmosphere
(without a greenhouse effect). At right the earth
has an atmosphere, one that contains greenhouse
gases. At left the ground is getting 2 units of
energy (from the sun). At right it is getting
three, two from the sun and one from the atmosphere
(thanks to the greenhouse effect). Doesn't it seem
reasonable that ground that absorbs 3 units of energy
will end up warmer than ground that is only absorbing 2?
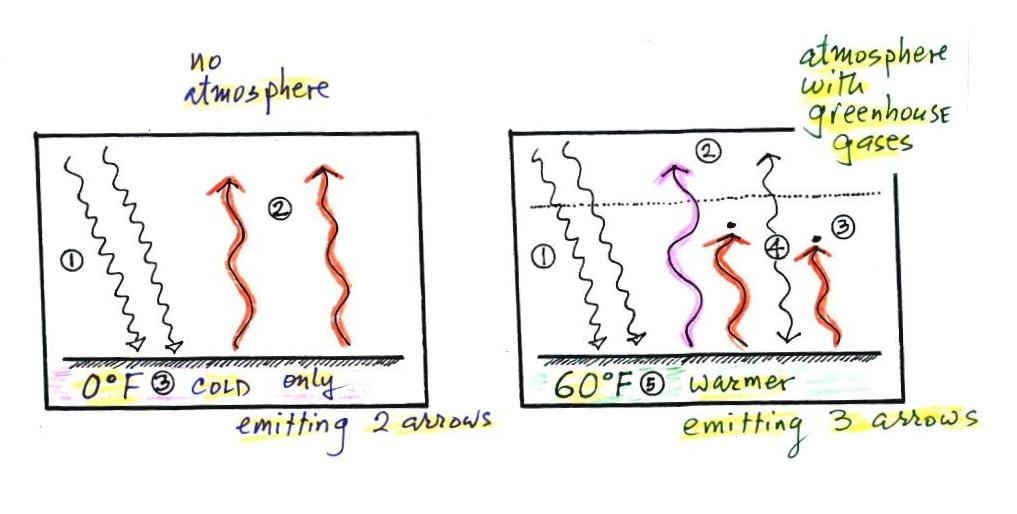
The next picture shows an even better (but more subtle) way of
analyzing the situation.
To be in energy balance, the ground in the picture above at
left must emit 2 arrows of radiant energy. At right the
ground must emit 3 arrows. The amount of energy emitted
by an object depends on temperature (to the 4th power).
The Stefan Boltzmann law tells us that. The ground above
at right has to be warmer in order to emit more radiant
energy.