Thursday Nov. 19, 2015
I had originally planned on playing some Tour de France bicycle
racing video in honor of this weekend's El Tour de Tucson.
But most of the good coverage with my favorite pair of
commentators has been removed from YouTube because of copyright
violations. So I settled on some old songs from Dire
Straits: Dire Straits "Down to the
Waterline", "Sultans of
Swing", "Walk of Life",
"Brothers in
Arms".
The Forces and Winds Optional Assignment has been graded and was
returned today. Almost everyone in the class received full
credit (0.4 extra credit pts). You'll find answers to all
the questions here.
A student in the 9:30 class pointed out that some of the links on
the class webpage weren't working. The problem has been
fixed I believe.
Note also there is a new 1S1P/Optional Assignment
available. The topic is El Niño, a weather phenomenon
that might have a big effect on our winter weather this
year. You can earn 1S1P pts (for a written report), extra
credit points (you need to download and answer some questions) ,
or both 1S1P and extra credit pts. The assignment is due the
Tuesday after Thanksgiving (Dec. 1) though if you could turn it in
before Thanksgiving I'd be grateful as that will give me a chance
to get a head start on the grading.
This will most likely be the last 1S1P topic of the
semester. There are still some students that have very few
1S1P pts. You can always turn in late work, I'll decide
later what to do with it. If it looks like the late work
could have a big effect on your overall grade I'll usually give
you half credit for a late, well written, 1S1P report.
We spent the entire class on
tornadoes
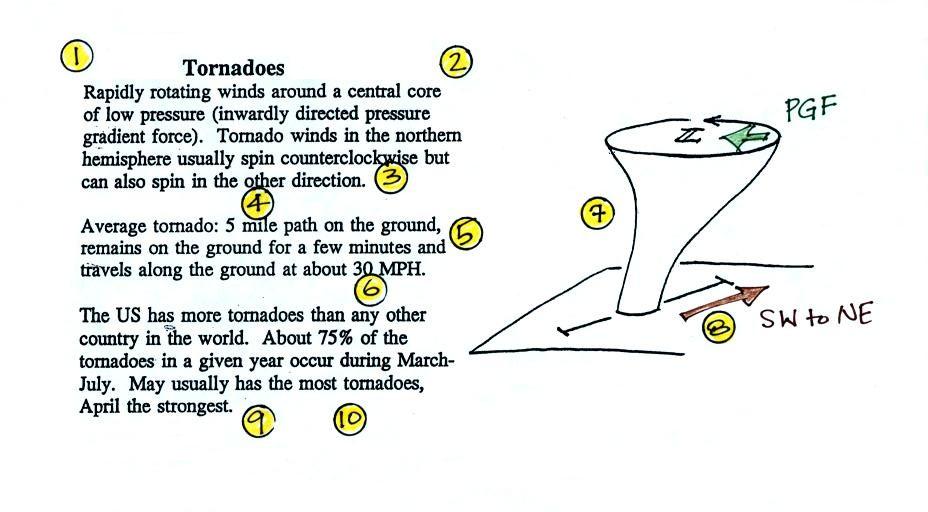
Tornado characteristics
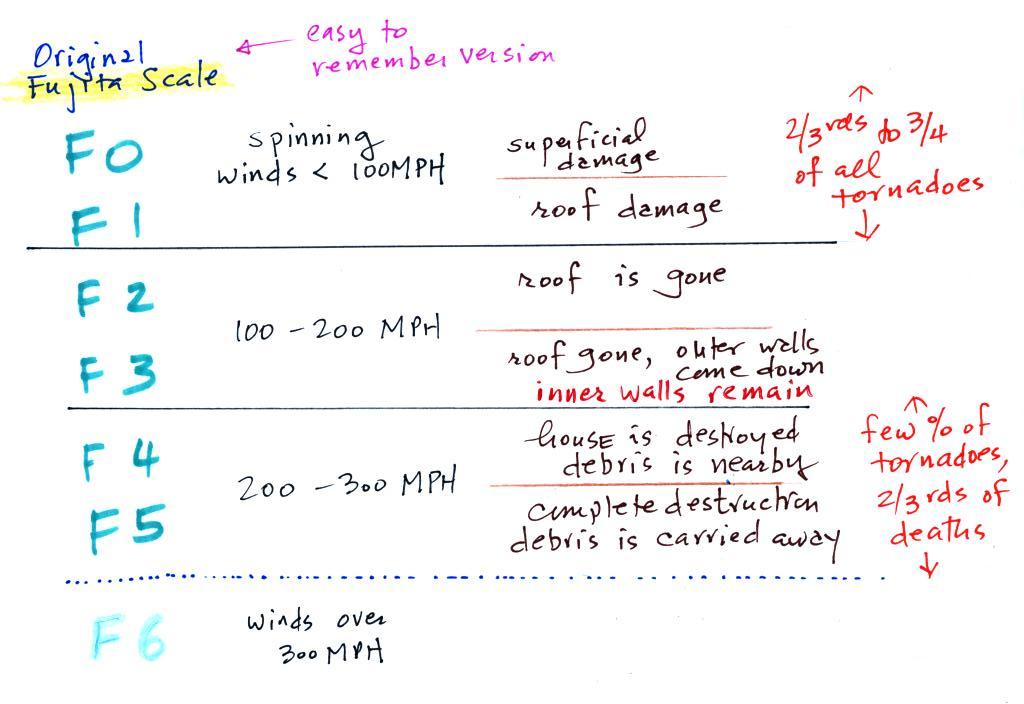
Here are some basic tornado
characteristics (the figure above is also on p. 161)
1. About 2/3rds (maybe 3/4) of tornadoes are
F0 or F1 tornadoes (this is referring to the Fujita Scale,
which we'll learn more about further down in today's notes)
and have spinning winds of about 100 MPH or less. That
surprises many people, they think tornado winds are faster
than that. Microburst winds can also reach 100
MPH. Microbursts are much more common in Tucson in the
summer than tornadoes and can inflict the same level of
damage.
2. A very strong inwardly directed pressure
gradient force is needed to keep winds spinning in such a
small diameter circular path. The pressure in the center
core of a tornado can be 100 mb less than the pressure in the
air outside the tornado. This is a very large pressure
difference in such a short distance. The
PGF
is
much
stronger
than
the
Coriolis
Force
(CF)
and
the
CF
can
be
neglected.
The same pressure drop can be found in strong hurricanes but
it takes place over a much larger distance. The PGF
isn't as strong and the CF does play a role.
3. Because the Coriolis force doesn't play a
role, tornadoes can spin clockwise or counterclockwise, though
counterclockwise rotation is more common. This might be
because larger scale motions in the cloud (where the CF is
important, might determine the direction of spin in a
tornado). I did a little bit
of research after class and it appears that most tornadoes in the
southern hemisphere also spin in a counterclockwise direction just
as in the northern hemisphere. Here's a
link to an article that addresses this question.
4, 5, 6. Tornadoes usually last only a few
minutes, leave a path on the ground that is a few
miles long, and move at a few 10s of MPH.
There are exceptions, we'll look at one shortly.
7, 8. Most tornadoes move from the SW toward
the NE. This is because tornado-producing thunderstorms
are often found just ahead of a cold front where winds often
blow from the SW. Most
tornadoes
have
diameters
of
10s
to
a
few
100s of yards but tornadoes with diameters over a mile have
been observed. Tornado diameter can also be much larger
near the base of the thunderstorm than it is near the ground.
9, 10. Tornadoes
are
most
frequent
in
the
Spring.
The
strongest
tornadoes
also
occur
at
that
time
of
year.
You
don't need to remember the specific months. Tornadoes
are most common in the late afternoon when the atmosphere is
most unstable. There is a
secondary tornado season in the fall.
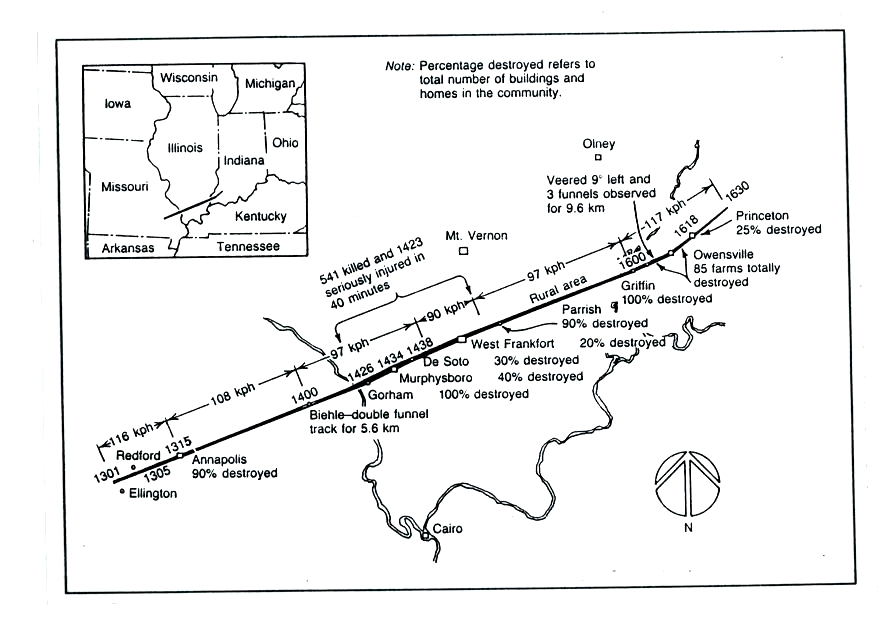
The 1925 Tri State Tornado
This figure traces out the path of the
1925 "Tri-State
Tornado" . The tornado path (note the SW to NE
orientation) was 219 miles long, the
tornado lasted about 3.5 hours and killed 695
people. The tornado was traveling over 60
MPH over much of its path. It is still today the
deadliest single tornado ever in the United States
(you'll find a compilation of tornado records here).
The Joplin
Missouri tornado (May 22, 2011) killed 162 people making
it the deadliest since 1947 and the 7th deadliest tornado in
US history.
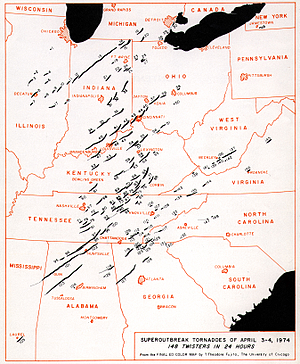
Tornado
outbreaks
Tornadoes often
occur in "outbreaks." The paths of 148 tornadoes
during the April 3-4, 1974 "Jumbo
Tornado Outbreak" are shown above. Note
the first tornadoes were located in the upper left
corner of the map and all
of the tornado paths are oriented from SW to NE.
The April
25-28, 2011 outbreak is now apparently the largest
tornado outbreak in US history (358 tornadoes, 346 people
killed)
There was a small tornado outbreak earlier this week
associated with the strong cold front that passed through
Tucson. Tornado outbreaks in November it seems are
pretty rare. Here is some
more information about this November High Plains tornado
outbreak.
As we learn more about tornadoes I'm hoping you'll look at tornado
videos with a more critical eye
than you would have otherwise. So we took a moment,
at this point, to have a look at some tornadoes
caught on video. If you click on the links below
you'll see the same or a similar video that I found
online. The videos shown in class were from a tape
called "Tornado
Video Classics".
The numbers in the left column identified the tornado on
the tape. The next column shows the Fujita Scale
rating (the scale runs from F0 (weakest) to F5
(strongest). The locations and date are shown
next. The last column has comments and things to
look for when watching the video segment.
Video
ID
|
Fujita
Scale
rating
|
Location
|
Date
|
Comments
|
54a
|
F3
|
Grand Isle NE
|
Mar. 13, 1990
|
tornado cloud is pretty
thick and vertical |
61f
|
F3
|
McConnell
AFB
KS
|
Apr. 26, 1991
|
this is about as close
to a tornado as you're ever likely to get. Try to
judge the diameter of the tornado cloud. What
direction are the tornado winds spinning?
|
52
|
F5
|
Hesston
KS
|
Mar. 13, 1990
|
Watch closely, you may
see a tree or two uprooted by the tornado winds
|
51
|
F3
|
North
Platte
NE
|
Jun. 25, 1989
|
Trees uprooted and
buildings lifted by the tornado winds. The online
video is longer than the one shown in class and has some
good closeup video. See especially the last couple
of minutes of the video
|
65
|
F1
|
Brainard
MN
|
Jul. 5, 1991
|
It's a good thing this
was only an F1 tornado
|
57
|
F2
|
Darlington
IN
|
Jun. 1, 1990
|
Tornado cloud without
much dust
|
62b
|
F2
|
Kansas
Turnpike
|
Apr. 26, 1991
|
It's sometimes hard to
run away from a tornado. Watch closely you'll see a
van blown off the road and rolled by the tornado.
The driver of the van was killed!
|
47
|
F2
|
Minneapolis
MN
|
Jul. 18, 1986
|
Tornado cloud appears
and disappears. The online video compares features
seen in this tornado with one created in a laboratory.
|
The online Kansas
turnpike video also has a warning that a highway underpass
is actually a very dangerous place to take shelter from a
tornado. Here is some
additional information from the Norman OK office of the
National Weather Service. Slide 6 lists some of the reasons
why underpasses are so dangerous.
Supercell thunderstorms
In the next video you'll see
1. Some additional footage of the Andover KS tornado (the
one that tore through the parking lot and the one that caught up
the people driving on an interstate highway and forced them to
seek shelter under a bridge).
2. Pictures of new and distant supercell
thunderstorms and wall clouds.
3. A computer simulation of the growth and
development of a supercell thunderstorm.
But first we need to learn a little bit about supercell
thunderstorms (p. 159)
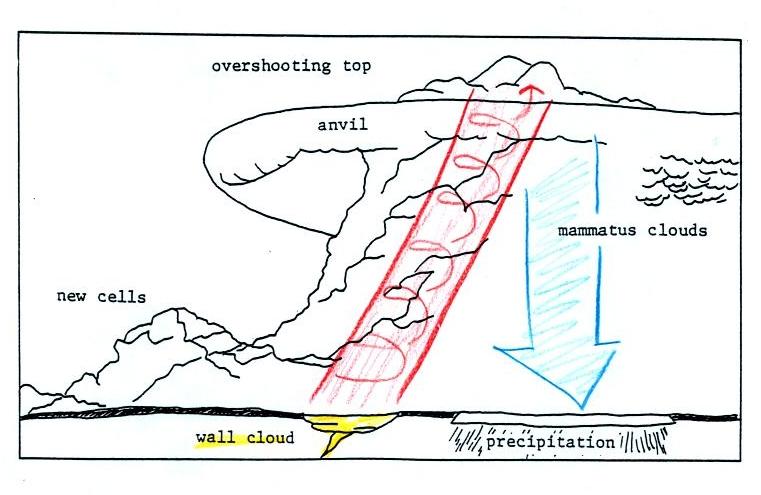
Here is a relatively
simple drawing showing some of the key
features on a supercell
thunderstorm (found on p. 163 in the
ClassNotes). In a supercell
the rotating updraft (shown in red above) is
strong enough to penetrate a little way into
the stratosphere. This produces the
overshooting top or dome feature above.
A wall cloud and a tornado are shown at the
bottom of the mesocyclone.
In an ordinary thunderstorm the updraft is
unable to penetrate into the very stable air
in the stratosphere and the upward moving air
just flattens out and forms an anvil.
The flanking line is a line of new cells
trying to form alongside the supercell thunderstorm
(similar to convergence between prexisting
winds and thunderstorm downdraft winds that
can lead to new storm development alongside a
dissipating air mass thunderstorm).
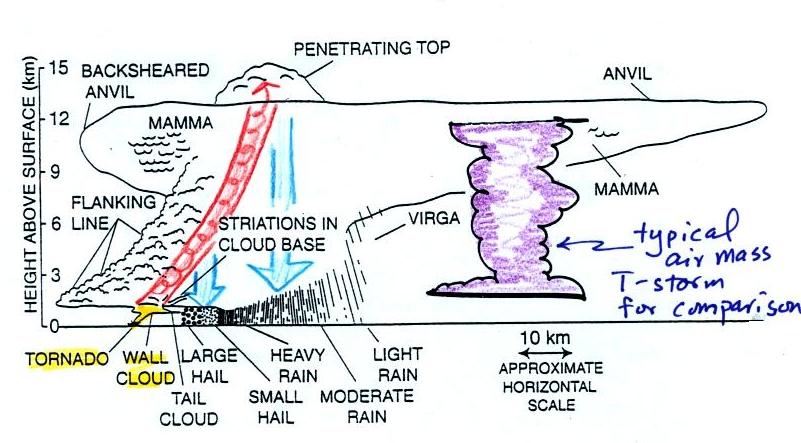
Here is a more realistic drawing of a
supercell thunderstorm.
A typical air mass thunderstorm (purple) has been drawn in
so that you can appreciated how much larger supercell
thunderstorms can be.
I haven't been able to find the video that I showed in
class online. But the intent of the
video was just to illustrate the complex air motions inside
supercell thunderstorms. Here's an alternate
video that also shows development of a tornado. The
computer animations that people are able to produce are
sometimes very amazing.
Weather radar and "hook
echoes"
Thunderstorms with rotating updrafts and supercell thunderstorms
often have a distinctive radar signature called a hook echo.
This is one of the ways that scientists are now able to
better detect and warn of tornadic thunderstorms
We haven't discussed
weather radar in this class. In some ways a radar image of
a thunderstorm is like an X-ray photograph of a human body.
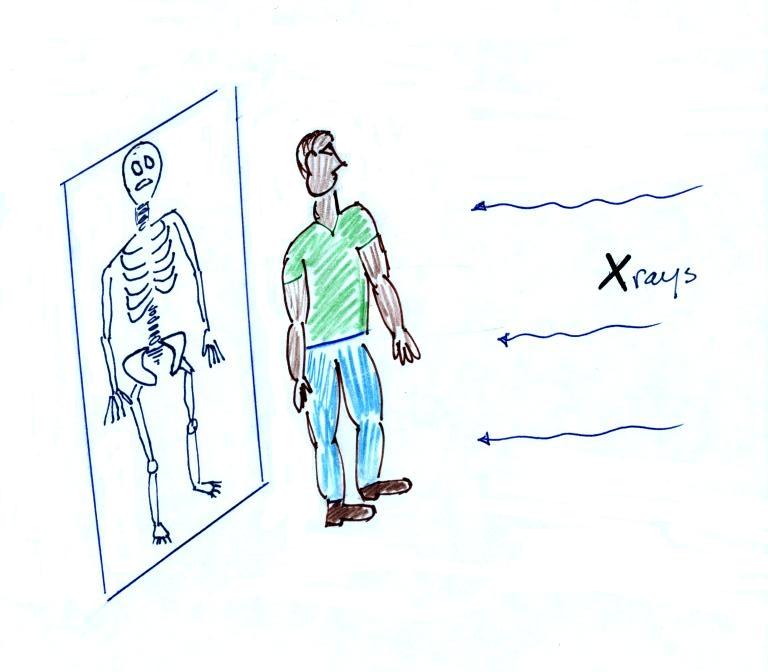
An X-ray image of a person doesn't usually
show the entire body, often just the bones and skeleton
inside.
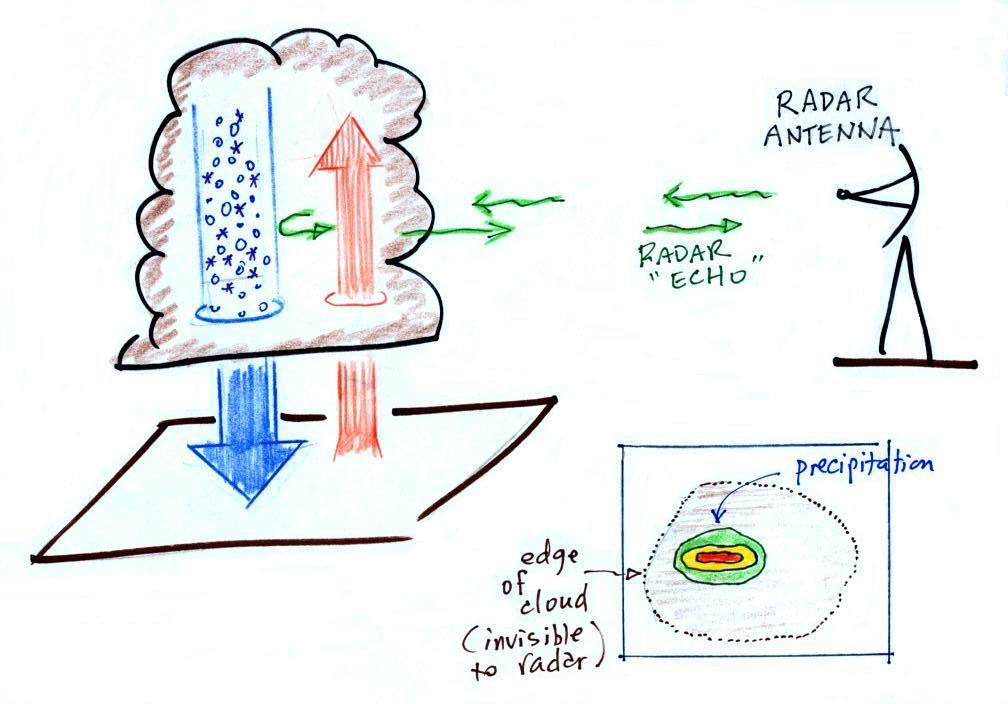
The
radio signals emitted by radar pass through the cloud itself
but are reflected by the much larger precipitation
particles. The radar keeps track of how long it takes for the
emitted signal to travel out to the cloud, be reflected, and
return to the radar antenna. The radar can use this to
determine the distance to the storm. It also knows the
direction to the storm and can locate the storm on a
map. The intensity of the reflected signal (the echo) is
often color coded. Red means an intense reflected signal
and lots of large precipitation particles. The edge of
the cloud isn't normally seen on the radar signal.
The amount and intensity of the precipitation is sometimes used
in Tucson during the summer to issue a severe thunderstorm
warning.
A Doppler radar (something we didn't
discuss in class) can detects small shifts in the
frequency of the reflected radar signal caused by precipitation
moving toward or away from the radar antenna. This can be
used to determine wind speeds inside the tornado.
Below is an actual radar image with a prominent hook
echo. The hook is evidence of large scale rotation inside
a thunderstorm and means the thunderstorm is capable of, and may
already be, producing tornadoes.
This is the radar image of a
thunderstorm that produced a very strong tornado that hit Oklahoma
City in May 1999
. The hook echo is visible near the lower left
hand corner of the picture. Winds in the tornado
may have exceeded 300 MPH. You can read more about this
tornado here.
And here is some storm chase
video of the tornado.
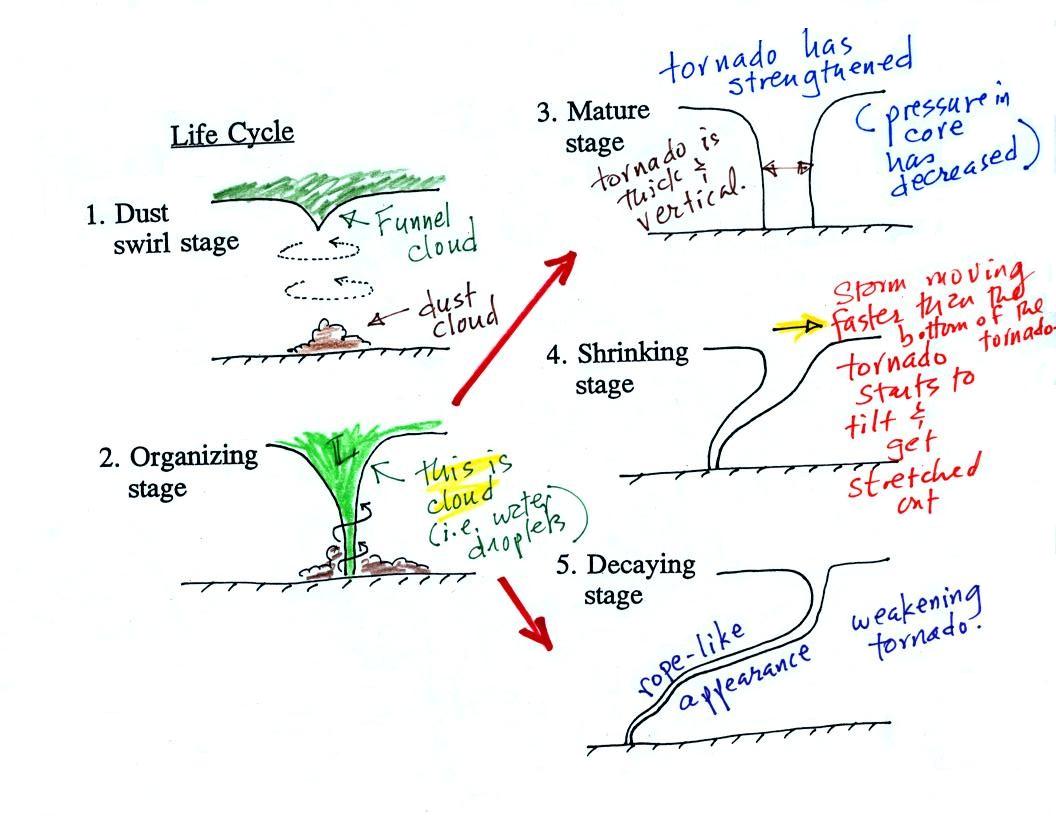
Tornado life cycle
Hopefully the next time you see a tornado either in person or on
video you'll be able to say whether it is early or late in its
life cycle and whether it appears to be a stronger or weaker than
average tornado.
Tornadoes begin in and descend from a thunderstorm. You
would usually see a funnel cloud dropping from the base of the
thunderstorm. Spinning winds will probably be present
between the cloud and ground before the tornado cloud becomes
visible. The spinning winds can stir up dust at ground
level. The spinning winds might also be strong enough at
this point to produce some minor damage.
In Stage 2, moist air moves horizontally toward the low
pressure in the core of the tornado. This sideways
moving air will expand and cool just as rising air does (see
figure below). Once the air cools enough (to the dew
point temperature) a cloud will form.
Tornadoes can go from Stage 2 to Stage 3 (this is what the
strongest tornadoes do) or directly from stage 2 to stage 4 or
5. Note a strong tornado is usually vertical and thick
as shown in Stage 3. "Wedge tornadoes"
actually appear wider than they are tall.
Here is video of the Laverne
Oklahoma tornado that was shown in class and that shows
the initial dust swirl stage up to the mature stage very
well.
The thunderstorm and the top of the tornado will move
faster than the surface winds and the bottom of the
tornado. This will tilt and stretch the tornado.
The rope like appearance in Stage 5 is usually a sign of a
weakening (though still a dangerous) tornado.
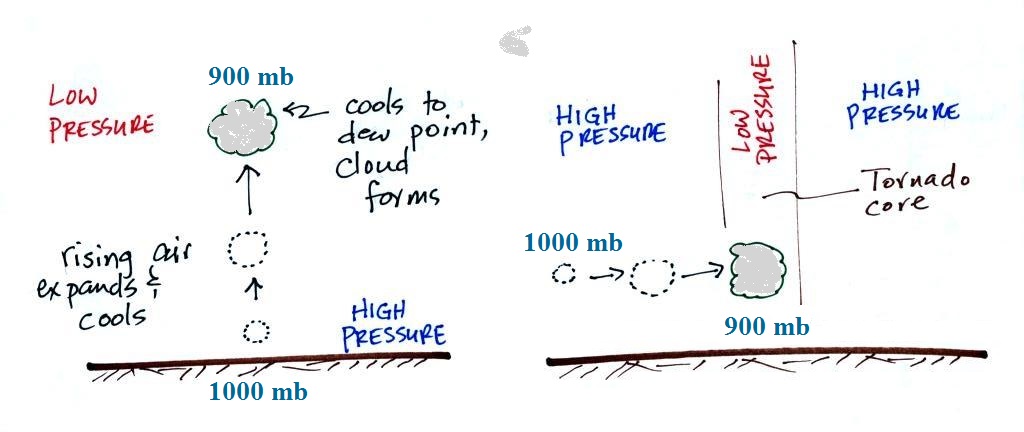
A tornado cloud forms is mostly the
same way that ordinary clouds do. In
an ordinary cloud (left figure above) rising air moves
into lower pressure surroundings and expands. Expansion
cools the air. If the air expands and cools enough (to the
dew point) a cloud forms. In a tornado air moves horizontally
into lower pressure at the core of the tornado. The air
expands and cools just like rising air does. If the air
cools enough a cloud appears.
Tornado intensity
and the Fujita Scale
It
is very hard to actually measure the
speed of the rotating winds in a
tornado. Researchers usually
survey the damage caused by the
tornado and assign a Fujita
Scale rating. The original
scale, introduced in 1971 by Tetsuya
(Ted) Fujita. A simplified, easy
to remember version is shown
below. A very basic and grossly
oversimplified idea of the damage that
each level can produce is
included. This is simple enough
that I can remember it and can use it
to estimate tornado intensity when I
see damage on the television news.
The fact that the interior walls in a
home as the last to go in a tornado means this is probably
the best location to seek shelter from a tornado if a
better location (such as an underground storm cellar) is
not available.
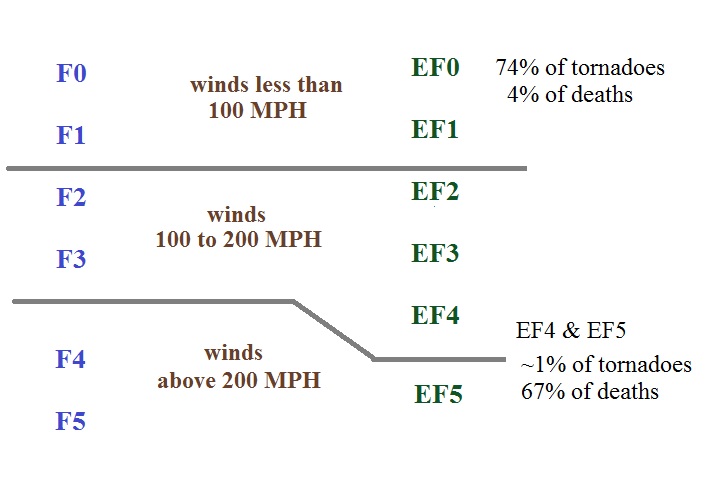
The Fujita (F) Scale probably overestimated the wind speeds in
tornadoes.
It has been replaced by the Enhanced Fujita (EF) scale.
Here are simplified, easy to remember, versions of both
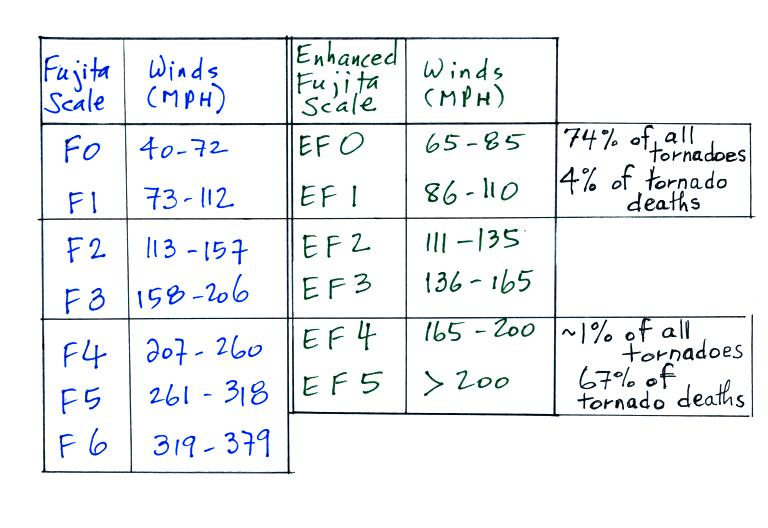
Here is a comparison of the
actual scales (I didn't show this
figure in class)
There's also a much more
detailed set of guidelines for determining the EF scale rating
from a survey of tornado. Different
objects and structures react differently when subjected to tornado
(or microburst) strength winds.
The EF scale has 28 "damage
indicators" that can be examined to determine
tornado intensity. You can think of these as being
different types of structures or objects that could be damaged
by lightning.. Examples
include:
Damage
Indicator
|
Description
|
2
|
1 or 2 family
residential home
|
3
|
Mobile home (single
wide)
|
10
|
Strip mall
|
13
|
Automobile showroom
|
22
|
Service station canopy
|
26
|
Free standing light pole
|
27
|
Tree (softwood)
|
Then for each indicator is
a standardized list of "degrees of damage"
that an investigator can look at to estimate
the intensity of the tornado. For a 1 or
2 family home for example
degree
of damage
|
description
|
approximate
wind speed (MPH)
|
1
|
visible damage
|
65
|
2
|
loss of roof covering
material
|
80
|
3
|
broken glass in doors
& windows
|
95
|
4
|
lifting of roof deck,
loss of more than 20% of roof material, collapse of
chimney, garage doors collapse inward, destruction of
porch roof or carport
|
100
|
5
|
house slides off
foundation
|
120
|
6
|
large sections of roof
removed, most walls still standing
|
120
|
7
|
exterior walls collapse
(top story)
|
130
|
8
|
most interior walls
collapse (top story)
|
150
|
9
|
most walls in bottom
floor collapse except small interior rooms
|
150
|
10
|
total destruction of
entire building
|
170
|
You'll find the entire set of damage
indicators and lists of degrees of damage here.
Here's some recent
video of damage being caused by a tornado as it happened
(caught on surveillance video). The link wasn't working when I tried to
show it in class. It shows a house roof
being lifted intact off a house. If you listen to the
news commentators, there was someone in a pickup truck in the
street that survived the tornado. The tornado struck
West Liberty, Kentucky on March 2, 2012.
Here are photographs of some actual tornado damage and
the EF Scale rating that was assigned to each
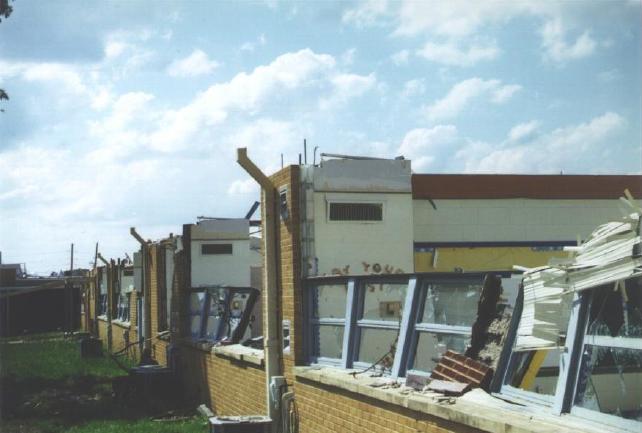
EF2
Damage
roof is gone, but all walls still standing
|
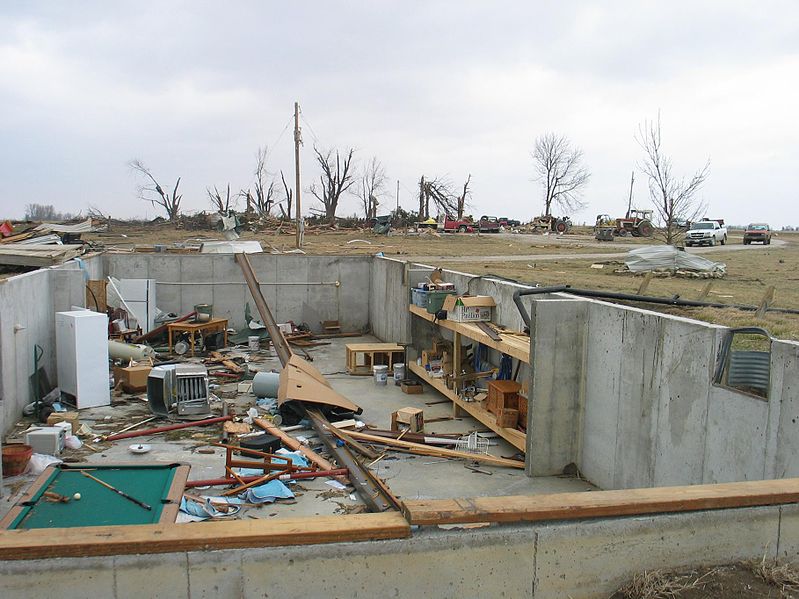
EF4
Damage
only the strong reinforced
concrete basement walls (part of the wall was below
ground) are left standing. It doesn't look like
there would have been anywhere in this building that
would have provided protection from a tornado this
strong.
|
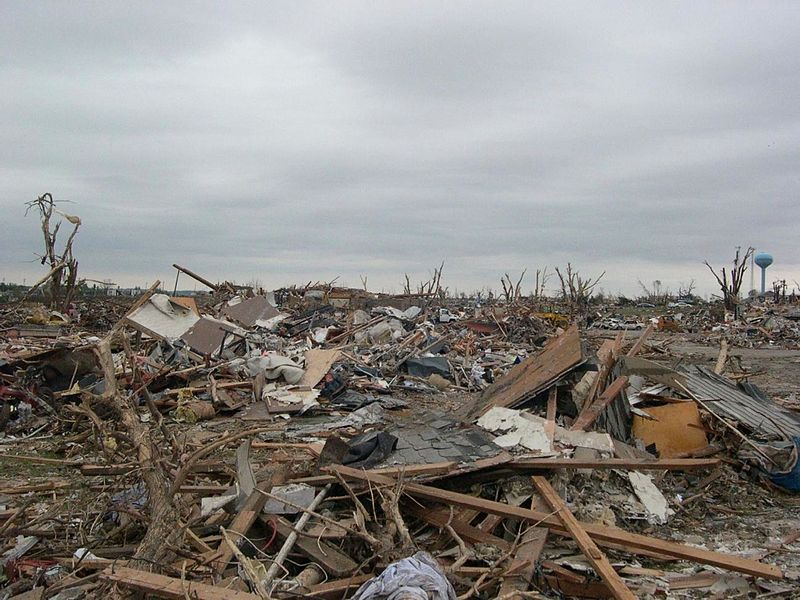
EF5
Damage
complete destruction of the structure
|
|
|
|
At this point we watched the last
of the tornado video tapes. It showed a tornado that
occurred in Pampa, Texas. Here is a
pretty similar video that I found online. It's
missing the commentary that was on the video shown in
class. Near the end of the segment, video
photography showed several vehicles (pick up trucks and a
van) that had been lifted 100 feet or so off the ground
and were being thrown around at 80 or 90 MPH by the
tornado winds (the large dark objects seen between about
5:40 and 6:10 on the video). Winds speeds of about
250 MPH were estimated from the video photography (though
the wind speeds were measured above the ground and might
not have extended all the way to the ground).
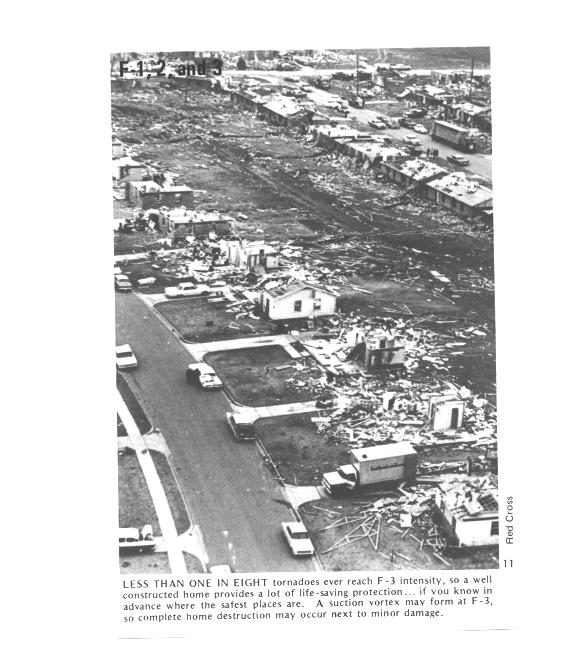
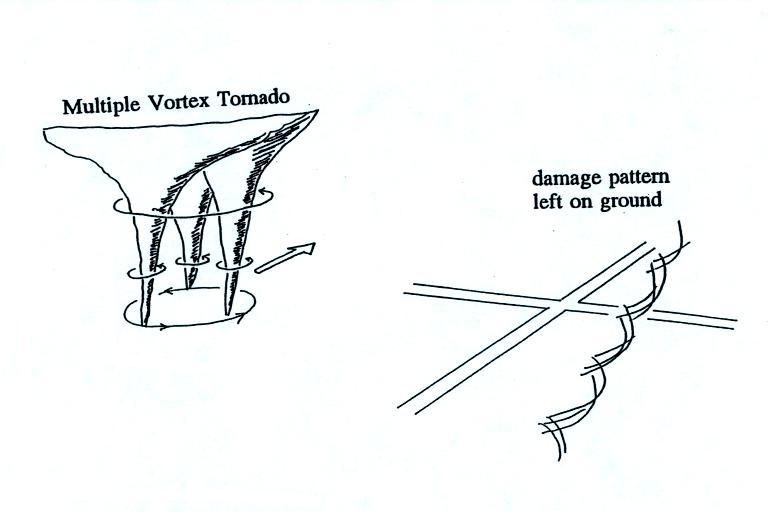
Multiple
vortex tornadoes
And finally, something that was initially something of a
puzzle to tornado researchers.
Several levels of
damage (EF1 to about EF3) are visible in the photograph
above. It was puzzling initially how some homes
could be nearly destroyed while a home nearby or in
between was left with only light damage. One
possible explanation is shown below.
Some big strong tornadoes
may have smaller more intense "suction vortices"
that spin around the center of the tornado (they
would be hard to see because of all the dust in the
tornado cloud. Tornado researchers have
actually seen the damage pattern shown above
scratched into the ground by the multiple vortices
in a strong tornado.
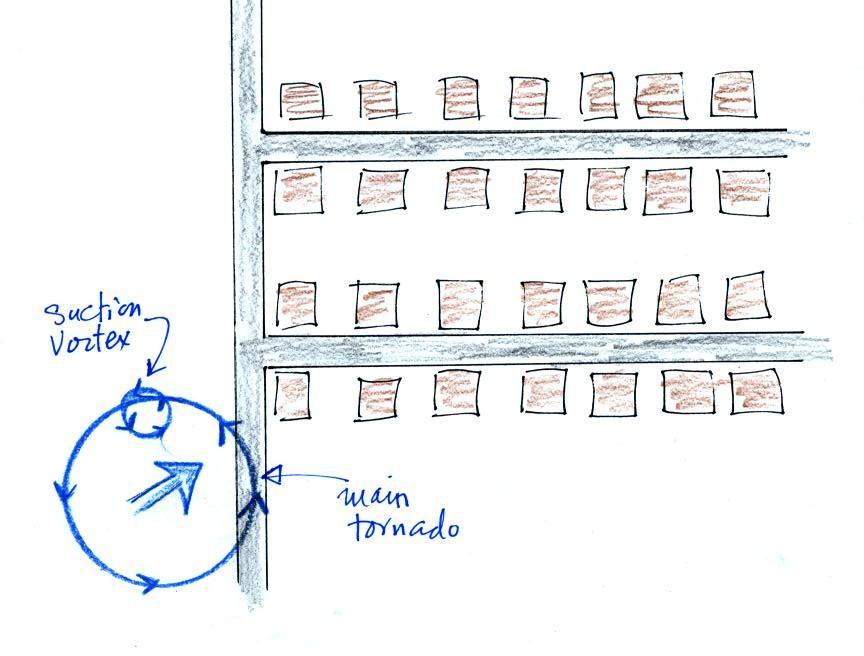
The sketch above shows a
tornado located SW of a neighborhood.
As the tornado sweeps through the neighborhood, the
suction vortex will rotate around the core of the tornado.
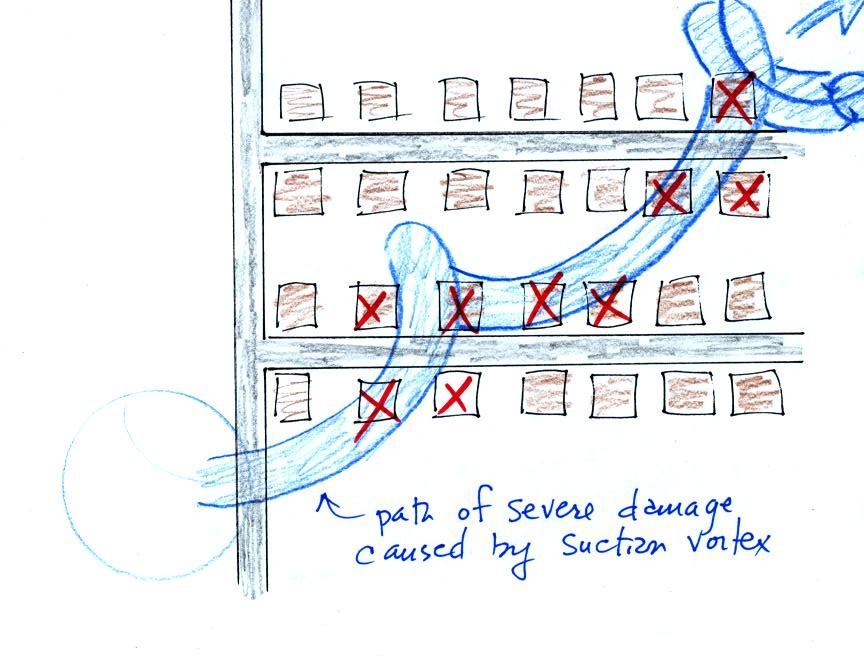
The
homes marked in red would be damaged
severely. The others would receive less
damage. Just one suction vortex was used
here, there are usually several. But the
tornado diameter is probably larger than shown
here.