 |
 |
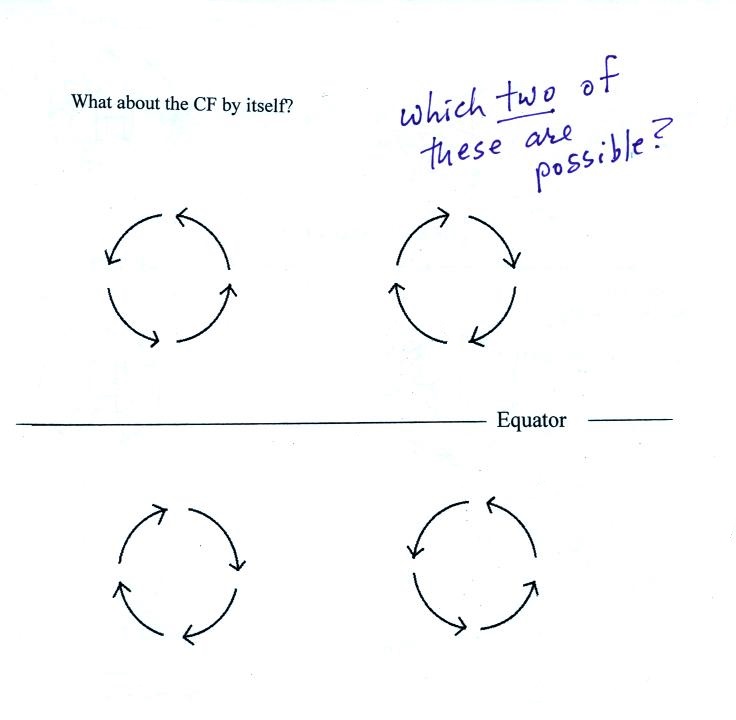
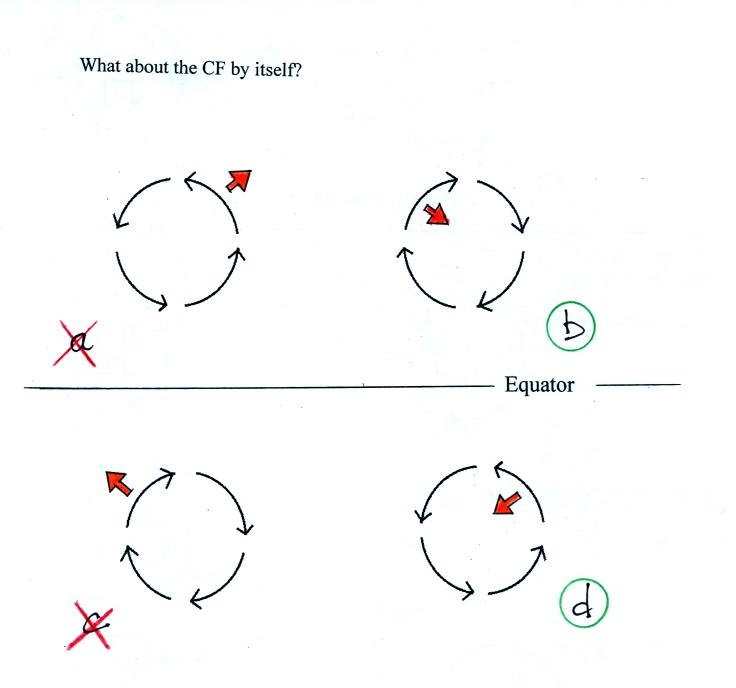
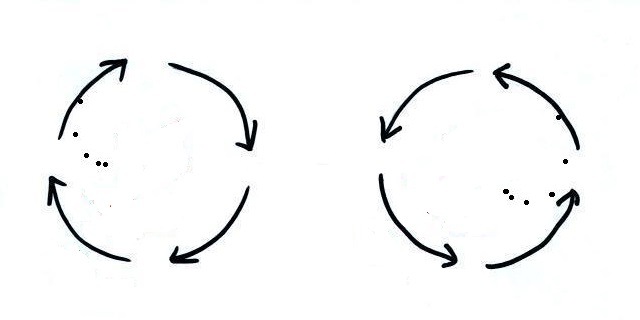
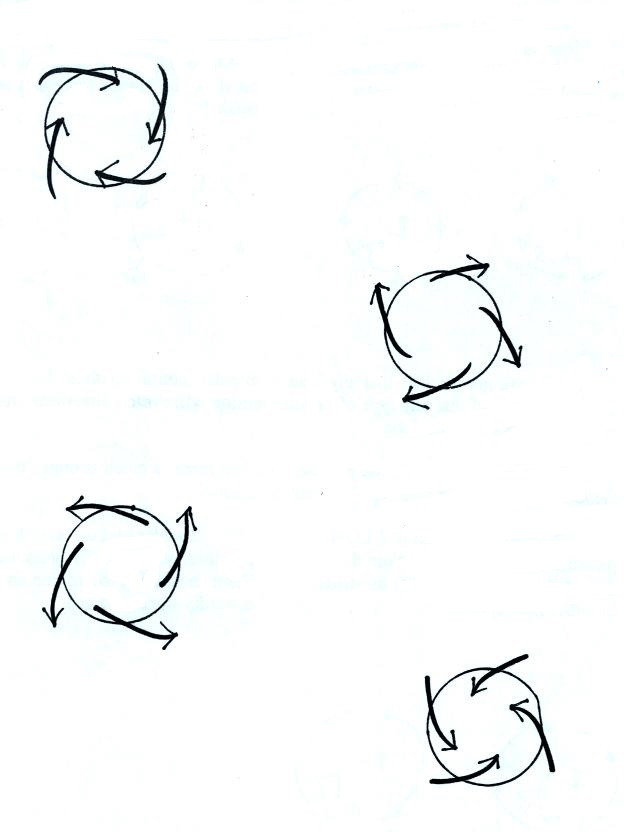
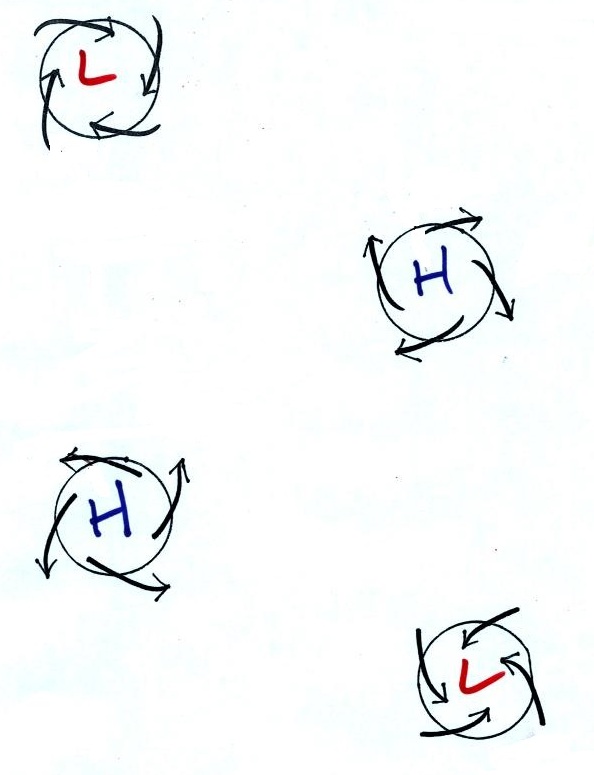
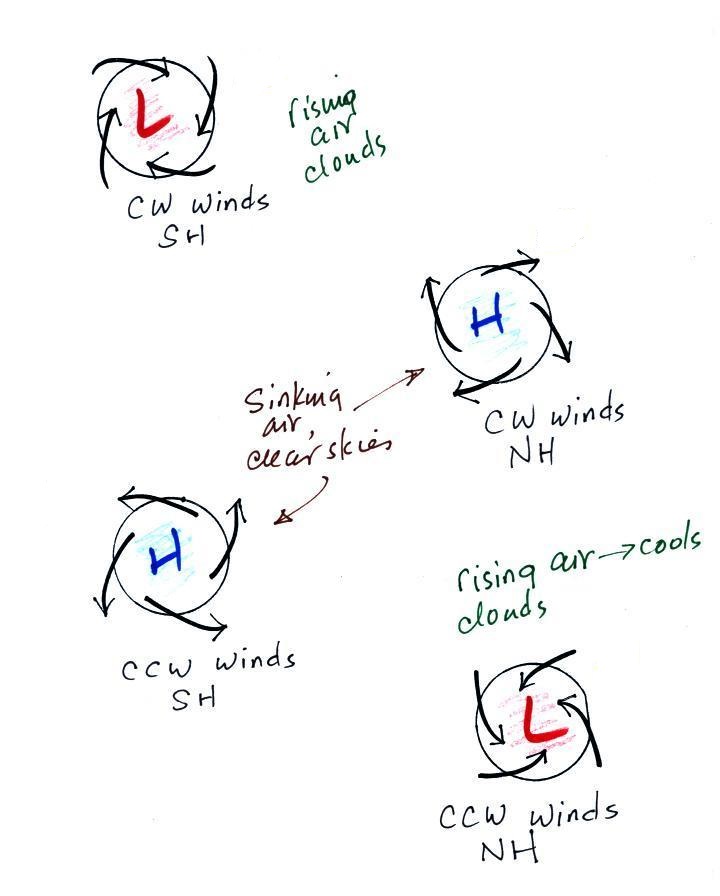
| Large scale winds upper level winds
blowing around Low pressure. You must take
into account both PGF and CF forces. Winds only spin in a
CCW direction around L in the northern hemisphere and
change direction in the southern hemisphere. |
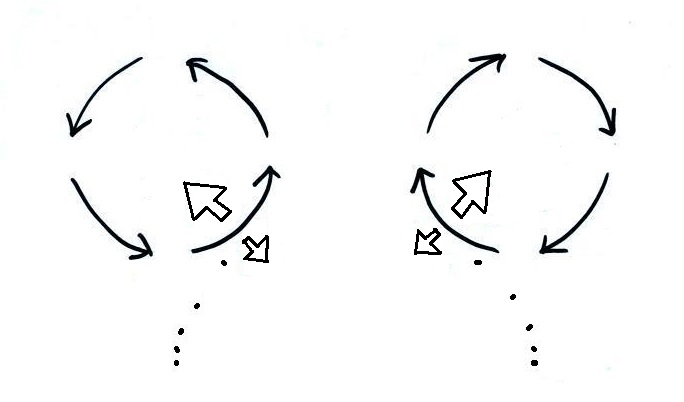
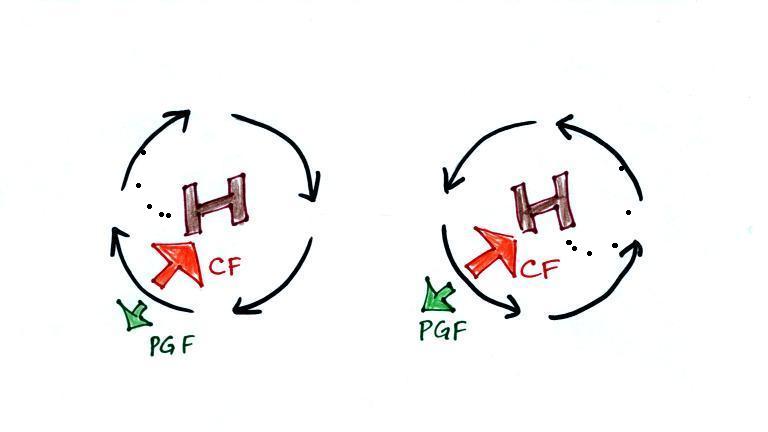
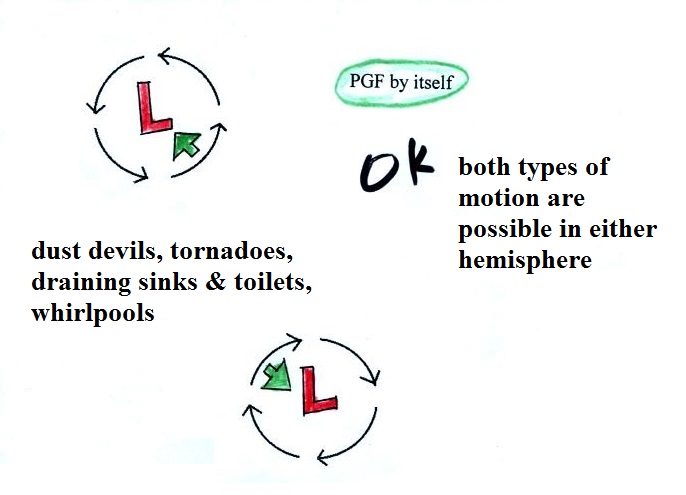
A net inward force is need
to keep winds spinning in a circular path. The
inward pointing PGF provides the needed net inward force
in this case and winds can spin in either direction around
the L in either hemisphere. |
| CW spin |
CCW spin |
|
| Fall 2013 |
35 |
29 |
| Spring 2014 |
24 |
17 |
| Fall 2014 |
12 |
24 |
| Spring
2015 |
17 |
26 |
| subtotal |
88 |
96 |
| Fall 2015 |
experiment
still in progress |
|
 |
 |
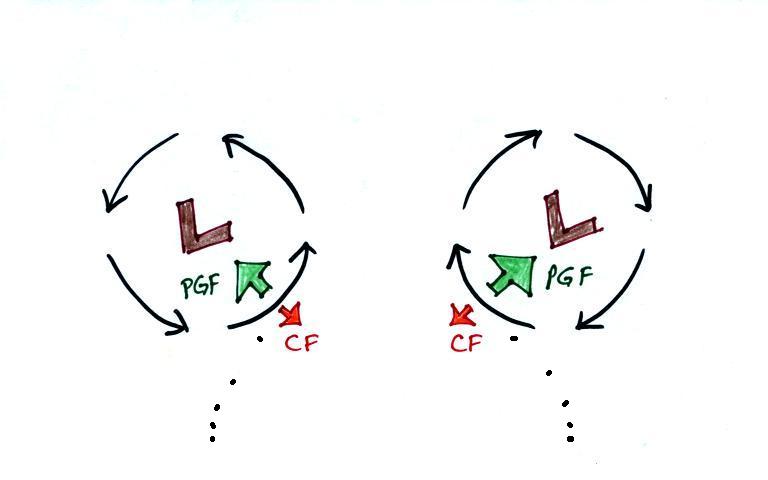
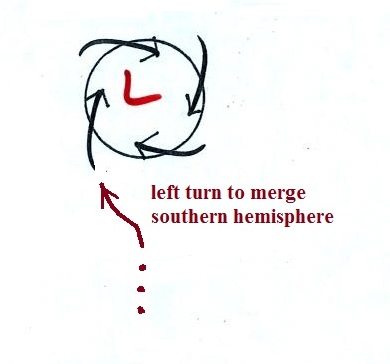
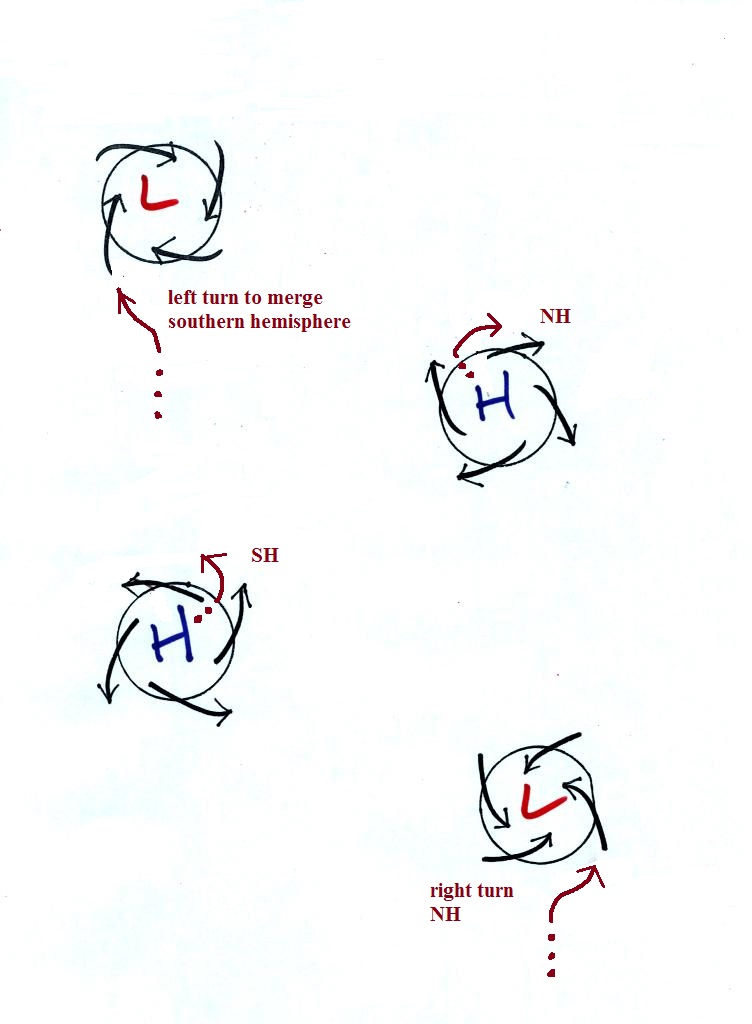
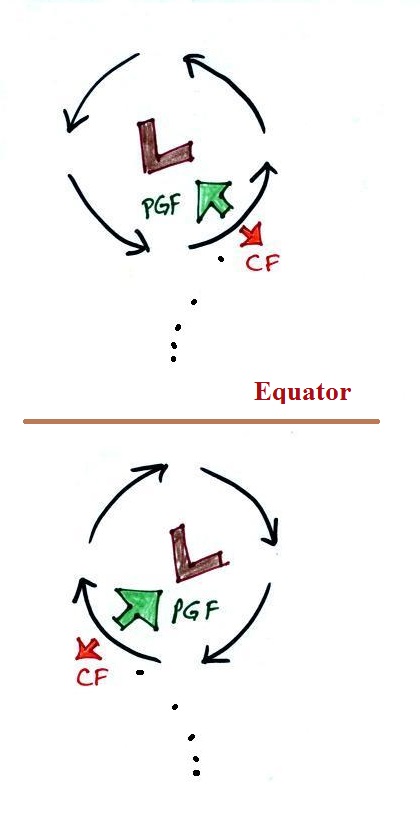
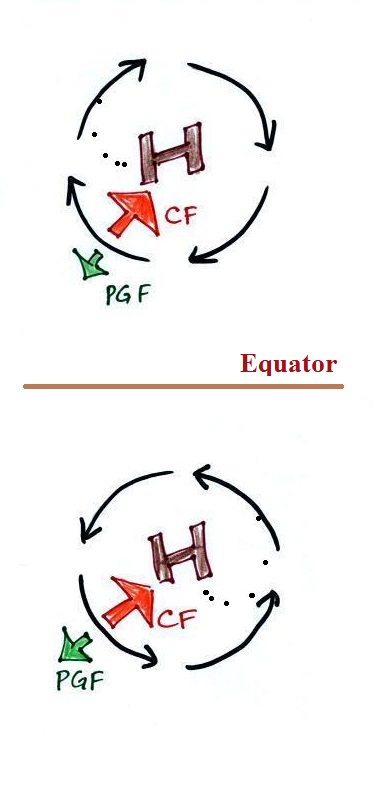
| The CF plays an important
role here, it is the force that provides the net inward
force needed to keep the winds blowing in a circular
trajectory. |
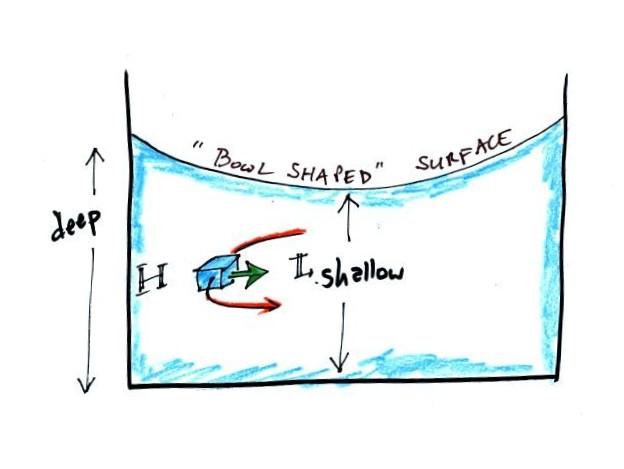
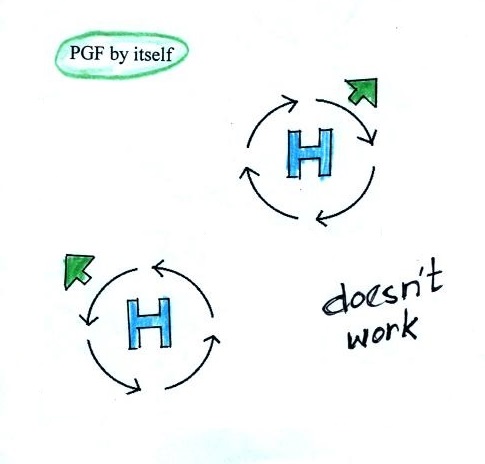
With just the
PGF there's nothing to provide a net inward force.
Circular winds around centers of high pressure is not
possible when there is no CF. |