One thing about the global warming debate that we know for sure is that concentrations of several greenhouse gases in the atmosphere are increasing due to the activities of man. The gases thought to be the largest contributors to global warming are listed in the tables below. As mentioned previously, the production and use of ozone-depleting CFCs has been greatly reduced in recent years, and the concentrations of these chemicals in the atmosphere have started to decline. However, the the ozone-friendly chemical substitutes, HFCs, PFCs, and SF6 are also greenhouse gases. Another greenhouse gas, ozone, has recently gotten some attention as a potential contributor to global warming. The concern is over increasing concentrations of ozone in the troposphere related to photochemical smog. In the table below, greenhouse gas concentrations are given in either ppm (parts per million), ppb (parts per billion), or ppt (parts per trillion), where, for example, one ppm means one molecule of greenhouse gas per one million gas molecules in the atmosphere.
Six of these greenhouse gases, carbon dioxide, methane, nitrous oxide, HFCs, PFCs, and sulphur hexafluoride, have been targeted for reduction by the Kyoto Protocol of 1997. Countries that signed the Protocol agreed to reduce their cumulative emissions of these gases to 5% below 1990 levels over the period from 2008 to 2012. The reductions are based on CO2 equivalents (see global warming potential table below). The Protocol does allow flexibility to countries to apply carbon offseting and market-based mechanisms, such as carbon trading, to meet their overall emission reduction goals. Some of the countries, which signed the Protocol, seem to be on track to meet their goal, while others have actually continued to increase their emissions. Here is a Wikipedia figure that shows the percentage change in carbon dioxide equivalent emissions in 2009 for countries that agreed to the Kyoto Protocol compared with the target emissions. The cited source for the data plotted in the figure is the International Energy Agency (IEA), publisher: IEA, Paris, France, 2012, Page 13, pdf version of full report "CO2 Emissions from Fossil Fuel Combustion". Notice that the United States did not sign or agree to the emission reductions set by the Kyoto Protocol.
|
Greenhouse Gas |
Concentration 1750 | Present Concentration | Percent Change |
Natural and Anthropogenic Sources (in bold) |
|---|---|---|---|---|
| Carbon Dioxide (CO2) | 280 ppm | 396 ppm | 41 % | Organic decay; Forest fires; Volcanoes; Burning fossil fuels; Deforestation; Land-use change |
| Methane (CH4) | 0.7 ppm | 1.8 ppm | 157 % | Wetlands; Organic decay; Termites; Natural gas & oil extraction; Biomass burning; Rice cultivation; Cattle; Refuse landfills |
| Nitrous Oxide (N2O) | 270 ppb | 324 ppb | 20 % | Forests; Grasslands; Oceans; Soils; Soil cultivation; Artificial Fertilizers; Biomass burning; Burning of fossil fuels |
| Chlorofluorocarbons (CFCs) | 0 | 900 ppt | Not Applicable | Refrigerators; Aerosol spray propellants; Cleaning solvents |
| Hydrofluorocarbons (HFCs) | 0 | ~110 ppt | Not Applicable | Ozone-friendly CFC substitute |
| Perfluorocarbons (PFCs) | <1 ppt | ~83 ppt | 7000 % | Very minute quantities exist naturally; Ozone-friendly CFC substitute; Aluminum smelting; semiconductor industry |
| Sulfur hexafluoride (SF6) | 0 | ~7 ppt | Not Applicable | Ozone-friendly CFC substitute; electronics, various industrial applications |
| Tropospheric Ozone (O3) | 25 ppb | 34 ppb | 40 % | Created artificially through photochemical smog production |
While most agree that these modest reductions agreed to in the Kyoto Protocol will have only a very slight impact on the rate of global warming, some say it is an important first step in getting the global community to recognize the issue and work together on possible solutions. The Kyoto agreement expired in 2012. World climate conferences held in Copenhagen, Denmark in 2009, Cancun, Mexico in 2010, and Durbin, South Africa in 2011 did not lead to any significant agreements for futher reductions in greenhouse gas emissions. An important on-going issue is that the largest increases in greenhouse gas emissions are coming from developing countries like China and India. In fact China has now surpassed the U.S. as the #1 emitter of greenhouse gases (this is for the entire country, the U.S. still emits the most per person). Developing countries have not shown much interest in agreeing to emission reductions, arguing that they are only trying to achieve the standard of living enjoyed in the developed world. If China will not agree to emission reductions, then the U.S. and some other developed countries will not agree mainly because emission controls will lead to higher energy prices and put the signing countries at an economic disadvantage. The other big reason holding up an international agreement is uncertainty about the ultimate effects of higher greenhouse gas levels on climate change.
In December 2012, the Doha Amendment to the Kyoto Protocol was adopted. Most of the countries that agreed to the first set of emission reductions by 2012 have now comitted to reduce their carbon equivalent emissions of greenhouse gases to levels at least 18% below 1990 levels during the period from 2013 to 2020. Once again the US did not agree to the Protocol. Two important countries that were part of the original Kyoto Protocol, Canada and Japan, decided to opt out of the Kyoto Protocol at the end of 2012 and did not agree to the new emission reductions. The new agreement includes one additional greenhouse gas, nitrogen trifluouride (NF3).
Outside of the Kyoto Protocol, there are many countries who have enacted or are considering enactment of greenhouse gas reduction policies. If you are interested, see Overview of Greenhouse Gas Control Policies in Various Countries. The debate about whether or not the US should adopt a national greenhouse gas emission reduction policy continues. As noted in the next section, total emissions have decreased in the US since 2007 in spite of the fact that there is no federal law specifically limiting emissions.
The increasing concentrations of four of these greenhouse gases are shown graphically below. Most, if not all, of the increases are due to human activities. Perhaps most alarming is that generally through the 1900s not only were the concentrations of these greenhouse gases increasing, but the rate of increase was also increasing. The change in the rate of increase shows up as a steepening of the slope of the growth curves with time as shown in the graphs below. Mathematically, this type of growth is more closely exponential than linear. For example, the rate of increase of carbon dioxide has increased over each 25 year period of the last century (shown in the table below). Also note that there has been an additional 8.2% increase in carbon dioxide over the 13 year period from 2001-2013. Thus, it was easy to conclude that little if any progress had been made in reducing greenhouse gas emissions worldwide through the twentieth century. In fact it was more correct to conclude that the rate at which we were adding greenhouse gases to the atmosphere had accelerated over most of the time period shown in the table and plots below.
|
Year |
CO2 concentration (ppm) |
% increase in 25 years |
1900 | 297 | --- |
|---|---|---|
| 1925 | 306 | 2.9% |
| 1950 | 318 | 3.9% |
| 1975 | 336 | 5.7% |
| 2000 | 366 | 8.9% |
| 2013 | 396 | 8.2% (13 yrs) |
 |
 |
| Carbon dioxide concentration (ppm) 1750-1998 | Methane concentration (ppb) 1750-1998 |
 |
 |
| Nitrous oxide concentration (ppb) 1750-1998 | Sulfur hexafluoride concentration (ppt) 1978-2000 |
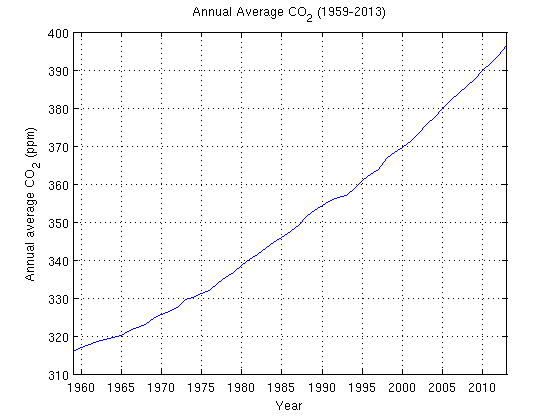
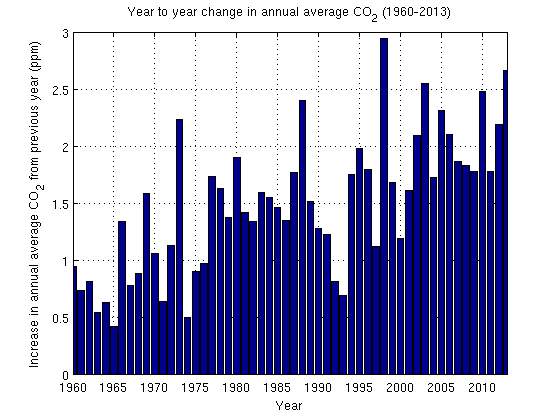
More up-to-date measurements of annual average carbon dioxide concentrations since 1959 are shown below. The annual average concentration of carbon dioxide were measured at the Mauna Loa Observatory on the island of Hawaii. Shown on the right are the year to year increases in carbon dioxide. While there is variability in the rate of increase from year to year, note that the rate of increase of carbon dioxide has stabalized around 2 ppm per year since the late 1990s. Thus, while CO2 concentrations continue to increase in Earth's atmosphere, it seems as if the rate of increase itself has stopped increasing. In fact there is some potentially good news on this issue. The emissions of greenhouse gases from most developed countries has decreased following the global economic slowdown in 2007, including the United States where emissions have fallen by 11%. Some of this is undoubtedly due to the slower economy. However, other reasons include the largescale shift to natural gas power generation, more fuel-efficient vehicles, and the development of renewable energy. At the moment, the reduction of emissions from developed countries is being offset by increased emissions from developing countries. For example, the use of coal for power generation has decreased in the US as it being replaced by natural gas. However, coal production in the US has not decreased since developing countries around the world are buying US coal for new power generation plants.
 |
 |
On a per molecule basis, not all greenhouse gases are equal in their enhancement to the greenhouse effect. The table below defines something called the global warming potential (GWP). The GWP estimates the relative enhancement to the atmospheric greenhouse effect on a per molecule basis. For example, one molecule of nitrous oxide is about 310 times more effective than carbon dioxide in its enhancement to the greenhouse effect on Earth. Some CFCs and their substitutes are up to 10,000 times more effective.
|
Gas |
GWP |
|---|---|
| Carbon dioxide (CO2) | 1 |
| Methane (CH4) | 21 |
| Nitrous oxide (N2O) | 310 |
| Hydrofluorocarbons | 560-12,100 |
| Perfluorocarbons | 6,000-9,200 |
| Sulfur hexafluoride | 23,900 |
Note: Typical GWP uncertainties are about ±35 percent.
Be careful not to be mislead by the table. The total enhancement to the greenhouse effect depends on the per molecule global warming potential times the number of molecules added to the atmosphere. Overall, carbon dioxide is still the largest contributor to global warming (enhanced greenhouse effect) because there is so much more of it emitted. The figure below, taken from the EPA Information on greenhouse gas emission shows that of all the greenhouse gases emitted worldwide in 2004, about 77% was CO2, 14% was CH4, 8% was N2O, and the remaining 1% includes the CFC substitutes.
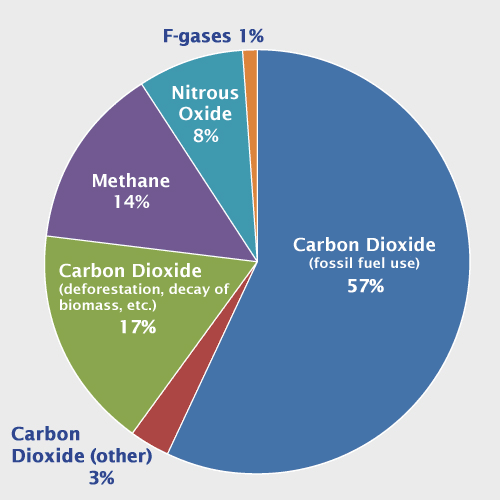 |
| Global Greenhouse Gas Emissions estimated for 2004. F-gases include fluorinated gases, such as hydrofluorocarbons (HFCs), perfluorocarbons (PFCs), and sulfur hexafluoride (SF6). |
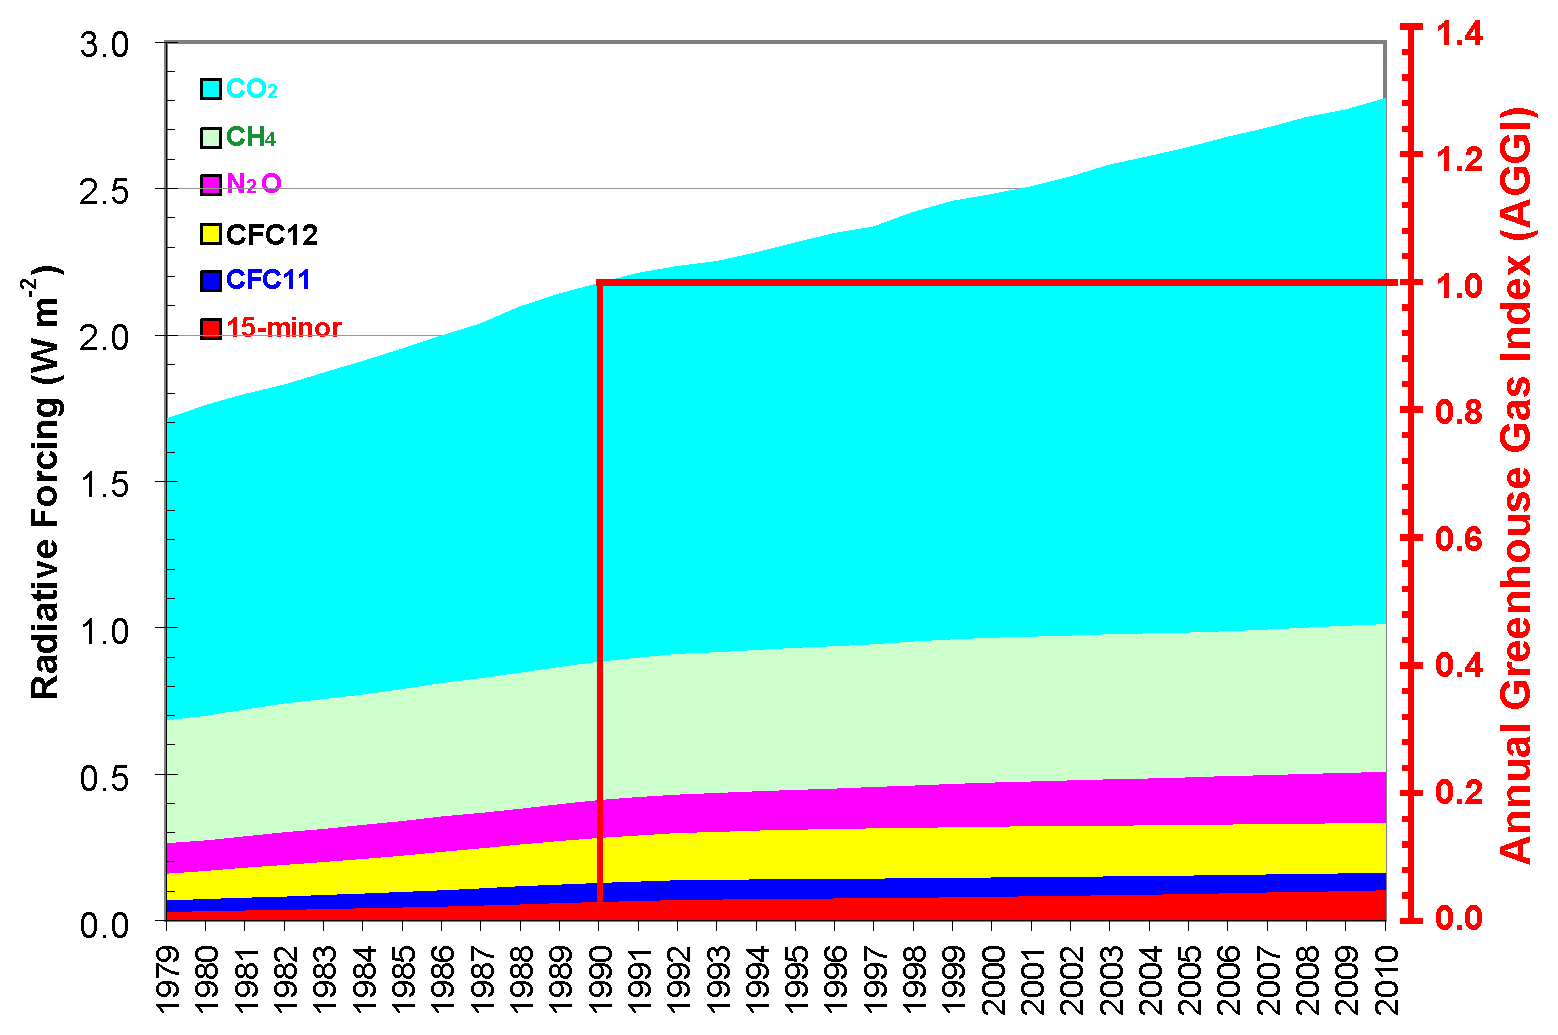
Presently, it is believed that the enhancement caused by carbon dioxide is still greater than the enhancements caused by all other human added greenhouse gases combined. Researchers have computed a number called "radiative forcing" that is meant to account for the influence that human-added greenhouse gases have had in altering the incoming and outgoing radiation energy for the planet Earth. Please see this figure showing radiative forcing for many human-added greenhouse gases, which shows the calculated radiative forcing for several greenhouse gases from 1979 to 2010.
There is no arguing that the concentrations of several greenhouse gases are increasing due to the activities of man. We can measure the increases. This increase in greenhouse gases is a perturbation or forcing to the climate system. Based on our discussion of the energy budget for the Earth, adding greenhouse gases should act to warm the surface of the Earth by enhancing the natural greenhouse effect. However, the way in which the climate system will ultimately respond to this perturbation of adding greenhouse gases is uncertain because the climate system is so complex. We simply do not understand all of the complex interactions and feedbacks that operate in the climate system. One source of uncertainty that we will discuss next is called the "Missing CO2 Sink". Even though we know how much CO2 is being released into the atmosphere, we do not know where it all goes. How can we expect to accurately predict future climate changes when we don't even know what happens to all of the CO2 that we add to the atmosphere? This is just one of many sources of uncertainty related to predictions of future climate changes.
_greenhouse_gas_emissions_limitations_targets_and_the_percentage_change_in_their_carbon_dioxide_emissions_from_fuel_combustion_between_1990_and_2009.png)