![]()
![]()
![]()
![]()
![[hurricane paths]](hurricane_zones.jpeg)
|
| Figure 3:In an average year, 90 - 100 tropical storms develop. This figure shows where they form and the most common paths they take. |
 |
| Figure 4: Sea surface temperature map for the northern hemisphere summer. The yellow, orange, and red colors show water temperatures warm enough to sustain hurricanes (> 26.5°C). |
Figure 3 shows where most hurricanes are born and the general direction in which they move. Notice that they form over most of the tropical ocean basins, except in the tropical South Atlantic and in the tropical eastern South Pacific, which are the tropical ocean basins on either side of South America. The ocean surface temperatures in these areas are too cold throughout the year for tropical storm development (see figure 4). The warm waters of the Western North Pacific is the world's hot spot for tropical storm development. Click on the link to view a Global map showing the tracks of all tropical cyclones from 1985 to 2005. The figure clearly shows the western Pacific hot spot, the lack of storms near South America, and the vulnerability of the entire US Atlantic and Gulf coast to hurricane strikes.
The table below give statistics for an "average" season in each ocean basin. The numbers in the table are slightly different from the numbers in figure 3. This is because figure 3 is based on an averaging period of 1900 to 2000, while the numbers in the table are based on an averaging period of 1950 to 2000.
Tropical storms and hurricanes most commonly move from east toward west, especially early in their lifecycles. There is a tendency for these storms to curve away from the equator toward the end of their lifecycles. This is true for both Northern and Southern Hemisphere storms. However, as discussed below, a given hurricane can move in any direction.
| Basin | Season Start | Season End | Tropical Storms | Hurricanes | Major Hurricanes |
|---|---|---|---|---|---|
| Northwest Pacific | Year Round | Year Round | 26.7 | 16.9 | 8.5 |
| Northeast Pacific | May | November | 16.3 | 9.0 | 4.1 |
| Southwest Indian | October | May | 13.3 | 6.7 | 2.7 |
| North Atlantic | June | November | 10.6 | 5.9 | 2.0 |
| Australia Southwest Pacific | October | May | 10.6 | 4.8 | 1.9 |
| Australia Southeast Indian | October | May | 7.3 | 3.6 | 1.6 |
| North Indian | May | November | 5.4 | 2.2 | 0.4 |
It is shown above that the official Atlantic Hurricane season lasts from June first through the end of November, and that on average, there are 10.6 tropical storms, 5.9 hurricanes, and 2.0 major hurricanes (category 3 and higher). Figure 8 shows that Atlantic hurricane activity peaks in early September and that storms occasionally form outside the official hurricane season in May and December. This pattern of hurricane occurrence is closely correlated with the seasonal change in Atlantic sea surface temperature. The highest sea surface temperatures in the Atlantic typically occur in early September.
 |
| Figure 8: Average number of Atlantic Hurricanes per century as a function of calendar date. |
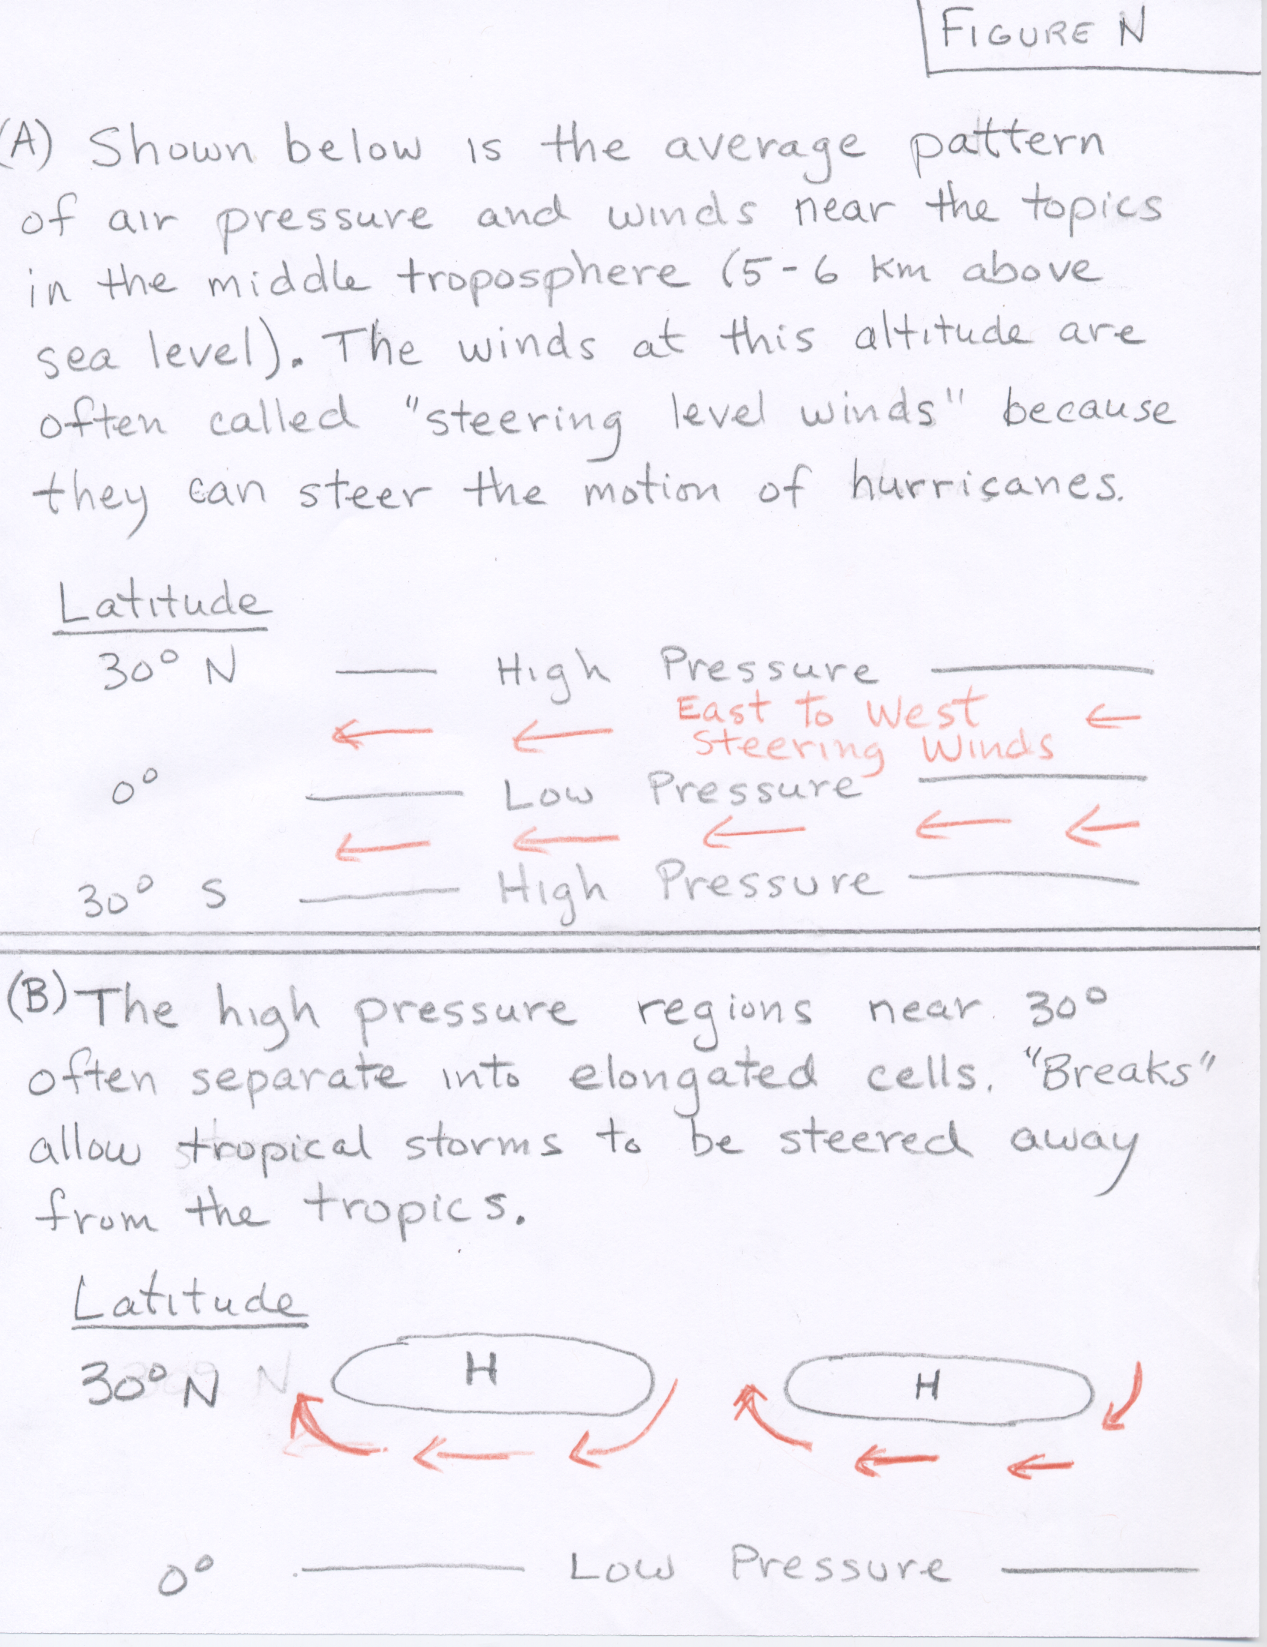
The most important determinent of hurricane movement is the local environmental air flow in the middle troposphere. In other words, hurricanes tend to be "steered" around by the winds blowing at about 500 mb pressure (5 to 6 km above sea level). In late summer and early fall the "typical" wind patterns at 500 mb are generally easterly (or east toward west) below or south of 30° North latitude and westerly (west toward east) above or north of 30° North latitude. The reason for this is that a broad and elongated area of higher pressure is typically found near 30° latitude (See Figure N (top)). The reason these "steering level" winds blow parallel to the pressure contours is because these are upper level winds, not surface winds. The reason why the winds south of the equator are also east toward west is that the Coriolis force turns the winds 90° to the left of the pressure gradient force in the Southern Hemisphere, while in the Northern Hemisphere the Coriolis force turns the wind 90° to the right of the pressure gradient force. Differences between the northern and southern hemisphere will not be emphasized in this course. You should be famailar with what happens in the Northern Hemisphere.
Northern Hemisphere hurricanes that are below or south of 30° latitude will generally be steered from east to west. However, as shown in figure 3 above, it is not uncommon for hurricanes turn away from the equator (toward the north in the Northern Hemisphere and toward the south in the Southern Hemisphere) at some point along their track. If hurricanes move north of 30° latitude, they often make a turn toward the east or begin moving from west toward east. This is because the steering level winds north of 30° latitude are typically west toward east.
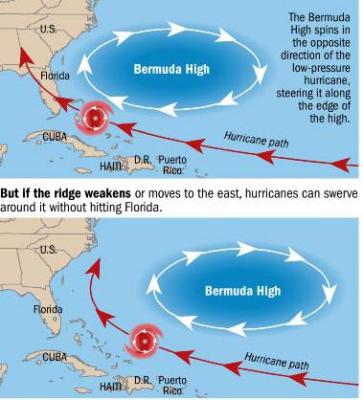 |
| Figure 5: Burmuda high and hurricane tracks. |
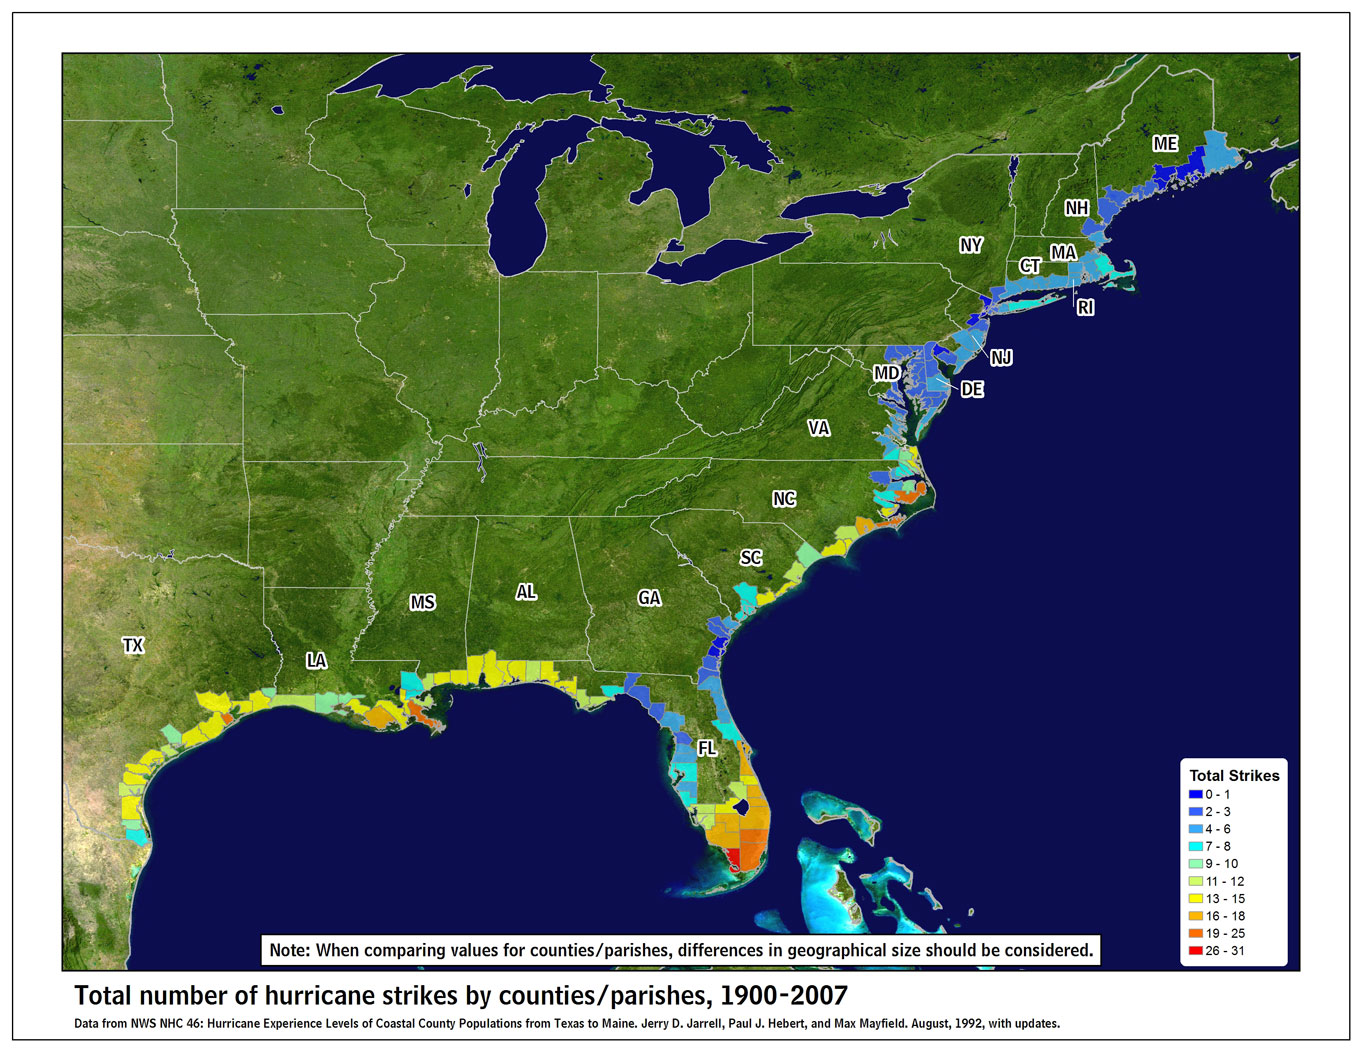
The subtropical high pressure area over the Atlantic ocean is often found as a high pressure cell (See Figure N (bottom)). While the position and overall size of this feature changes, its center is often located near the island of Burmuda, hence it is often called the Burmuda High. This is quite important to hurricane movement in the vicinity of the United States as shown in figure 5. In the top panel, tropical cylones moving across the Atlantic will turn northward before reaching Florida, while in the bottom panel, they are steered toward the east coast of Florida. In situations where the Burmuda high extends slightly further west, tropical systems can be steered toward the west either across Florida or south of Florida before turning north to hit the gulf coast. If the Burmuda high extends even further west, tropical storms can move west right across the Gulf of Mexico and hit Texas or Mexico. A figure showing the number of Atlantic landfalling US hurricanes from 1900 - 2007 by county has been produced by the National Hurricane Center.
Recall from previous material that the position of another subtropical high pressure cell (often called the monsoon high in this region of the country) is a very important feature in the transition to the summer monsoon season in Arizona. Its position on a given day often determines the direction of the 500 mb winds over Tucson. When the monsoon high is in a position north of Tucson, the steering level winds over Tucson are from the east, which is favorable for local thunderstorms. For example, when the monsoon high is centered over the four corners region, a fairly common position, the clockwise flow around the high results in easterly 500 mb winds over Tucson. Coversely, when the monsoon high is located south of Tucson, Tucson will have westerly 500 mb winds, which is generally not favorable for local thunderstorms.
Once hurricanes move north of 30° latitude, they generally pick up speed (because the steering winds generally become stronger away from the topics) and will eventually turn toward the east (because prevailing 500 mb winds in the middle latitudes are more likely to be from west to east). When tropical storms move into the middle latitudes, it is common for them to get "picked up" by the winds associated with a 500 mb longwave trough and move toward the north and east. The areas of the United States at risk from Atlantic hurricanes includes the entire Gulf of Mexico coastline and the entire eastern seaboard, which includes the larger northeastern cities like New York. This was made obviously clear with Hurricane Sandy, which devastated parts of the large metropolitan areas of the northeastern United States. While it is much less likely that a major hurricane will hit New York City compared with areas further south, it has happened in the past History Reveals Hurricane Threat to New York City. Note that the article was written in 2005 before hurricane Sandy. The "Great Hurricane of 1938" slammed into Long Island and devistated much of southern New England as a category 3 storm. The last direct hit on New York City was back in 1821. Because much of the New York metro area is just above sea level, the city quite vulnerable to a strong hit. To make matters worse, the only way a really strong hurricane is going to hit New York City is if it turns north and moves very quickly, so that it does not have time to weaken much as it moves over colder water, potentially leaving little time for evacuations.
Although the west coast of the United States has never been hit by a hurricane, it is not all that uncommon for the west coast and desert southwest to get heavy rain events from remnants of eastern Pacific tropical storms and hurricanes (see California's Tropical Storms). As shown in figure 3 above, most eastern Pacific hurricanes move westward out into the Pacific ocean away from the North American continent. However, if a storm gets "picked up" by the winds associated with a middle latitude 500 mb trough, it can be turned north and east back toward North America. This is most likely to happen late in the hurricane season (mid-September and later) because as the seasons change, there is enough cold air that troughs can begin to dig into southern parts of the US. As these storms move northward, they encounter the colder waters of the eastern Pacific and weaken below hurricane strength before reaching the United States. Basically, it is the cold sea surface temperatures along the southwest Pacific coast that prevent hurricanes from reaching the western United States. Further south along Baja California and the Mexican Pacific coast, the water can be warm enough to support hurricanes, and these areas do experience hurricanes from time to time. Current sea surface temperatures in Tropical Eastern Pacific region.
The text above summarizes the typical paths taken by hurricanes. However, as many of you know the actual path taken by a hurricane can be caotic and difficult to predict. One difficulty lies in the fact that the upper level winds that can steer hurricanes (pressure levels at 500 mb and higher altitudes) are often quite weak in the tropics.
 |
| Figure 6: Official Track Errors for Atlantic Ocean Tropical Storms and Hurricanes by decade (source NHC) (n mi = nautical miles, where 1 n mi = 1.15 mi) |
The National Hurrican Center in Miami, Florida uses sophisticated computer models to predict hurricane movement. Forecasters use these models to predict both the hurricane track, i.e., the future position of the storm center, and the hurricane's intensity, i.e., will it stengthen or weaken in the future. Although there are still many aspects of hurricane evolution that we do not understand, steady progress has been made in improving forecasts of hurricane movement or future position (see Figure 6).
A more challenging problem is to predict the future intensity of hurricanes, that is will they strengthen or weaken and how fast will these changes occur. The problem here is caused by both by our lack of understanding of hurricane evolution, which results in poor forecasts by computer models, as well as the lack of observations or measurements near the storm's center, which are necessary to understand exactly what is happening. The big problem is pointed out by Max Mayfield, director of the National Hurricane Center -- "Most major hurricanes become major hurricanes by going through some rapid intensification cycle that we just don't understand ..." This sets up the possibility of what Mayfield calls his "nightmare scenario" -- where for example, a rather weak hurricane just off the coast rapidly intensifies to a major hurricane overnight, and slams into a coastal region where the population is unprepared. "We still haven't had that nightmare scenario where people go to bed prepared for a Category 1 hurricane and wake up to a Category 4," Mayfield says. "That's going to happen one of these days, and it's going to be devastating."
 |
| Figure 7: Example showing area over which hurricane warnings are issued (source NHC) |
With modern techniques of forecasting and tracking hurricane paths, it is always possible to issue warnings about the "probable" locations that will be affected by any given hurricane. Although hurricanes can be easily tracked using satellite data, predictions of their future movement and intensity are by no means certain. Based on the estimated uncertainty in future hurricane movement, hurricane watches and warnings are issued for a wide swath as shown in Figure 7. The National Hurricane Center defines hurricane watches and warnings as follows:
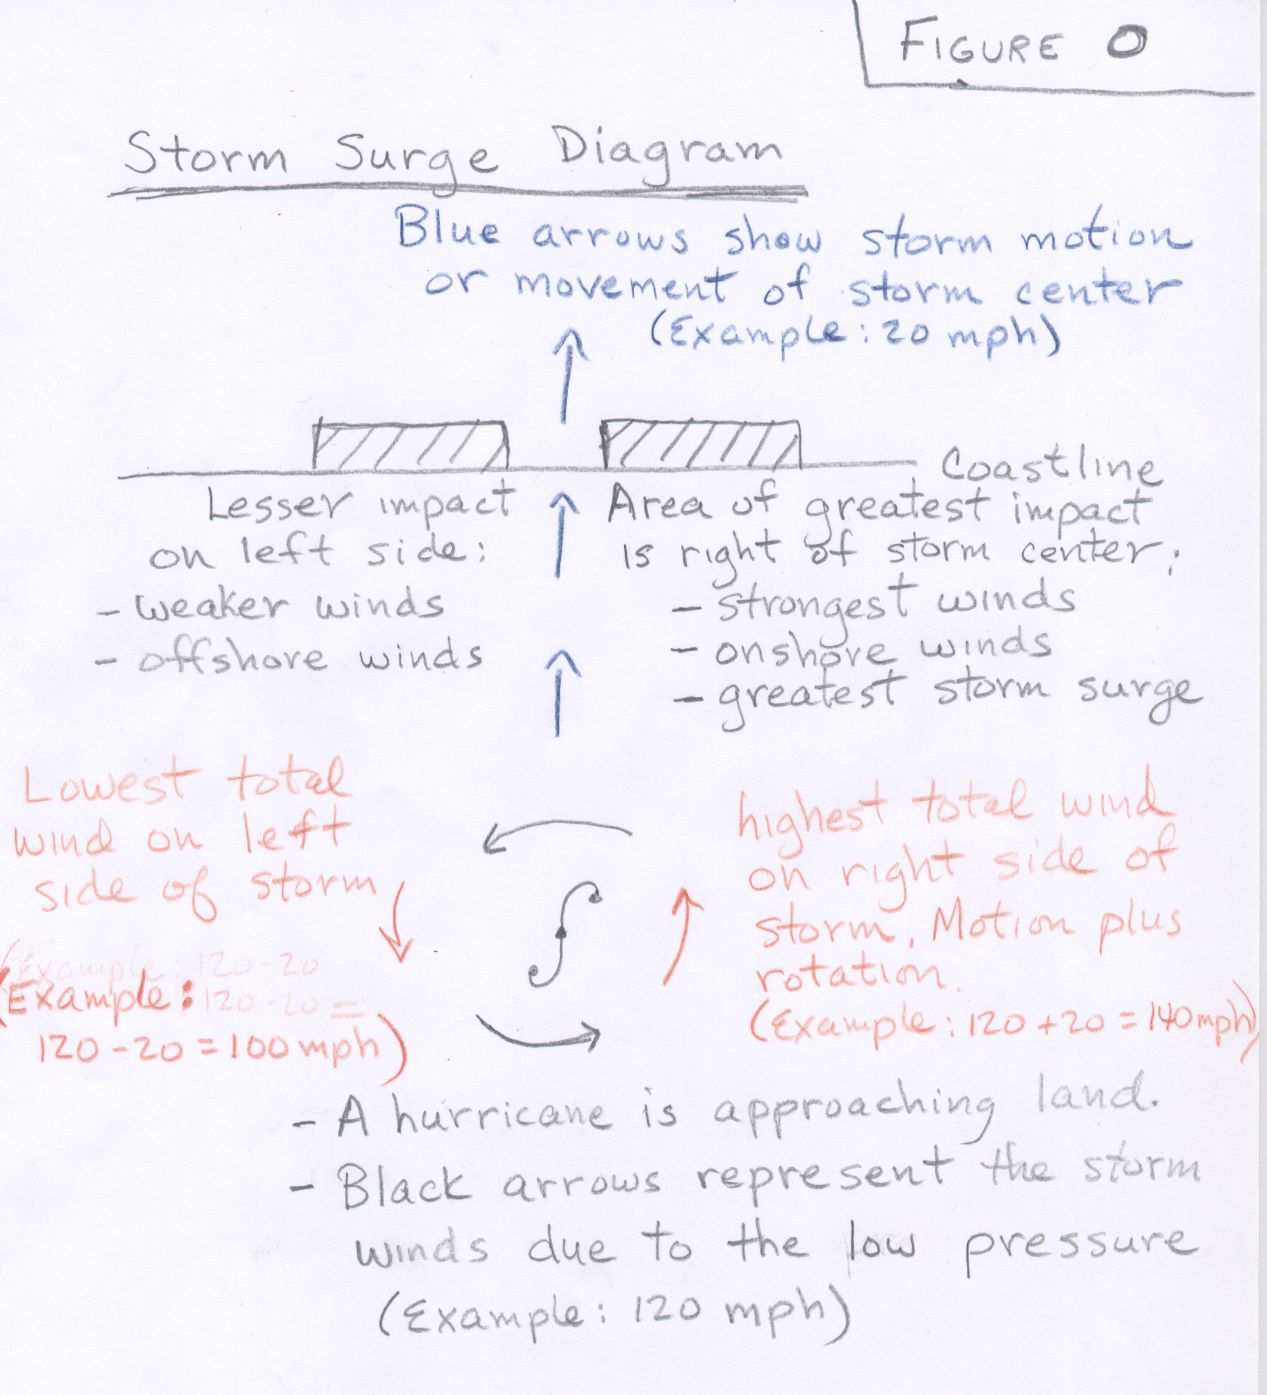
Although we usually categorize hurricanes in terms of their windspeed (see Safir-Simpson table below), coastal flooding due to what is called the storm surge usually causes the most damage. A storm surge is an abnormally high rise in sea level along a shoreline caused primarily by high winds pushing and piling up water. It can be rather misleading to think of the storm surge as big waves. The storm surge is a large dome of water that can be over 100 km in width, which sweeps over the coastline. Storm surges have demolished marinas, piers, boardwalks, houses, and other shoreline structures, while eroding beaches and washing out coastal roads and railroads. The height of the dome of water depends on the windspeed as shown in the Saffir-Simpson table below. With a hurricane (in the Northern Hemisphere), the most damaging storm surge and strongest winds occur to the right of the storm's center. The right side of the storm is where the wind blows directly onshore and where the windspeed is highest for a moving storm (See Figure O). You are expected to understand the reason why the greatest potential damage from landfalling Northern Hemisphere hurricanes happens in the region just to the right side of the where eye makes landfall, as described in Figure O.
The damage potential associated with a storm surge depends upon many factors. Some of the most important factors include:
 |
| Gradually sloped shoreline |
 |
| Steeply sloped shoreline |
Forecasting the storm surge that will happen as a hurricane makes landfall is complicated. Forecasters must rely on computer models. The models need to accurately account for the shape and slope of the coastline in relationship to the wind direction. Accurately predicting the storm surge near inlets, bays, and river outlets is quite challenging as described in the link.
The strong winds generated by hurricanes can cause considerable damage. Hurricane strength winds can damage or destroy vehicles, buildings, bridges, etc. High winds also turn loose debris into flying projectiles, making the outdoor environment even more dangerous. As hurricanes come in many sizes, the area covered by hurricane force winds is a factor in the total amount of damage done. For example, not only was Katrina a very powerful storm, it was also a very large storm.
Flooding caused by the heavy rains associated with hurricanes is another concern. This is dangerous when a slow moving or nearly stationary hurricane sits just offshore causing a prolonged period of heavy rains over nearby coastal areas. This can be especially problematic if the nearby coast has sharply rising mountains, enhancing the heavy rains by orographic lifting, with the runoff causing landslides.
Damage may also occur from hurricane-spawned tornadoes that may form as the hurricane interacts with land areas. Most hurricanes that strike the United States produce at least one tornado. About one-quarter of them produce significant numbers of tornadoes. Tornadoes are most likely to develop in the right front quadrant of the storm (in relation to the motion of the storm), and are more likely to be associated with a spiral rain band rather than the storm's center. They result from the vertical wind shear that often develops in the lower levels of the hurricane's circulation as the storm winds interact with the land. Most hurricane-spawned tornadoes are of the weak variety (compared to the monsters that can form over the great plains of the United States), but can still produce significant damage.
Hurricanes weaken rapidly after making landfall since the storm is cutoff from its fuel supply (the warm ocean water). Although winds weaken, heavy and flooding rains may move far inland with the storm remnants.
In summary, the possible dangers associated with a hurricane are:
In an effort to estimate the possible damage of a hurricane's sustained winds and the storm surge could do to a coastal area, the Saffir-Simpson scale was developed (see table below). Hurricanes that reach category 3, 4, or 5 strength are called major hurricanes. One problem with this classification system is that it does not accout for the size of the storm (the areal extent of hurricane and tropical force winds). As we have seen with Katrina in 2005 and Ike in 2008, large storms can produce a much larger storm surge than estimated in the tables below, which is solely based on the windspeed of the storm.
| Scale Number (Category) |
Central Pressure mb (in.) |
Winds mi/hr (knots) |
Storm Surge ft (m) |
Damage |
|---|---|---|---|---|
| 1 | >980 (>28.94) | 74-95 (64-82) | 4-5 (~1.5) | Damage mainly to trees, shrubbery and unanchored mobile homes |
| 2 | 965-979 (28.50-28.91) | 96-110 (83-95) | 6-8 (~2.0-2.5) | Some trees blown down; major damage to exposed mobile homes; some damage to roofs of buildings |
| 3 | 945-964 (27.91-28.47) | 111-130 (96-113) | 9-12 (~2.5-4.0) | Foliage removed from trees; large trees blown down; mobile homes destroyed; some structural damage to small buildings |
| 4 | 920-944 (27.17-27.88) | 131-155 (114-135) | 13-18 (~4.0-5.5) | All signs blown down; extensive damage to roofs, windows, and doors; complete destruction of mobile homes; flooding inland as far as 10 km (6 mi); major damage to lower floors of structures near shore |
| 5 | <920 (<27.17) | >155 (>135) | >18 (>5.5) | Severe damage to windows and doors; extensive damage to roofs of homes and industrial buildings; small buildings overturned and blown away; major damage to lower floors of all structures less than 4.5 m (15 ft) above sea level within 500 m of shore |
Ever wonder what it would be like to be near the coast when a major hurricane strikes? Many amateur videos taken during and after hurricane Katrina can be viewed YouTube index of Hurricane Katrina vidoes.
Map indicating the location and strength of all major landfalling hurricanes (category 3 and higher) in the United States from 1899 through 2008. The overall average is slightly less than one per year. 2005 had a record of four major landfalling hurricanes: Dennis, Katrina, Rita, and Wilma.
![]()
![]()
![]()
![]()