![]()
![]()
![]()
![]()
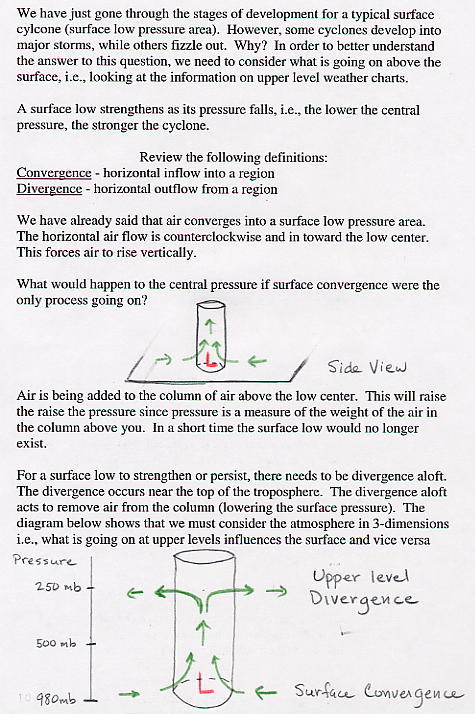
Cyclogenesis is the development and strengthening of surface low pressure areas in the middle latitudes of the globe. These surface low pressure systems are sometimes referred to as cyclones, where a cyclone is defined as a near circular air flow that is in the same direction as the rotating Earth, which is counterclockwise in the northern hemisphere and clockwise in the southern hemisphere. In the northern hemisphere, winds around low pressure centers blow counterclockwise and spiral inward. This inward flow at the surface (convergence) forces rising motion in the vicinity of cyclones. Clouds and precipitation form where air rises. Because cyclones often produce precipitation, they are sometimes just referred to as "storms".
You should realize that these wintertime "storms" are rather large areas of unsettled weather that often produce windy conditions and widespread rain and snow. On surface weather maps, a winter storm will show up as a large area of surface low pressure, perhaps marked with and "L". This is different from what we mean when we refer to summertime thunderstorms, which are spatially quite small, as "storms". Summer storms derive most of their energy from the latent heat release during cloud formation. This is also true for the development of tropical cyclones and hurricanes ... tropical lows intensify mainly because of the latent heat release during cloud formation, which forms a "warm core" low. On the other hand, much of the energy for winter storms or cyclones is derived from the temperature difference (and hence density difference) between cold air masses from the arctic and warm air masses from the tropics (see Energy available for cyclogenesis). Most of the action occurs where warm and cold air masses clash. The polar front is the generic name given to the boundary that separates warm tropical air masses from cold arctic air masses On 500 mb maps the polar front is delineated by the main trough/ridge pattern.An air mass is a large area of air (typically thousands of square km) with nearly uniform properties of temperature and humidity. Air masses form when air remains stagnent or sits over a region for a few days or longer. These regions are dominated by persistent high pressure at the surface and light winds. After a few days, the air mass takes on the properties of the underlying surface. Concerning winter weather for the United States, cold air masses often develop over northern Canada or the northern Pacific Ocean, while warm air masses often develop over the Gulf of Mexico or the tropical Pacific Ocean.
Once air masses form, they may be put into motion by the large scale weather
pattern. A 500 mb height map is a good way to view the large scale weather pattern.
![[front]](front_lifting.gif) Cold air masses are often pushed southward where the 500 mb winds are from the north, while
warm air masses are often pushed northward where the 500 mb winds are from the south.
On surface weather maps, a weather front is simply the boundary between two different air masses.
Where a cold air mass is invading an area currently covered by a warmer
air mass, a cold front is indicated on a surface weather map.
Conversely where a warm air mass is invading an
area currently covered by a colder air mass, a warm front is indicated on a surface weather map.
If neither the cold nor warm air is advancing, the frontal zone is
marked by a stationary front.
Weather fronts are marked on surface weather maps. Fronts often produce "weather" in the
form of clouds and precipitation because air is forced to rise upward along the front.
All fronts
slope in the vertical so that the warmer (less dense) air mass
sits on top of the colder (more dense) air mass. In other words,
the warmer air mass is forced to rise over the colder air mass. Thus, the location of
weather fronts on surface maps are important to see the boundary between and warm and cold
air as well a region where air is forced to rise upward, which is necesary for clouds and precipitation to form.
Cold air masses are often pushed southward where the 500 mb winds are from the north, while
warm air masses are often pushed northward where the 500 mb winds are from the south.
On surface weather maps, a weather front is simply the boundary between two different air masses.
Where a cold air mass is invading an area currently covered by a warmer
air mass, a cold front is indicated on a surface weather map.
Conversely where a warm air mass is invading an
area currently covered by a colder air mass, a warm front is indicated on a surface weather map.
If neither the cold nor warm air is advancing, the frontal zone is
marked by a stationary front.
Weather fronts are marked on surface weather maps. Fronts often produce "weather" in the
form of clouds and precipitation because air is forced to rise upward along the front.
All fronts
slope in the vertical so that the warmer (less dense) air mass
sits on top of the colder (more dense) air mass. In other words,
the warmer air mass is forced to rise over the colder air mass. Thus, the location of
weather fronts on surface maps are important to see the boundary between and warm and cold
air as well a region where air is forced to rise upward, which is necesary for clouds and precipitation to form.
In general, a rather narrow transition zone develops between two large bodies of air (air masses), which is called the frontal zone. Ideally, the polar frontal zone circles the northern hemisphere, marking a boundary between cold arctic air to the north and warmer subtropical air to the south. The shape of the idealized polar front would basically follow the wavy pattern of the 500 mb troughs and ridges. Cyclogenesis most often occurs along this polar front, especially underneath areas located just downstream of 500 mb troughs because in these areas upper tropospheric divergence is occurring.
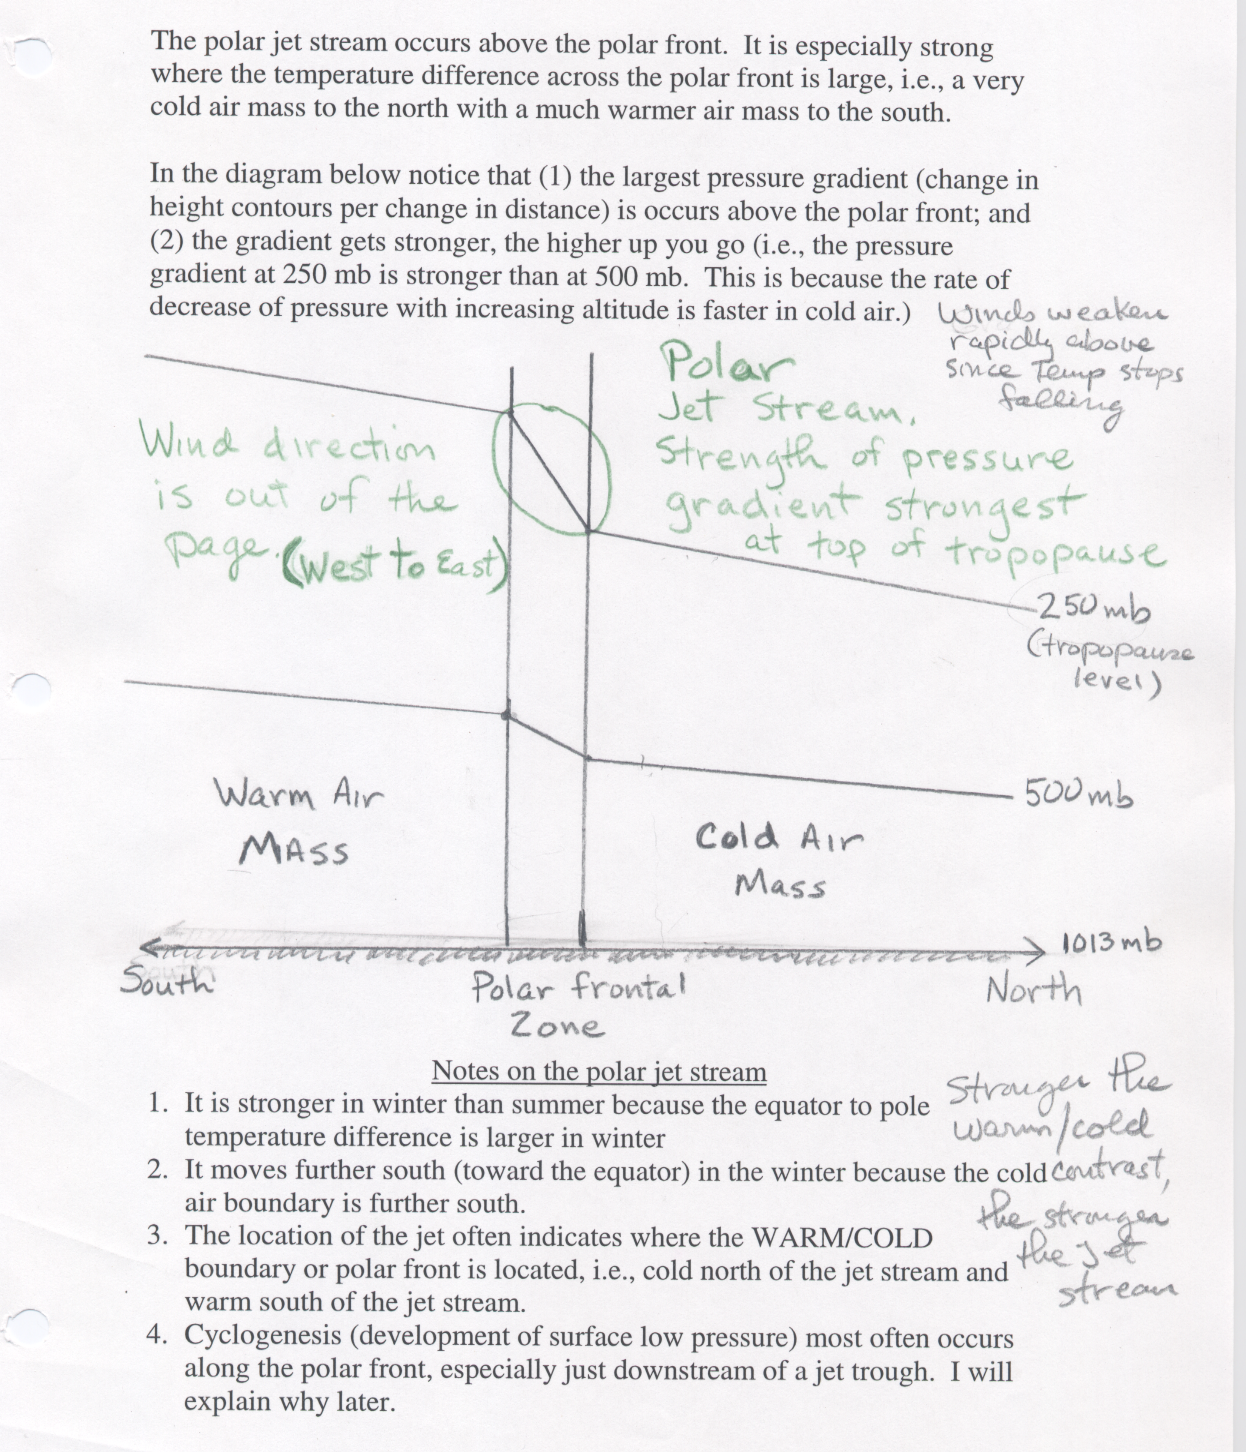
The polar jet stream a very fast moving current of air located near the top of the troposphere where air pressure is about 250 mb and the altitude is close 10 km. The polar jet stream occurs above the polar front. Energetically, the polar jet stream can be explained by the large pressure gradient (rapid change of the height of the 250 mb pressure surface over a short horizontal distance) that occurs above the polar front (see link provided in the next paragraph). The name jet stream was coined because high-flying military pilots encountered them during World War II. The polar jet stream generally flows from west to east, but follows a wavy path with troughs and ridges, just like the 500 mb flow. Today, commercial jets fly at altitudes near the jet stream. This is why flights from west to east are generally faster than flights from east to west. There is also a subtropical jet stream, which you may have heard mentioned in weather discussions, but we will not be able to cover that in this class.
Please take a look at A pictorial discussion of the polar jet stream. You should be able to explain why the polar jet stream is found above the polar front and why the wind speed above the polar front increases with increasing altitude such that the strongest winds (jet streams) are found near the top of the troposphere. Based on the discussion and figure above, you should be able to understand why a mid-latitude frontal zone produces a vertical wind shear pattern where wind speed increases with increasing altitude. Such a wind shear pattern can aid in the development of severe thunderstorms (assuming conditions are otherwise favorable for the development of thunderstorms).
Map showing current and forecast positions of jet streams over the United States
The position of the polar front (or warm/cold boundary) is not fixed but moves south and north within the middle latitudes in the winter. We have already seen evidence for this in the 500 mb height patterns. In 500 mb troughs, the polar front moves south as cold air masses plunge southward and in 500 mb ridges, the polar front moves northward as warm air masses push northward.
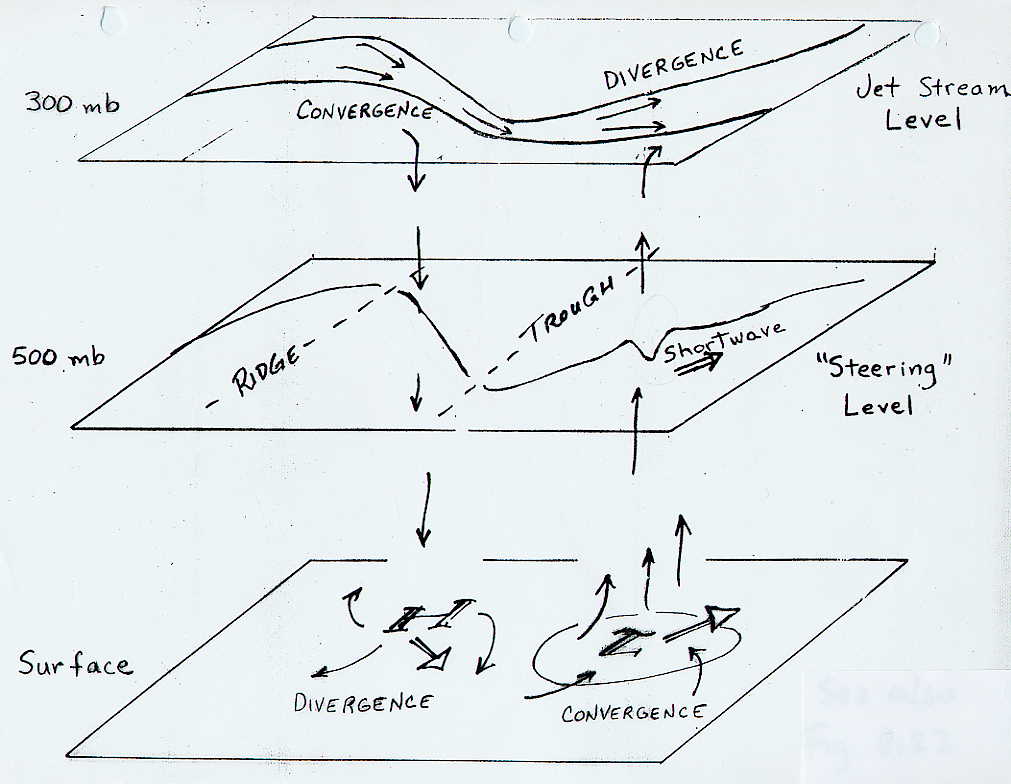
In addition within the 500 mb pattern, rising motion and precipitation is most likely just downwind of 500 mb troughs. In order for everything to work together and be consistent, it should make sense to you that surface low pressure (associated with rising motion) will be found underneath regions just downstream of 500 mb troughs. An idealized picture is shown below.

|
| Typical mid-latitude winter weather system. Green wavy lines represent the 500 mb height pattern. The red circles represent the pattern of sea level isobars around a surface low and high pressure. Notice how the surface circulation brings cold air southward (under the 500 mb trough) and warm air northward under the 500 mb ridge. In this way middle latitude circulations transport energy from the equator toward the poles. |
Below is a series of three links to lecture notes that I used in a previous class. It shows an idealized representation of the lifecycle of a middle latitude surface cyclone from birth to death. The last page shows the energetics involved. Weather fronts are sloped in the vertical so that warm air is always lifted above colder air. This should help you to understand the precipitation patterns shown in the links below. Don't be concerned about the occluded front, just realize that it also forces lifing of air.
Cyclogenesis Notes - page 1Finally, we need to put this all together to get a 3-D picture of what occurs
during cyclogenesis. As mentioned above, developing surface low pressure areas,
which are characterized by surface convergence and rising motion, will tend to form
underneath where the upper level wind patterns (500 mb and above) are also favorable
for rising motion, i.e., just downstream of upper level troughs where upper
level divergence occurs.
Relationship between rising motion, surface convergene, and upper level divergence
You should now realize the following:
My best attempt at drawing a 3-D representation of a mid-latitude winter weather pattern is given below.
|
![]()
![]()
![]()
![]()