Wednesday Sept. 26, 2012
click here to
download today's notes in a more printer friendly format
After listening to an initial song, "Gitanos
Californeros" from Fishtank Ensemble, a decision was made to not
play a second song ("Tchavo" from the
same group).
The Experiment #1 reports have all been graded and were returned
in class today. You now have two weeks to revise your report if
you want to (you don't have to). You only need to change sections
were you want to earn additional credit. Please return the
original report with your revised report. The revised reports are
due on or before Wed., Oct. 10.
A second Optional
Assignment on Upper Level Charts is now available. If you
make an honest effort to answer all the questions and have the
assignment done before coming to class you can earn extra credit.
If you answer at least 85% of the questions correctly you'll earn extra
credit and a "Green Card." The assignment is due next Wednesday,
Oct. 3.
Up to this point we've been learning about surface weather
maps. Maps
showing conditions at various altitudes above the ground are also
drawn.
Upper level conditions can affect the development and movement of
surface
features (and vice versa). We covered some of the basic concepts
at the start of the period today. Some additional
supplementary information is available online.
This
supplementary
reading
provides
all
the background information you'll need to be able to
answers the questions on the new optional assignment mentioned above.l
Here we'll mostly
just learn 3 basic facts about upper level
charts.
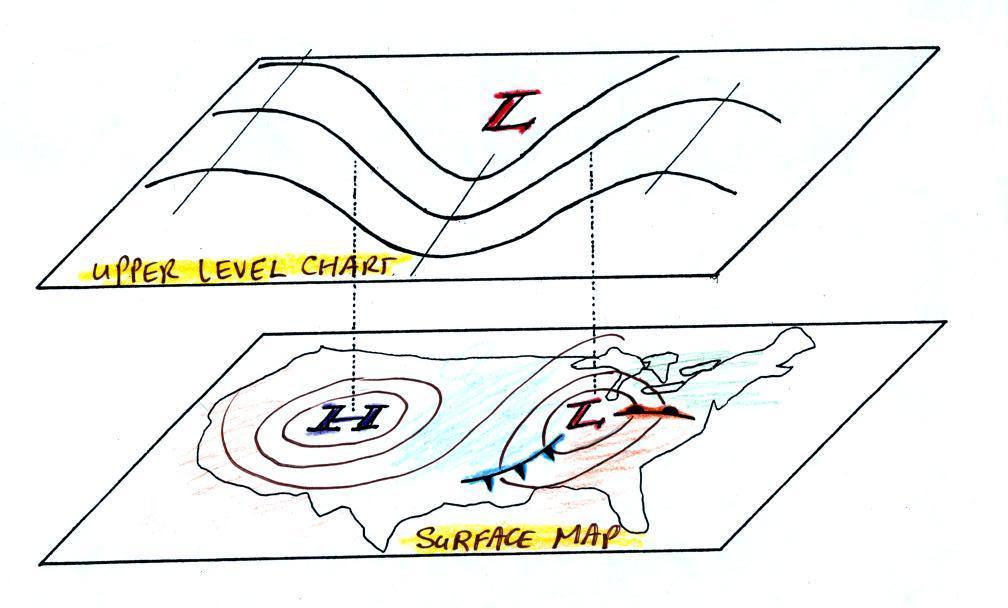
First the overall appearance is somewhat different from a surface
weather
map. The pattern on a surface map can be complex and you
generally find circular (more or less)
centers
of high and low pressure (see the bottom portion of the figure
below). You can also find closed high and low
pressure
centers at upper levels, but mostly you find a relatively simple wavy
pattern like is shown on the upper portion of the figure below (sort of
a 3-dimensional view). You'll find this basic picture on p. 41 in
the ClassNotes.
A simple upper level
chart pattern is sketched below (a map view). There are two basic
features:
wavy lines that dip southward and have a "u-shape" and lines that bend
northward and have an "n-shape".
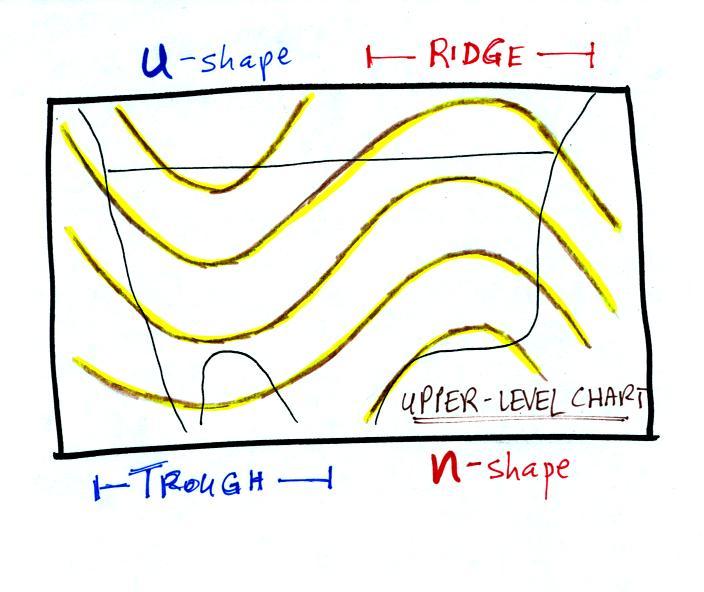
The u-shaped
portion of the pattern is called a trough. The n-shaped portion
is called
a ridge.
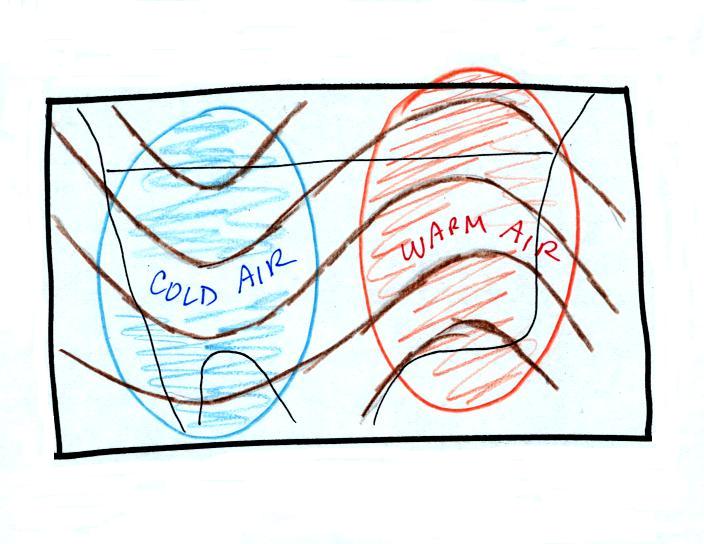
Troughs
are
produced
by
large
volumes
of
cool
or
cold
air
(the
cold
air
is
found
between
the
ground
and
the
upper
level
that
the
map
depicts).
The western half of the country in the map above would
probably
be experiencing colder than average temperatures. Large volumes
of warm
or hot air produce ridges. You can find out why this is true by
reading "Upper
level charts pt. 2".
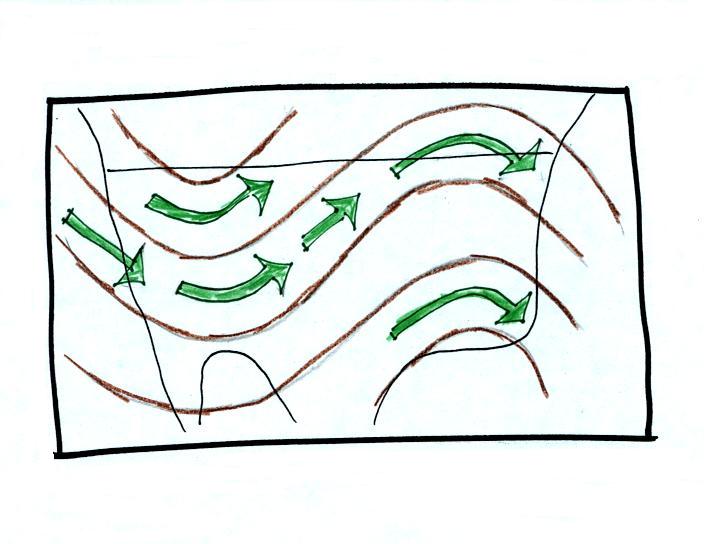
The
winds on upper level charts blow parallel to the contour lines
generally from west to east. This is a little different from
surface winds which blow across the isobars toward low pressure.
An example of surface winds is shown below.
That's it for this first
section. Really all you need to be able to do is
1. identify troughs and ridges,
2. remember that troughs are associated with cold air & ridges with
warm air, and
3. remember that upper level winds blow parallel to the contour lines
from west to east.
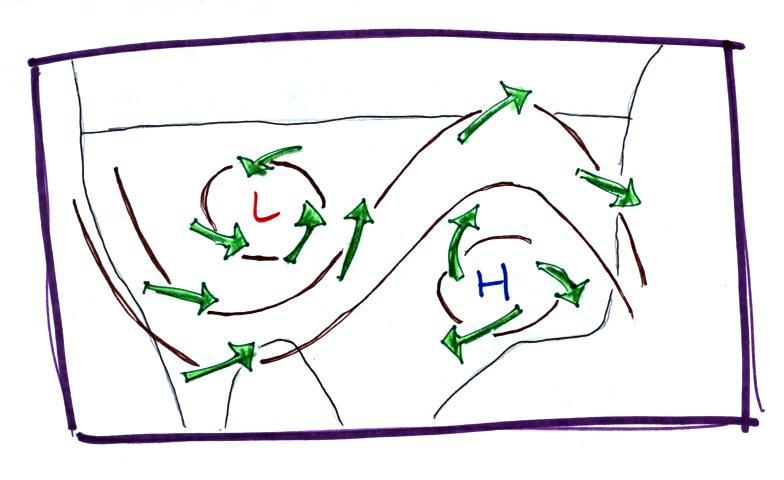
Here's the earlier picture again overlaying surface and
upper-level maps.
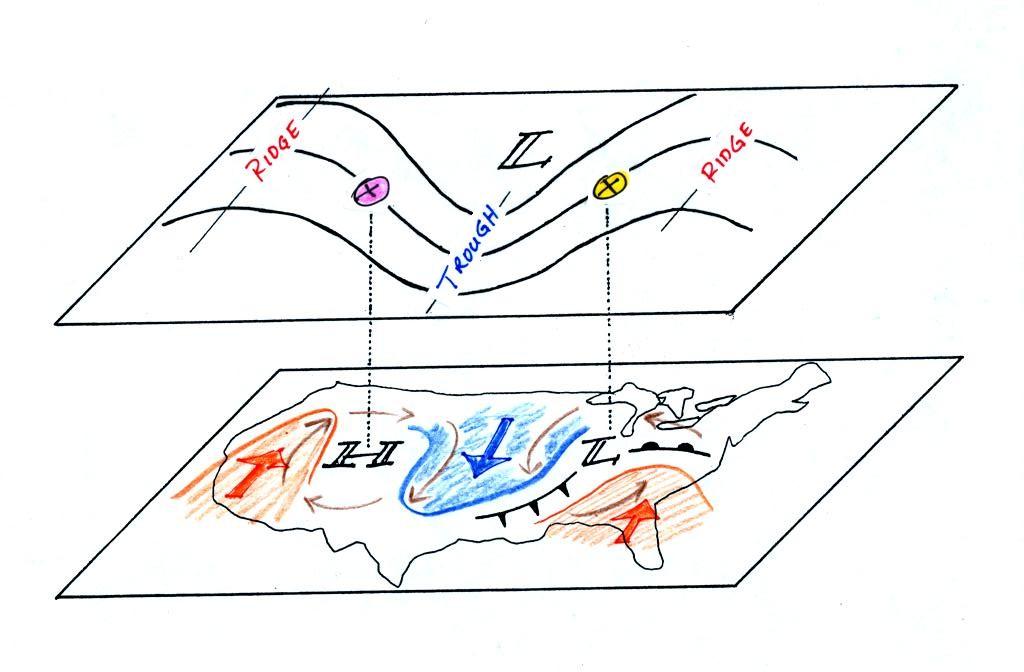
On
the surface map above you see centers of HIGH and LOW pressure.
The
surface low
pressure center, together with the cold and warm fronts, is a middle
latitude
storm.
Note how the counterclockwise winds spinning around the LOW move warm
air
northward (behind the warm front on the eastern side of the LOW) and
cold air
southward (behind the cold front on the western side of the LOW).
Clockwise winds spinning around the HIGH also move warm and cold
air. The
surface winds are shown with thin brown arrows on the surface map.
Note the ridge and trough features on the upper level chart. We
learned
that warm air is found below an upper level ridge. Now you can
begin to
see where this warm air comes from. Warm air is found west of the
HIGH
and to the east of the LOW. This is where the two ridges on
the
upper level chart are also found. You expect to find cold air
below an
upper level trough. This cold air is being moved into the middle
of the
US by the northerly winds that are found between the HIGH and the
LOW.
Note the yellow X marked on the upper level chart directly above the
surface
LOW. This is a good location for a surface LOW to form, develop,
and
strengthen (strengthening means the pressure in the surface low will
get even
lower than it is now. This is also called "deepening"). The
reason for this is that the yellow X
is a
location where there is often upper level divergence. Similary
the pink X
is where you often find upper level convergence. This could cause
the
pressure in the center of the surface high pressure to get even
higher. You can read more about this in Upper level charts pt. 3.
The upper level winds could also cause the surface storm to weaken
(the low pressure would get higher).
.
The following
picture wasn't shown in class on Wednesday.
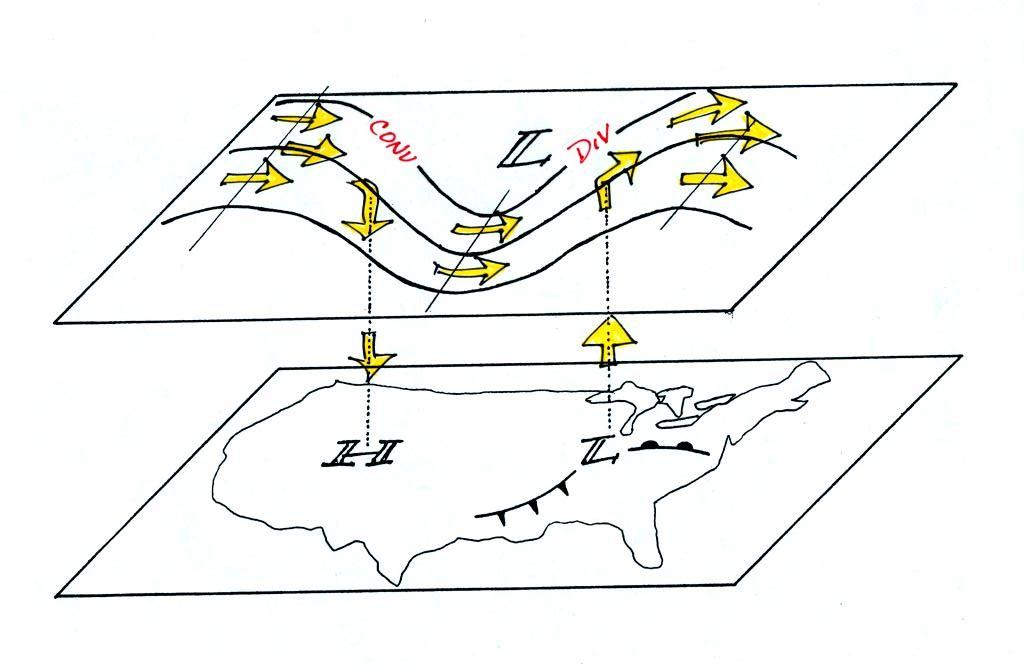
One of the things we have learned about surface LOW
pressure is that
the
converging surface winds create rising air motions. The figure
above
gives you an idea of what can happen to this rising air (it has to go
somewhere). Note the two
arrows of
air coming into the point "DIV" and three arrows of air leaving (more
air going out than coming in), this is upper level divergence).
The
rising
air can, in effect, supply the extra arrow's worth of air.
Three arrows of air come into the point marked "CONV" on the upper
level chart and two leave (more air coming in than going out = upper
level convergence).
What
happens to the extra arrow? It sinks, it is the source of the
sinking air
found above surface high pressure.
OK we're done with weather maps for the time being. Though
if interesting weather appears imminent I'll try to mention it in class
(earlier in the week it looked like the remnants of Hurricane
Miriam might bring some rainy weather to Tucson this weekend, but that
no longer seems to be the case).
If we were using a textbook in this class we'd be moving into
Chapter 2! During the next couple of weeks we
will be concerned
with energy,
temperature, heat, energy transport, and
energy
balance between the earth, atmosphere, and space.
It is easy to
lose sight of the main concepts because there are so many
details. Most of the following figures are found on pps 43&44
in the photocopied
ClassNotes.
Types
of
energy
We will learn the names of several
different types or forms of
energy.
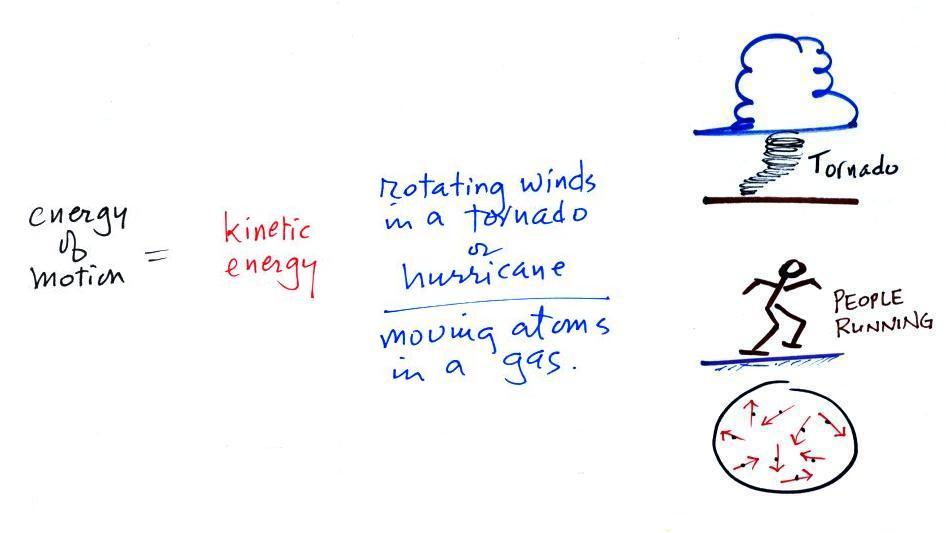
Kinetic energy is energy of motion. Some examples (both large
and microscopic scale) are mentioned
and sketched above. This is a relatively easy to visualize and
understand form of energy.
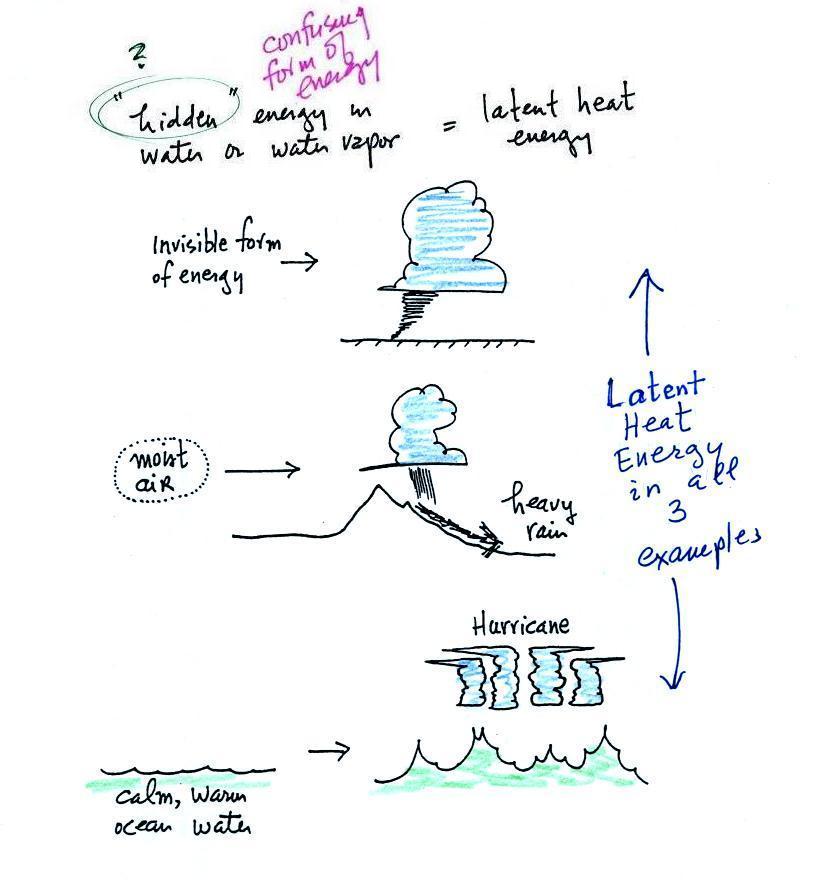
Latent heat energy is an underappreciated and
rather confusing type of energy. The word latent refers to energy that
is
hidden in water and water vapor. The hidden energy emerges when
water vapor condenses or water freezes (the energy had been added
earlier when ice was melted or water was evaporated). The fact
that the energy is hidden is part of what makes it confusing.
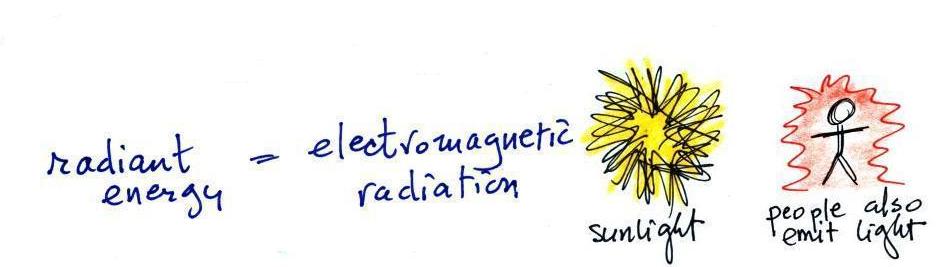
Radiant energy is a very important form of energy that was for
some
reason left off the original list in the ClassNotes. Sunlight is
an example of
radiant energy that we can see and feel (you feel warm when you stand
in sunlight). There are many types of radiant energy
that are invisible (such as the infrared light that people emit - something I didn't
mention in class).
Electromagnetic radiation is another name for
radiant energy.
Energy
transport
Four energy transport
processes are listed below.
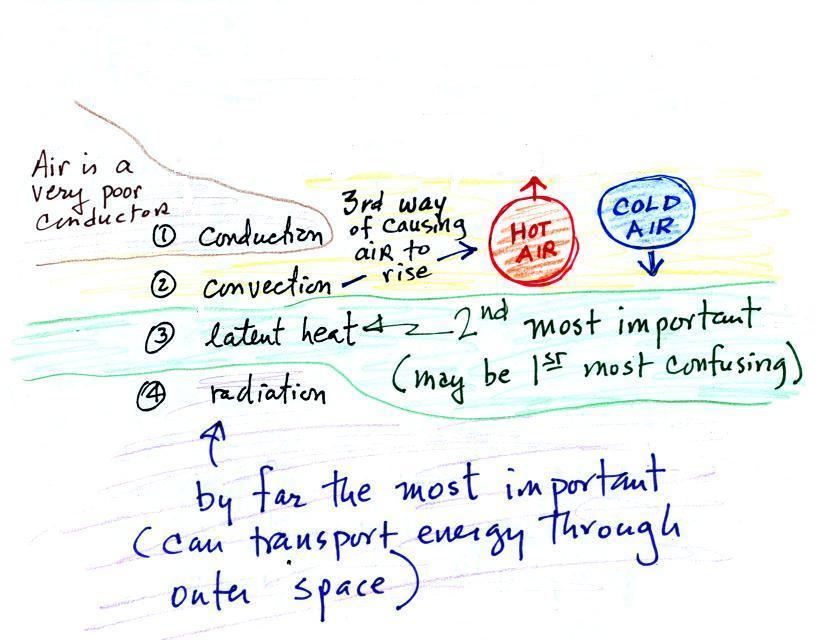
By far the
most important process is at the bottom of the list above. Energy
transport in the form of
electromagnetic radiation (sunlight is a common
form of electromagnetic radiation) is the
only process that can transport energy through empty space.
Electromagnetic radiation travels both to the earth (from the sun) and
away from the earth back into space. Electromagnetic radiation is
also
responsible for about 80% of the
energy transported between the ground and atmosphere.
You might be
surprised to learn that latent heat is the second most important
transport process.
Rising parcels of warm air and sinking parcels of cold air are
examples of free convection. Because of convection you feel
colder or
a cold windy day than on a cold calm day (the wind chill effect).
Ocean currents are also an example of convection.
Ocean currents
transport energy from the warm tropics to colder polar regions.
Convection is a 3rd way of causing rising air
motions in the atmosphere (convergence
into centers of low pressure and fronts are other 2 ways we've
encountered so far)
Conduction is the least important energy transport at least in the
atmosphere. Air is such a poor conductor of energy that it is
generally considered to be an insulator.
Energy
balance
and the
atmospheric greenhouse effect
The next picture
(the figure in the ClassNotes has been split into three
parts for improved clarity) shows energy being transported from the sun
to
the earth in the form of electromagnetic radiation.
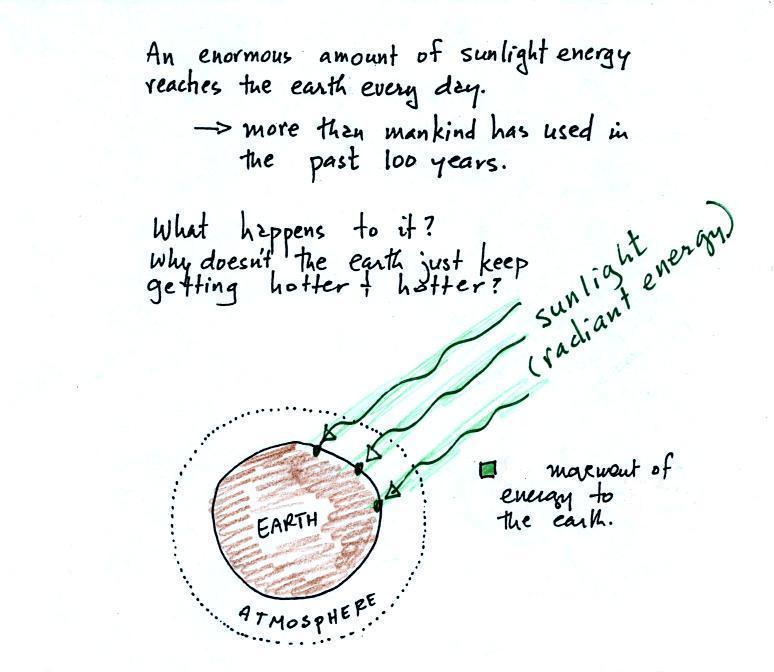
We are aware of this energy because
we can see it (sunlight
also contains invisible forms of light) and feel it. With all of
this energy arriving at and
being
absorbed by the earth, what keeps the earth from getting hotter and
hotter? If you park your car in the sun it will heat up.
But there is a limit to how hot it will get. Why is that?
It might be helpful when talking about energy balance to think of a
bank account. If you periodically deposit money into your account
why doesn't the balance just grow without limit. The answer is
that you also take money out of the account and spend it. The
same is true of energy and the earth. The earth absorbs incoming
sunlight energy but also emits energy back into
space (the orange and pink arrows in the figure below). Energy is
being emitted by both the surface of the earth and the atmosphere.
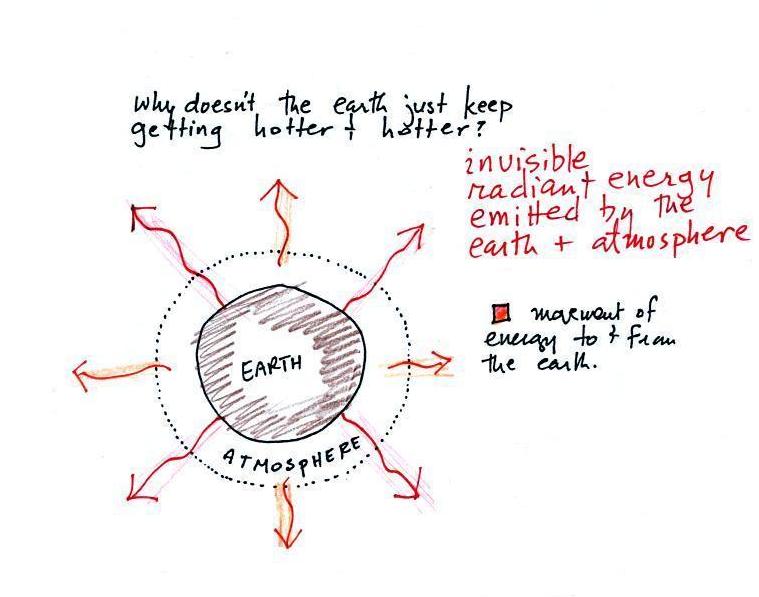
Energy is emitted in the form of
infrared light is an
invisible form of energy (it is weak enough that we
don't usually feel it either). A balance
between incoming and outgoing energy is achieved and the earth's annual
average temperature remains constant.
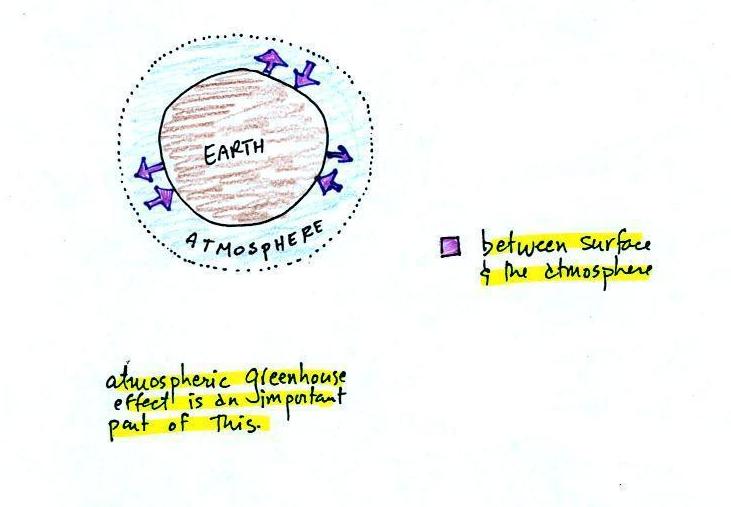
We will also look closely at energy transport between the earth's
surface and the atmosphere (see the figure below). This is where latent
heat energy transport,
convection and conduction operate (they can't transport energy beyond
the atmosphere and into outer space).
That
is
also
where
the
atmospheric
greenhouse
functions.
That will be a important goal -
to
better understand how the atmospheric greenhouse effect works.
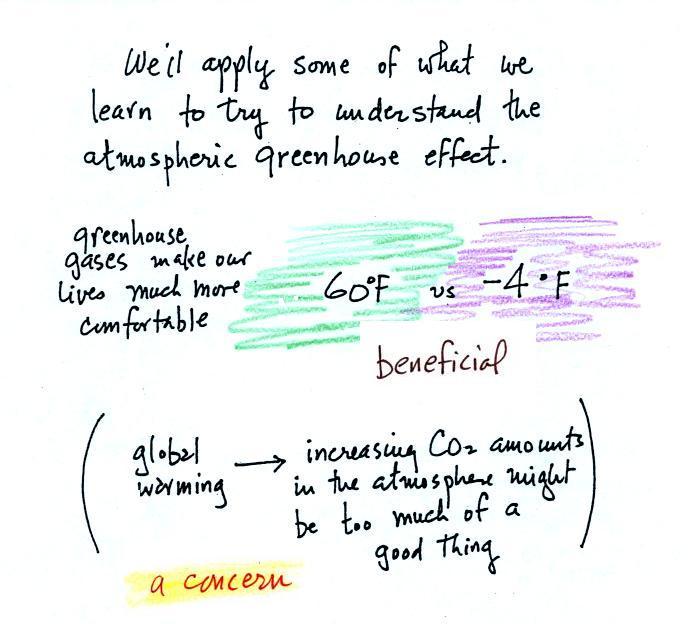
The detrimental side is that atmospheric greenhouse gas concentrations
are increasing (no real debate about that). This might enhance or
strengthen the greenhouse
effect and
cause the earth to warm (some debate here particularly about how
much warmer there might be). While that doesn't necessarily
sound bad
it could have many unpleasant side effects (lots of debate and
uncertainty about this also). That's a subject
we'll explore briefly later in the semester.
That's about all we had time for. Though on Friday I want to
do an experiment in class. Actually I want a couple of groups of
students (two groups of two students would be ideal) to do the
experiment. You'll be able to write a report about the experiment
and use the data you collect to satisfy the Experiment Report part of
the Writing Requirements. I.e. you won't have to worry about
checking out materials and doing Expt. #1, #2, or #3.
Someone has already volunteered. So I'll need three more
people on Friday.