 |
 |
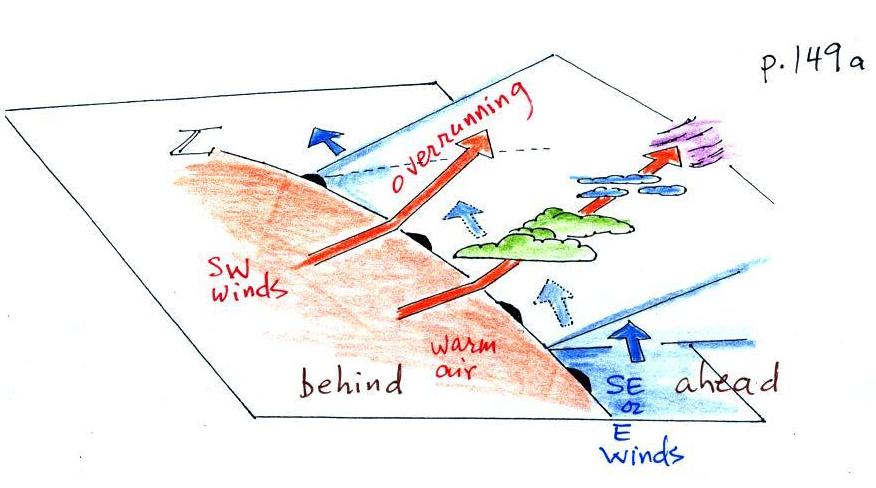
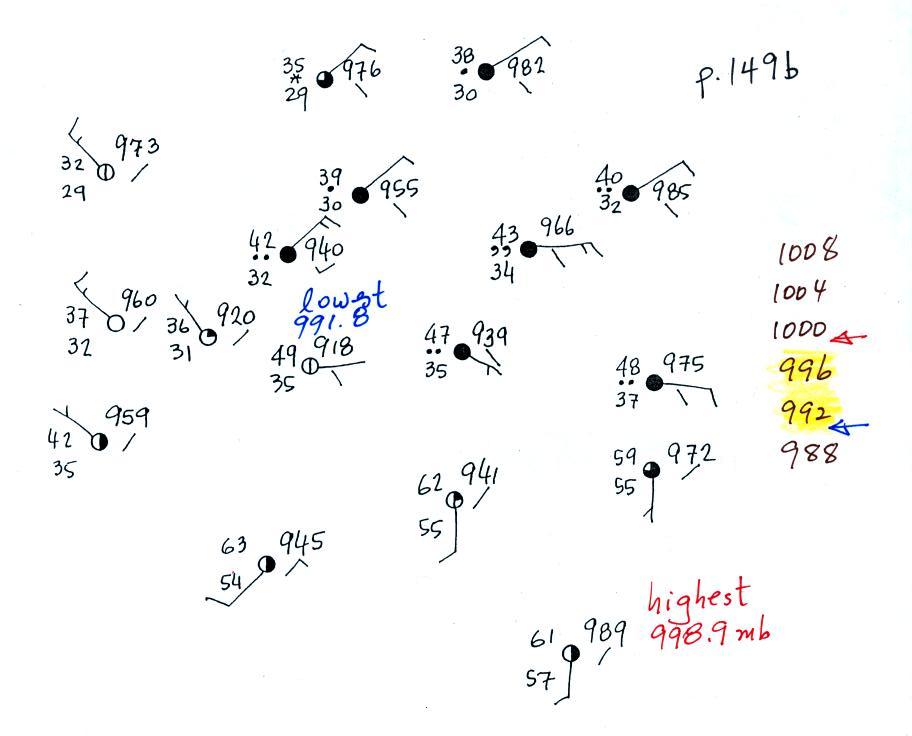
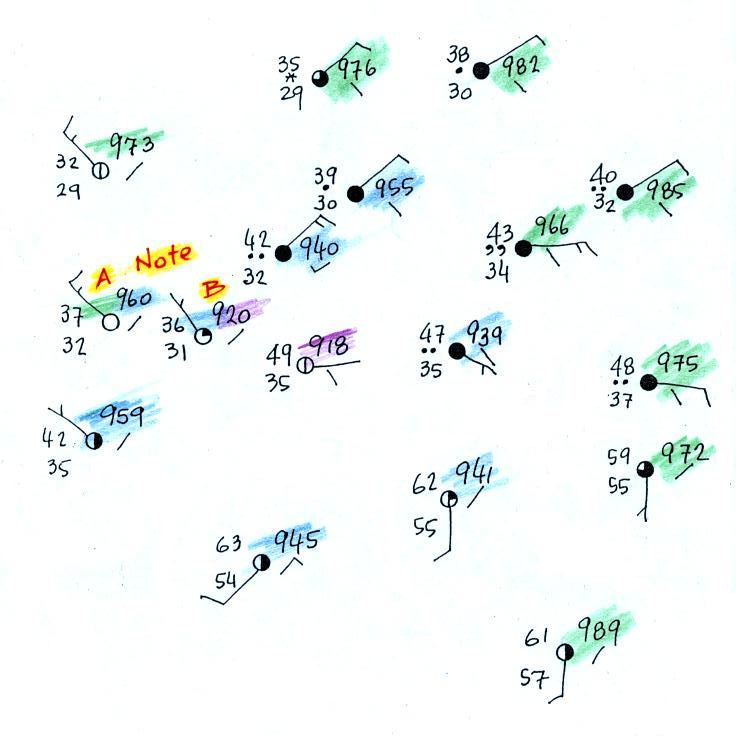
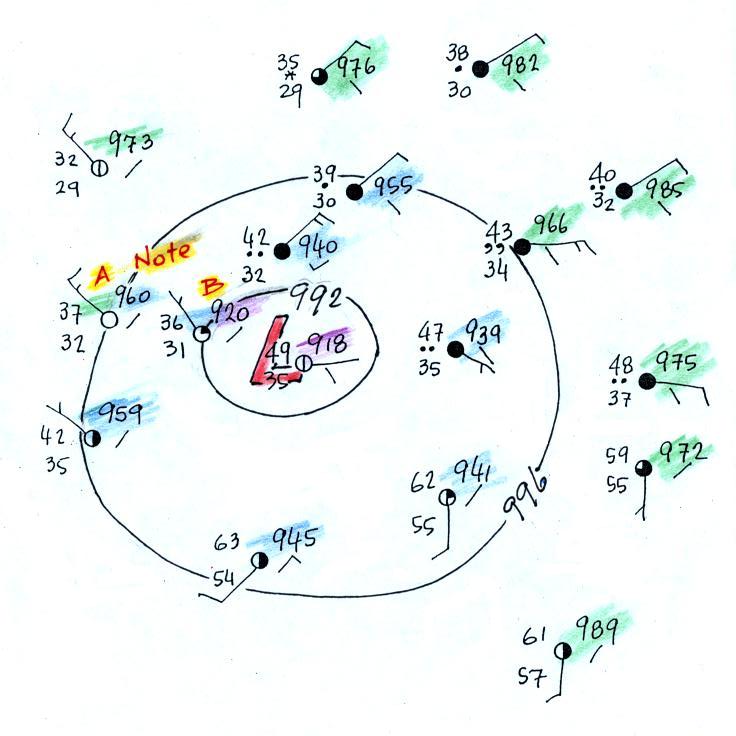
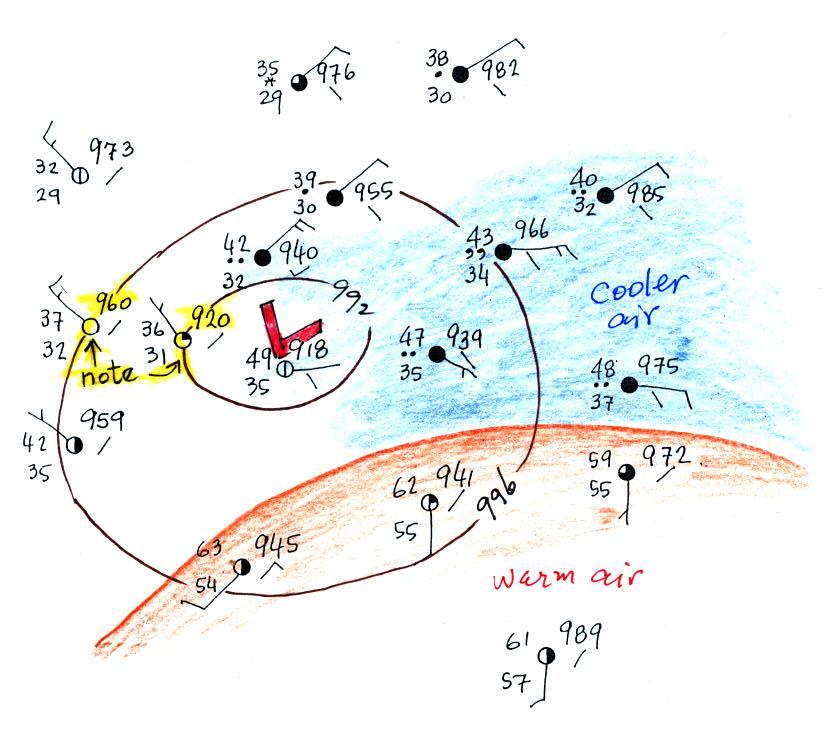
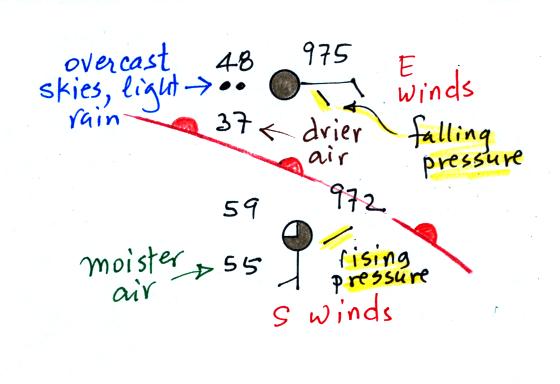
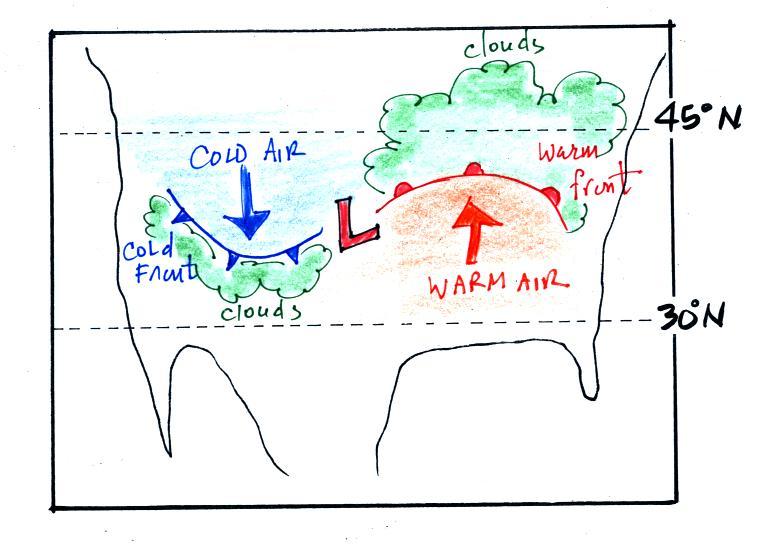
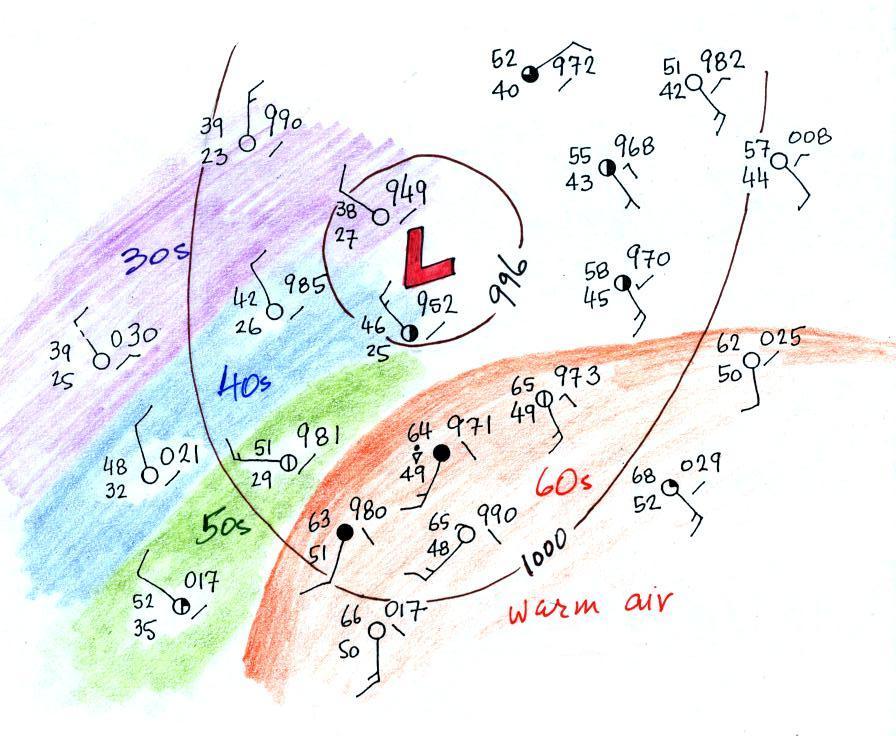
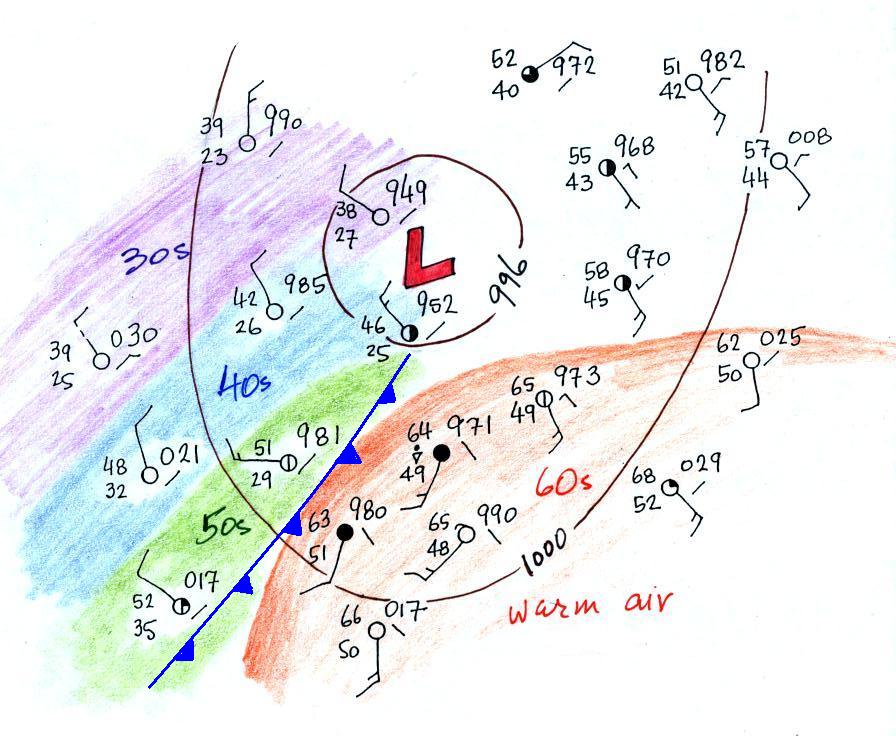
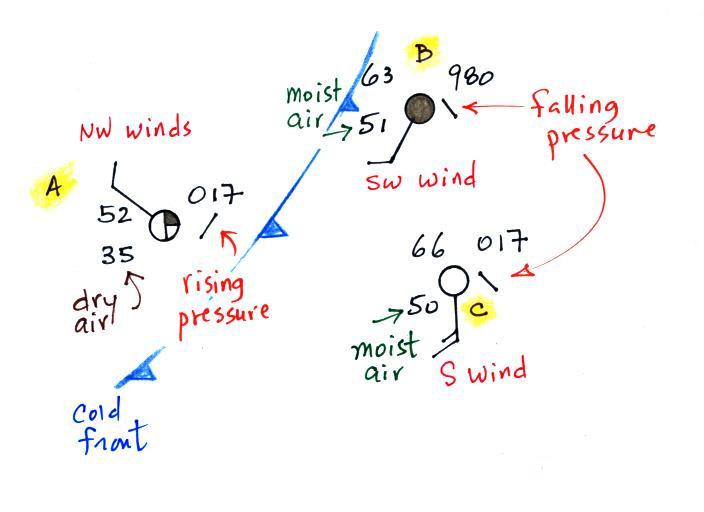
| Weather
Variable |
Behind
(after) |
Passing |
Ahead
(before) |
| Temperature |
warmer |
cool |
|
| Dew point |
may be moister |
drier |
|
| Winds |
SW, S, SE |
from the East or SE |
|
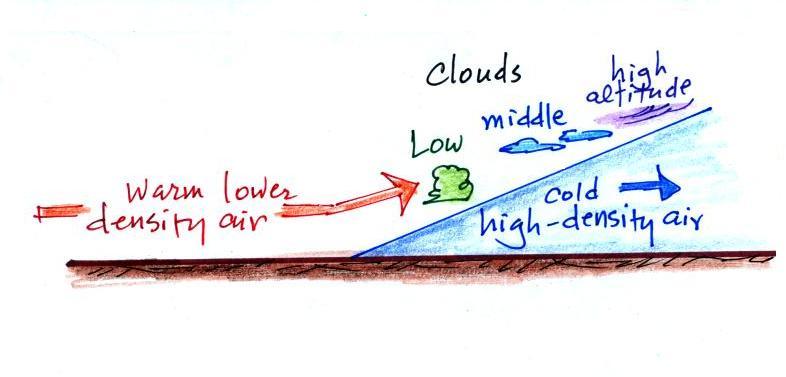
| Clouds, Weather |
clearing |
wide variety of clouds that
may precede arrival of the front by a day or two clouds may produce a wide variety of types of precipitation also (snow, sleet, freezing rain, and rain) |
|
| Pressure |
rising |
minimum |
falling |