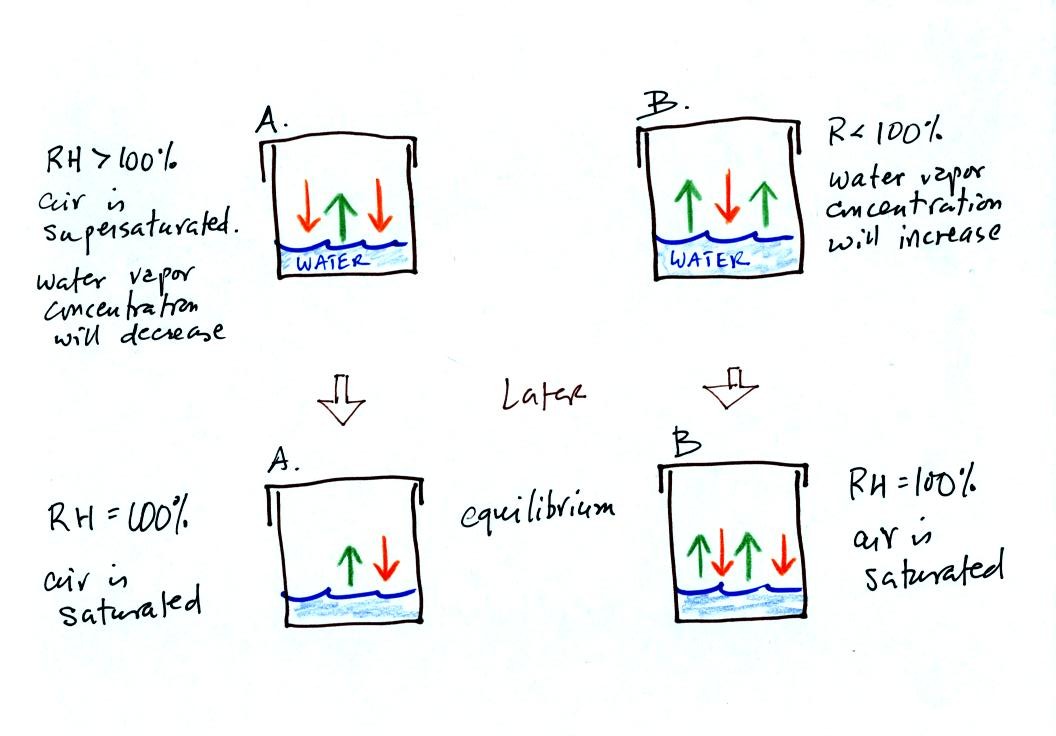
Because of the unequal rates of evaporation and condensation,
neither of the glasses in the top part of the figure are in
equilibrium. The two arrows of condensation in Figure A at top
tell you there is more water vapor in the air in Figure A than in Fig.
B where there is just one arrow of condensation. The two arrows
of evaporation in Fig. B at top tell you the water there is warmer than
in Fig. A.
The amounts of water vapor in the two glasses at the top of the figure
will change with time and move toward equilibrium. The
equilibrium situations are shown at the bottom of the figure. The
air in Fig. A at the bottom of the figure contains less water vapor
than the air in Fig. B. The air and water in Fig. A at the bottom
of the picture are colder than the air and water in Fig. B..