![]()
![]()
![]()
![]()
The wind at 500 mb can be determined from the height pattern. The wind blows parallel to the height contours with lower heights to the left of the wind direction. During the winter months across the United States, this means that the 500 mb winds across generally blow from west toward east, but follow the wavy pattern of the height contours. This is because the air temperature generally gets colder as one moves toward the north and 500 mb heights generally get lower. This general west to east air motion at the 500 mb height level weakens in the summer as the temperature differences between the tropics and the Arctic becomes weaker. Keep in mind that this is the wind several thousand meters above the Earth's surface and not the wind that would be felt on the ground.
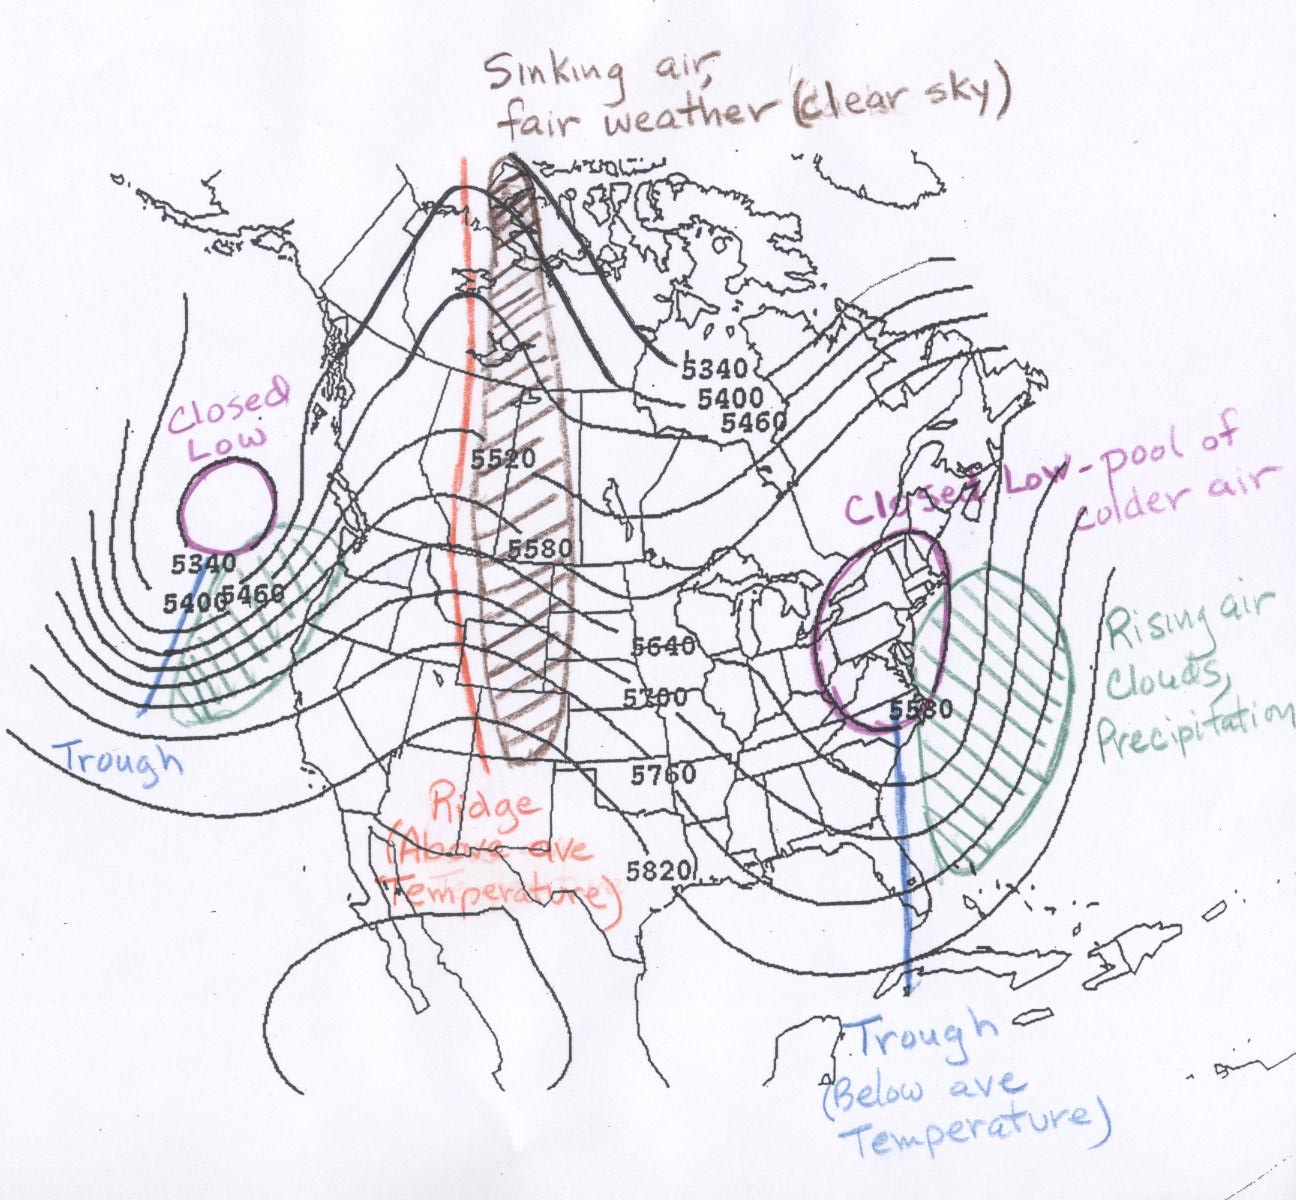
The wind direction at 500 mb can also help you to understand the relationship between troughs and cold temperatures and ridges and warm temperatures. Winds entering a trough have a component from the north, often bringing colder air from the north toward the south. Winds entering a ridge have a component of the wind from the south, often bring warmer air from the south.
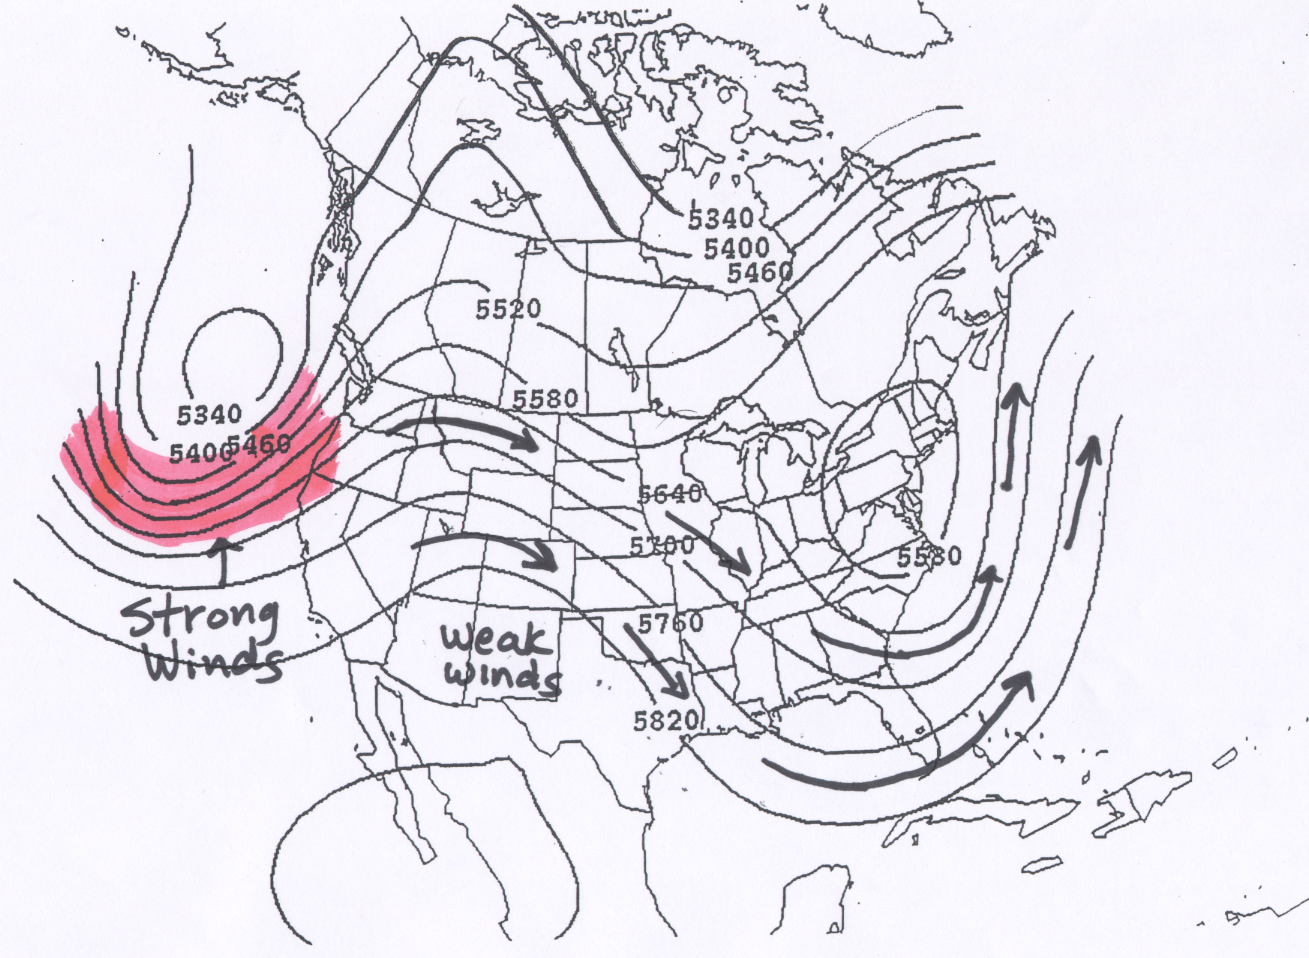
The wind speed is faster where the height lines are closer together, and slower where the height contours are spaced further apart. If this helps, you can think of the 500 mb height lines as channels through which the air moves. The wind follows the wavy pattern of the lines, and gets squeezed together where the lines get closer together, resulting in faster winds. This is just how water would flow in a hypothetical channel. A couple of examples are include below.
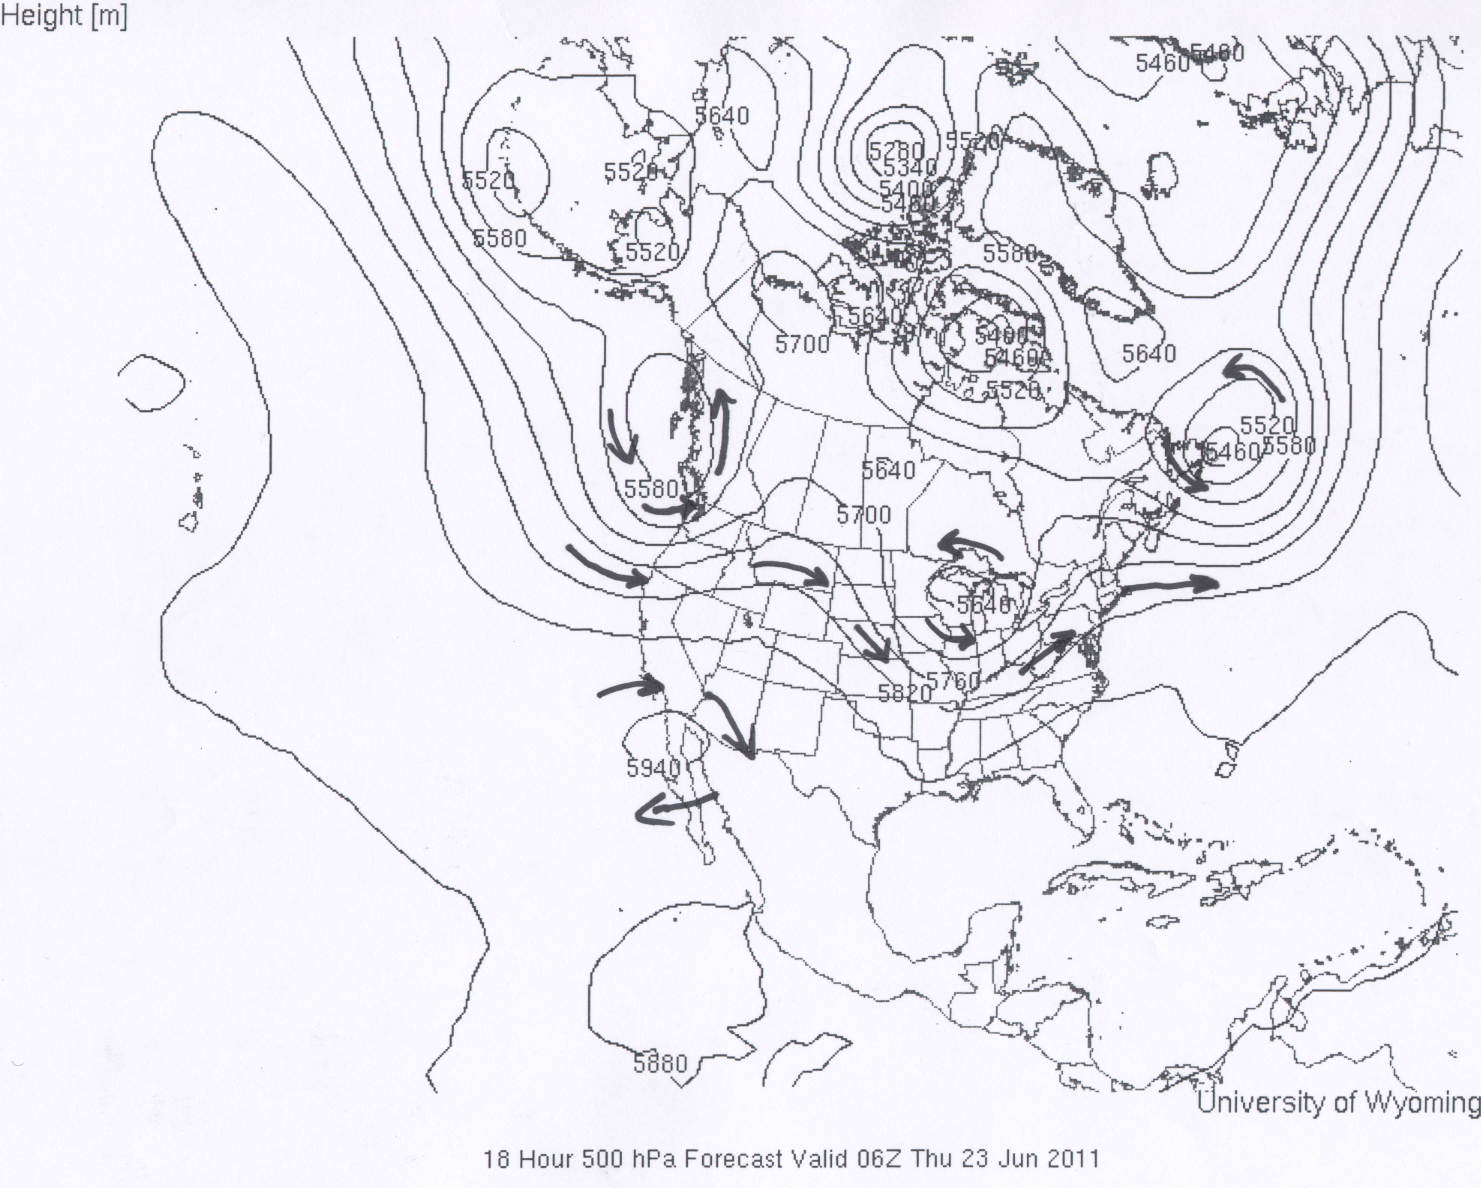
In the first example for 500 mb winds the lines with arrows represent the trajectory of the air flow at various places within the 500 mb height pattern. Regions of strong and weak wind speeds based on the spacing of the height contours are marked on the map. In the second example for 500 mb winds arrows are again used to mark wind trajectories. It is also emphasized that the flow around closed highs is clockwise and the flow around closed lows is counterclockwise. A final example is the 500 mb map for 00Z October 8, 2011 that we examined on the previous page. The wind barb symbols show the 500 mb windspeed and wind direction at various locations on the map. You should understand the general 500 mb winds shown in relation to the 500 mb height contour pattern.
The 500 mb winds can have a large influence on the motion of smaller-scale weather features, such as the movement of surface low pressure areas, the movement of hurricanes, and the movement of individual thunderstorm cells. In this context, smaller-scale means small compared to the size of the larger scale trough and ridge pattern. In previous lectures I referred to the 500 mb winds as the "steering level winds" for this reason.
Clouds and precipitation are most likely to be occurring just downwind (or downstream) from the location of 500 mb troughs. Following the 500 mb wind flow, this is the region just after the wind has gone through the trough and starts heading toward the next ridge. Click here to see Example map The reason for this is that rising air motion is forced in this part of the flow pattern. Rising motion means that surface air is forced to move upward toward the tropopause. Clouds and precipitation will develop where air rises (as long as there is sufficient water vapor). Conversely, sinking air motion is forced over areas downstream of ridges. Clouds do not develop where air is sinking. Fair weather is most likely in these areas. By looking at the height patterns on a 500 mb map, you should be able to distinguish where clouds and precipitation are most likely and where fair weather is most likely.
This is somewhat simplistic and will not always give you all the details of where it is and is not raining. Since this is not strictly a weather class, we do not have time to cover details. The use of 500 mb maps allows you to make a quick (and often decent) assessment of the large-scale temperature and precipitation patterns.
![]()
![]()
![]()
![]()