Thursday Sept. 15, 2011
click here to
download today's notes in a more printer friendly format
A few songs from a local group, Calexico (joined in some of the
songs by Mariachi Luz de Luna, also from Tucson, and Francois Breut
a French singer), in honor of Mexican
Independence Day tomorrow Sept. 16. You heard "Quattro (World
Drifts In)", "Ballad
of
Cable
Hogue" and "Si Tu Disais".
Here's
another
that I didn't have time to play in class"Alone Again Or".
The Quiz #1 Study Guide is now
online. There are 4 reviews scheduled for early next week.
See the study guide for times and locations.
I'll return the In-class Optional Assignment next Tuesday.
Answers to the questions might appear online before then.
Today we'll be learning why warm air rises
and
cold air sinks (the figure below can be found on p. 49 in the
ClassNotes)
Hot air balloons rise (they also
sink), so does the relatively
warm air in a thunderstorm (it's warmer than the air around
it). Conversely cold air sinks. The surface winds
caused by a thunderstorm downdraft (as shown above) can reach speeds of
100 MPH and are a serious weather hazard.
A full understanding of these rising and sinking motions is
a
3-step process (the following is
from the bottom part of p. 49 in the photocopied ClassNotes)
We will first learn about the ideal
gas law. That is an equation that tells you which properties of
the air
inside a
balloon work to determine the air's pressure. Then we will look
at Charles' Law, a special situation involving the ideal gas law (air
temperature and density change together in a way that keeps the
pressure
inside a balloon constant).
Then we'll learn about the
vertical forces that act on air (an upward
and a downward force).
Students working on Experiment #1 will need to understand the
ideal gas law to be able to explain why/how their experiment works.
The figure above makes an important point: the air molecules in a
balloon "filled with air" really take up very little space. A
balloon filled with air is mostly empty space. It is the
collisions of air molecules traveling at 100s of miles per hour with
the inside walls of the balloon
that keep it inflated.

Up to this
point in the semester we
have been thinking of pressure as
being determined
by the weight of the air overhead. Air pressure pushes down
against the ground at sea level with 14.7 pounds of force per square
inch. If you imagine the weight of the atmosphere pushing down on
a balloon sitting on the ground you realize that the air in the balloon
pushes back with the same force. Air everywhere in the atmosphere
pushes upwards, downwards, and sideways.
The ideal gas law
equation is another way of thinking about air pressure, sort of a
microscopic scale version. We ignore
the atmosphere and concentrate on just the air inside the
balloon. Pressure (P)
will be on the left hand side of the equation. Relevant
properties of the air
inside the
balloon will be found on the right hand side.

In A
the pressure produced by
the air
molecules inside a balloon will
first depend on how many air molecules are there, N. If there
weren't any air molecules at all there wouldn't be any
pressure. As you add more and more add to something like a
bicycle tire, the
pressure increases. Pressure is directly proportional to N; an
increase in N causes an increase in P. If N doubles, P also
doubles (as long as the other variables in the equation don't change).
In B
air pressure inside a balloon
also
depends on the size of the
balloon. Pressure is inversely proportional to volume, V
. If V were to double, P would drop to 1/2 its original value.
Note
it
is possible to keep pressure constant by changing N and V
together in just the right kind of way. This is what happens in
Experiment #1 that some students are working on. Here's a little
more detailed look at that experiment that wasn't shown in
class.
An air sample is trapped together with some steel wool inside a
graduated cylinder. The cylinder is turned upside down and the
open end is stuck into a glass of water. This is shown at left
above. Water will move into or out of the cylinder to keep Pout
equal to Pin.
Oxygen in the cylinder reacts with steel wool to form rust.
Oxygen is
removed from the air sample which causes N (the total number of air
molecules) to decrease. Removal of oxygen would ordinarily cause
a drop in Pin.
But,
as
oxygen
is
removed, water rises up into the cylinder decreasing the air sample
volume. N and V both decrease in the same relative amounts and
the air sample pressure remains constant.
If you were to remove 20% of the air molecules, V would decrease
to 20% of its original value and pressure would stay constant.

Part C: Increasing
the temperature of the gas in a balloon will cause the gas molecules to
move more quickly. They'll collide with the walls of the balloon
more frequently and rebound with greater force. Both will
increase the pressure. You shouldn't throw a can of spray paint
into a fire because the temperature will cause the pressure inside the
can to increase and the can could explode.
Surprisingly, as explained in Part
D,
the pressure
does
not depend on the mass of the
molecules. Pressure doesn't depend on the composition of the
gas. Gas molecules with a lot of mass will move slowly, the less
massive molecules will move more quickly. They both will collide
with the walls of the container with the same force.
The figure below (which replaces the bottom of p. 51 in the
photocopied
ClassNotes) shows two forms of the ideal gas law. The top
equation is the one we just derived and the bottom is a second slightly
different version. You can
ignore the
constants k and R if you are just trying to understand how a change in
one of the variables would affect the pressure. You only need the
constants when you are doing a calculation involving numbers (which we
won't be doing).
Charles' Law is a special case involving the ideal gas law.
Charles Law is a situation where the pressure in a volume of air
remains
constant. T, V, and density can change but they must do so in a
way that keeps P constant. This is what happens in the
atmosphere. A volume of air is free to expand or shrink. It
does so to keep the pressure inside the air volume constant (the
pressure inside the volume is staying equal to the pressure of the air
outside the volume).
Read through the explanation on p.
52 in the photocopied
Classnotes. In the atmosphere a parcel (balloon) of air will
always try to keep its pressure the same as the pressure of the
surrounding air. If they aren't equal the parcel will either
expand or shrink until they are again equal.
If you warm air it will expand and density will decrease until the
pressure inside and outside the parcel are equal.
If you cool air the parcel will shrink and the density will
increase
until the pressures balance.
These two associations:
(i)
warm air = low
density air
(ii) cold air = high density air
are important and will come up a
lot during the remainder of the
semester.
Click here
if you
would like a little
more detailed, more step-by-step,
explanation of Charles Law.
Here's a visual summary
of Charles' Law
As you warm a parcel of air the
volume will increase and the density will decrease. Pressure
inside the parcel will remain constant. If you cool the parcel of
air
it's volume decreases and its density increases. Pressure inside
the parcel remains constant.
Charles
Law can be demonstrated by dipping a balloon in
liquid
nitrogen. You'll find an explanation on the top of p. 54 in the
photocopied ClassNotes.
The balloon had shrunk down to
practically zero volume when
pulled from the liquid nitrogen. It was filled with cold high
density air. As
the balloon warmed the balloon expanded and the density of the air
inside
the balloon decreased. The volume and temperature kept changing
in a way that kept pressure constant. Eventually the balloon ends
up back at room temperature (unless it pops while warming up).
And finally the last step toward understanding why warm air rises
and cold air sinks. We'll have a look at the forces that act on
parcels of air in the atmosphere. This information is
found on p. 53
in the photocopied
ClassNotes.

Basically it comes down to this - there are two forces
acting on a parcel* of air in
the atmosphere:
First is gravity, it pulls downward. The strength of the gravity
force
(the weight of the air in the parcel) depends
on the mass of the air inside
the parcel.
Second there is an upward pointing pressure difference force.
This
force is
caused by the air outside
(surrounding) the parcel. Pressure decreases with increasing
altitude. The pressure of the air at the bottom of a parcel
pushing upward is slightly stronger than the pressure of the air at the
top of the balloon that is pushing downward. The overall effect
is an upward pointing force.
When the air inside a parcel is exactly the same as the air
outside,
the two forces are equal in strength and cancel out. The parcel
is
neutrally bouyant and it wouldn't rise or sink, it would just sit in
place.
If you replace the air inside the balloon with warm low density
air, it
won't weigh as much. The gravity force is weaker. The
upward
pressure difference force doesn't change (because it is determined by
the air outside the balloon which hasn't changed) and ends up stronger
than the
gravity force. The balloon will rise.
Conversely if the air inside is cold high density air, it weighs
more. Gravity is stronger than the upward pressure difference
force and the balloon sinks.
* the
word
parcel
just
means
a
small volume of air.
We did a short demonstration to show how density can
determine
whether an object or a parcel of air will rise or sink. We used
balloons filled with helium (see bottom of p. 54 in
the photocopied Class
Notes). Helium is less dense than air even when it has the same
temperature as the surrounding air. A
helium-filled balloon doesn't need to warmed up in order to rise.

We dunked the helium-filled balloon
in some liquid nitrogen to cool
it
and to cause the density of the helium to increase. When
removed
from the liquid nitrogen the balloon didn't rise, the gas inside was
denser than the surrounding air (the purple and blue balloons in the
figure above). As the balloon warms and expands
its density decreases. The balloon at some point has the same
density as the air around it (green above) and is neutrally
bouyant. Eventually the balloon becomes less dense that the
surrounding air (yellow) and floats up to the ceiling (which in ILC 150
is about 30 feet high)
Something like this happens in the
atmosphere.

We spent the last part of today's class starting a new topic -
Surface Weather Maps. We began by learning how
weather data are
entered onto surface weather maps.
Much of our weather is produced by relatively large
(synoptic scale)
weather systems - systems that might cover several states or a
significant fraction of
the continental US. To be able to identify and characterize these
weather systems you must first collect weather data (temperature,
pressure, wind direction and speed, dew point, cloud cover, etc) from
stations across the country and plot the data on a map. The large
amount of data requires that the information be plotted in a clear and
compact way. The station model notation is what meterologists
use.

A small circle is plotted on the map at the location where
the
weather
measurements were made. The circle can be filled in to indicate
the amount of cloud cover. Positions are reserved above and below
the center circle for special symbols that represent different types of
high, middle,
and low altitude clouds. The air temperature and dew point
temperature are entered
to the upper left and lower left of the circle respectively. A
symbol indicating the current weather (if any) is plotted to the left
of the circle in between the temperature and the dew point; you can
choose from close to 100 different weather
symbols (on a handout distributed in class). The
pressure is plotted to the upper right of the circle and the pressure
change (that has occurred in the past 3 hours) is plotted to the right
of the circle.
We
worked through this material one step at a time (refer to p. 36 in
the photocopied ClassNotes). Some of the figures below were
borrowed from a previous semester or were redrawn and may differ
somewhat from what was drawn in class.
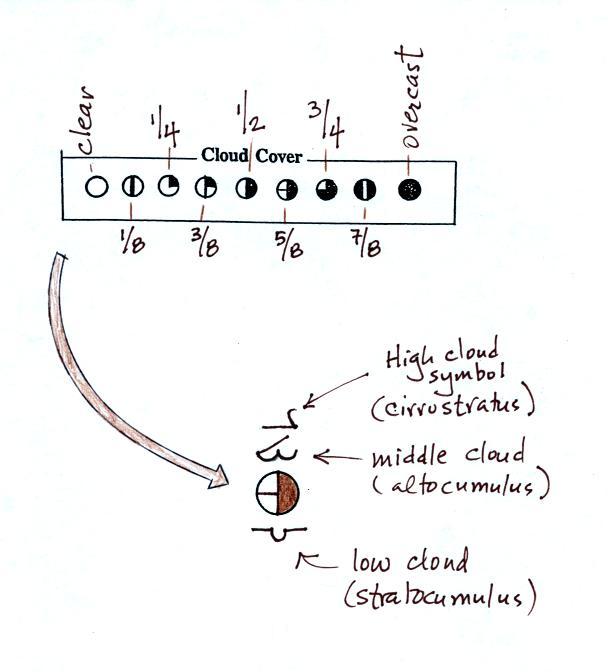
The center circle is filled in to indicate the portion
of
the sky
covered with clouds (estimated to the nearest 1/8th of the sky) using
the code at the top of the figure. 3/8ths of the sky is covered
with clouds in the example above.
Then symbols are
used
to
identify
the
actual types of high, middle, and low altitude clouds observed in the
sky. Later in the semester we will learn the names of the 10
basic cloud types. Six of them are sketched above and symbols for
them are shown. This figure wasn't shown in class.
A complete list of cloud symbols was on a handout distributed in class
(a copy can be found here
) You do not, of
course, need to remember all of the cloud symbols.
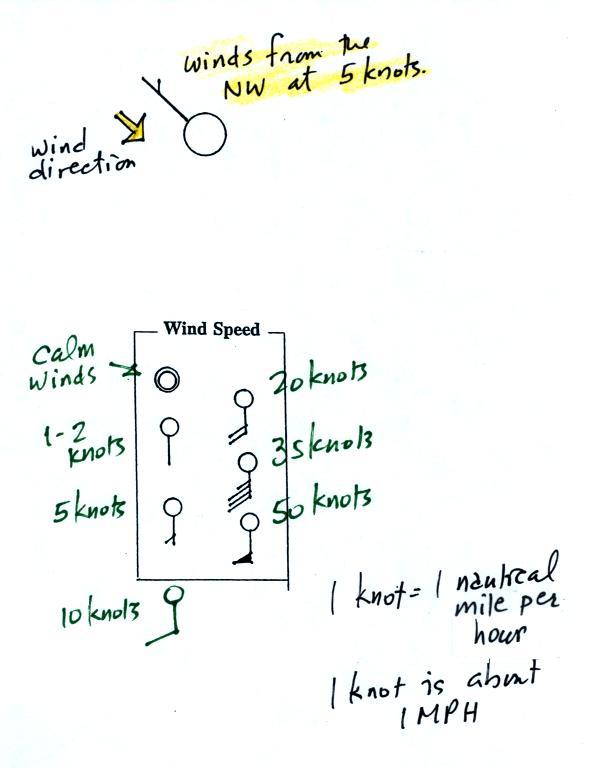
A straight line extending out from
the center circle
shows the wind direction. Meteorologists always give the
direction the wind is coming from.
In this example the winds are
blowing from the NW toward the SE at a speed of 5 knots. A
meteorologist would call
these northwesterly winds.
Small barbs at the end of the straight
line give the wind speed in knots. Each long barb is worth 10
knots, the short barb is 5 knots.
Knots are nautical miles per hour. One nautical mile per hour is
1.15 statute miles per hour. We won't worry about the distinction
in this class, we will just consider one knot to be the same as one
mile per hour.
Here are four more examples.
What is the wind direction and wind speed in each case. Click here for the answers.
The air temperature and the dew point temperature are probably the
easiest data to decode.
The air temperature in this example
was 64o
F
(this is
plotted above and to the left of the center circle). The dew
point
temperature was 39o F and is plotted below and to the left
of the center circle. The box at lower left reminds you that dew
points range from the mid 20s to the mid 40s during much of the year in
Tucson.
Dew
points rise into the upper 50s and 60s during the summer thunderstorm
season (dew points are in the 70s in many parts of the country in the
summer). Dew points are in the 20s, 10s, and may even drop below
0 during dry periods in Tucson (that has been the case here recently).
And last something I forgot to cover in class.
A symbol representing the weather
that is currently
occurring is plotted to the left of the center circle (in between the
temperature and the dew point). Some of
the common weather
symbols are
shown. There are about 100 different
weather symbols that you can choose
from (click here
if you didn't get a copy of the handout distributed in class today).
There's no way I could expect you to remember all of these weather
symbols.