Thursday Oct. 6, 2011
click here to
download today's notes in a more printer friendly format
Four songs from Xavier
Rudd before class ("G.B.A.", "Fortune Teller",
"Time to Smile",
and
"Better
People").
The Quiz #2 Study Guide is now
available online. Quiz #2 is one week from today, Thu., Oct. 13.
You'll find a link on the class home page that shows you how to estimate your grade
in this class.
The Bonus 1S1P Assignment dealing with surface weather map
analysis and the Upper Level Charts Optional Assignment were both
collected today. I'll get the Upper Level Charts assignment back
to you by next Tuesday for sure so that if you earned a Green Card
you'll be able to use it on the quiz.
Here's an interesting interactive
quiz from National Geographic Magazine that lists some human
survival limits. I showed some pictures at the start of class.
We're ready to tackle
electromagnetic radiation, the most
important of the four energy transport processes (it's the most
important because it can carry energy through empty space).
First we need to review a
couple of rules concerning static electricity
and learn something about electric
field
arrows.
The static electricity rules are found at the top of p. 59 in the
photocopied ClassNotes
Two electrical charges with the
same polarity push each other
apart. Opposite charges are attracted to each other.
Electric field arrows (or just the E field) show you the direction and
give you an idea of
the strength of the electrical force that would be exerted on a
positive charge
located at that point.

In this figure (p. 59 in the
ClassNotes) a positive charge has been placed at 3 locations around a
center charge. The electric field arrow shows the direction of
the force that would be exerted on each of the charges. The force
arrow is shown in blue.
The E field arrows tell you what will happen to a + charge. You can use the
arrows to determine what will happen to a - charge also.
For a negative charge the force will point in a direction opposite the
E field arrow.
I tried a short "static electricity" demonstration that
consisted
of blowing bubbles toward a Van de Graaff generator. The metal
ball at the top of the generator gets charged up with electricity (I'm
not sure what polarity it is but let's assume it is positive).
Some of that charge leaks off into
the air. I thought that this charge would stick to the bubbles
floating by. Then since the bubbles would have the same charge as
the generator, the bubbles would be pushed away from the
generator. What happened instead was that the bubbles seemed to
be attracted to the dome of the generator. After
doing a little research (after trying the demonstration in the MWF
section last Friday) I found that the people
blowing the bubbles and the dome of the Van de Graaff were oppositely
charged.
Trying the demonstration with the bubble blowing tool connected to the
Van de Graaff generator seemed to work better. But it still
wasn't
very impressive. Still after seeing my attempt at the
demonstration
you'd be able to appreciate better
this video showing how the demonstration is supposed to work.
Here's a figure to test your understanding of electric field
arrows. This
figure
wasn't shown in class.
The direction and strength of the E
field near the ground during fair weather and under a thunderstorm are
shown. Show the directions of the forces that would be exerted on
the charges shown in the figure. Click here when you think you
have the answer.
We're learning about E fields so that we can understand how
electromagnetic radiation can transport energy from one place to
another. You'll find most of the following on p. 60
in the photocopied ClassNotes. What follows is a little more
detailed explanation than was shown in class.
We imagine turning on a source of
EM radiation and then
a
very short time
later we take a snapshot. In that time the EM radiation has
traveled to the right (at the speed of light). The EM radiation
is a wavy pattern of
electric and magnetic field arrows. We'll ignore the magnetic
field lines. The E field lines sometimes point up, sometimes
down. The pattern of electric field arrows repeats itself.
Note the + charge near the right
side of the picture. At the time
this
picture was taken the EM radiation exerts a fairly strong upward force
on
the
+
charge (we use the E field arrow at the location of the + charge to determine the direction
and strength of the force exerted on the + charge).
Textbooks often represent EM
radiation with a wavy line like shown
above. They don't usually explain what the wavy line represents.
The wavy line just connects the
tips of a bunch of electric
field
arrows.

This picture was taken a short time
after the first snapshot aftere the radiation
had
traveled a little further to the right. The EM radiation now
exerts a somewhat weaker downward force on the + charge.
The +
charge is now being
pushed upward again. A
movie
of
the +
charge, rather than just a series of snapshots, would show the
charge
bobbing up and down much like a swimmer in the
ocean would do as waves passed by.
The wavy pattern used to
depict EM radiation can be described spatially in terms of its
wavelength,
the distance between identical points on the pattern. By
spatially we mean you look at different parts of the radiation at one
particular instant frozen in time.
Or you can
describe the radiation temporally
using the frequency of oscillation
(number of up and down cycles completed by an oscillating charge per
second). By temporally we mean you look at one particular fixed
point and look at how things change with time.

EM radiation can be created when
you cause a charge to move up and
down.
If you move a charge up and down slowly (upper left in the
figure above) you would produce long wavelength radiation that would
propagate out to the right at the speed of light. If you move the
charge up and down more rapidly you produce short wavelength radiation
that propagates at the same speed.
Once the EM radiation encounters the charges at the right side of
the
figure above the EM radiation causes those charges to oscillate up and
down. In the case of the long wavelength radiation the charge at
right oscillates slowly. This is low frequency and low energy
motion. The short wavelength causes the charge at right to
oscillate more rapidly - high frequency and high energy.
These three characteristics: long wavelength / low frequency / low
energy go
together. So do short wavelength / high frequency / high energy.
Note that the two different types of radiation both propagate at the
same speed.
The
following
figure
illustrates how energy can be
transported from one
place to another (even through empty space) in the form of
electromagnetic (EM) radiation.

You add energy when you cause an
electrical charge to move up and down
and create the EM radiation (top left).
In the middle
figure, the EM
radiation that is produced then travels out
to the
right (it could be through empty space or through something like the
atmosphere).
Once
the EM radiation encounters an electrical charge at another location
(bottom right),
the energy reappears as the radiation causes the charge to move.
Energy
has been transported from left to right.
This is really just a partial list
of some of the different
types of EM
radiation. In the top list, shortwave length and high energy
forms of EM radiation are on the left (gamma rays and X-rays for
example). Microwaves and radiowaves are longer wavelength, lower
energy forms of EM radiation.
We will mostly be concerned with just ultraviolet light (UV),
visible
light (VIS), and infrared light (IR). Note the micrometer
(millionths of a meter) units used for wavelength for these kinds of
light. The visible
portion of the spectrum falls between 0.4 and 0.7 micrometers.
UV and
IR light are both invisible. All of the vivid colors
shown above
are just EM radiation with slightly different wavelengths. When
you see all of these colors mixed together, you see white light.
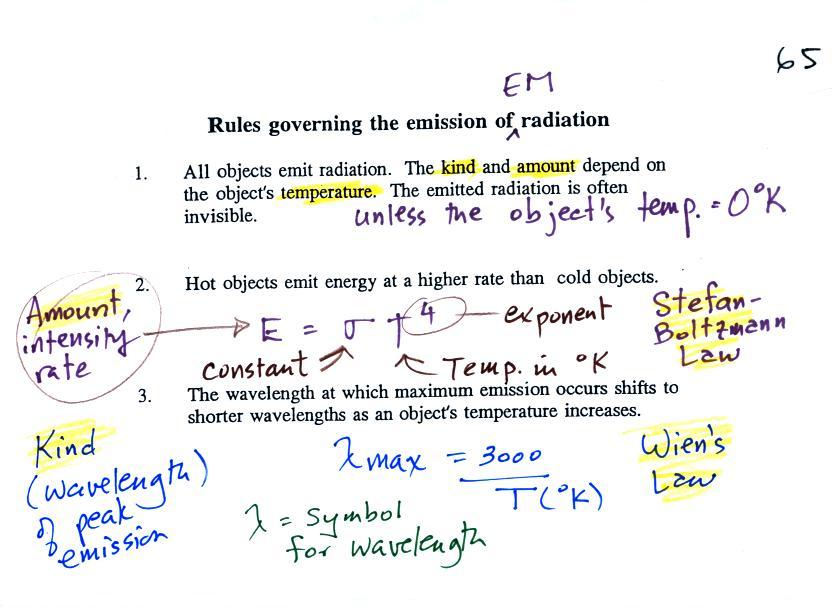
Here are some rules governing the
emission of electromagnetic
radiation:
1.
Unless an object
is very cold (0
K) it will emit EM
radiation. Everything in the classroom: the people, the
furniture, the walls and the floor, even the air, are emitting EM
radiation. Often
this radiation
will be invisible so that we can't see it and weak enough that we can't
feel it (or perhaps because it is always there we've grown accustomed
to it and ignore it). Both the amount and kind (wavelength) of
the emitted
radiation depend on the object's temperature.
2.
The second rule
allows you to
determine the amount of EM radiation (radiant energy) an object will
emit. Don't worry about the units,
you can think of this as amount, or rate, or intensity.
Don't worry about σ either, it is just a
constant. The amount depends on temperature to
the fourth
power. If the temperature of an object doubles the amount of
energy emitted will increase by a factor of 2 to the 4th power
(that's 2 x 2 x 2 x 2 = 16). A hot object just doesn't emit a
little more energy than a
cold object it emits a lot more energy than a cold object. This
is illustrated in the following figure:
The cool object is emitting 2
arrows worth of energy. The
warmer object is 2 times warmer and is emitting 32 arrows (16 times
more energy).
3.
The third rule
tells you something
about the kind of radiation emitted
by an object. We will see that objects usually emit radiation at
many different wavelengths but not in equal amounts. Objects emit
more of one particular wavelength than any of the others. This is
called λmax ("lambda max", lambda is the
greek character used to
represent wavelength) and is the wavelength of maximum
emission. The third rule allows
you to calculate λmax.
The
tendency
for warm objects to
emit radiation at shorter wavelengths is shown below.

The cool object is probably
emitting
infrared light so the 2 arrows of energy are colored red. The
warmer object will also emit IR light but also shorter
wavelengths such as yellow, green, blue, and violet (maybe even some UV
if it's warm enough).
If the cool object were warm enough to be emitting a
little visible light it would
probably appear red or orange. In that case the warmer object
would emit some of the shorter wavelengths of visible light and would
probably appear white.
The graphs at the bottom of p. 65 in the photocopied
ClassNotes also help to
illustrate the Stefan-Boltzmann law
and Wien's laws. We're really beating this topic to death.
1.
Notice first
that both and warm
and
the cold objects emit radiation
over a range of wavelengths (the curves above are like quiz scores, not
everyone gets the same score, there is a distribution of grades)
2.
Lambda max has
shifted toward
shorter wavelengths for the warmer
object. This is Wien's law in action. The warmer object is
emitting lots of types of short wavelength radiation that the colder
object
doesn't emit.
3.
The area under
the warm object
curve is much bigger than the area under
the cold object curve. The area under the curve is a measure of
the total radiant energy emitted by the object. This illustrates
the fact that the warmer object emits a lot more radiant energy than
the colder object.
An
ordinary 200 W tungsten bulb connected to a dimmer switch can be
used to demonstrate these rules (see p. 66 in the photocopied
ClassNotes). We'll be seeing the EM radiation emitted by the bulb
filament.
The graph at the bottom of p. 66 has been split up into 3 parts
and
redrawn for improved clarity.

We start with the bulb turned off (Setting 0).
The
filament will be at room temperature which we will assume is around 300
K (remember that is a reasonable and easy to remember value for the
average temperature of the earth's surface). The bulb will be
emitting radiation, it's shown on the top graph above. The
radiation is very weak so we
can't
feel it. The wavelength of peak emission is 10
micrometers which is long wavelength, far IR, radiation so
we
can't see it.
Next we use the dimmer switch to just barely turn the bulb on (the
temperature of the filament is now about 900 K).
The bulb wasn't very bright at all and had an orange color. This
is curve 1, the middle figure. Note the far left end of the
emission curve has
moved left of the 0.7 micrometer mark - into the visible portion of the
spectrum. That is what you are able to see, just the small
fraction of
the radiation emitted by the bulb that is visible light (but just
long wavelength red and orange light). Most of the radiation
emitted by the bulb is to the right of the 0.7 micrometer mark and is
invisible IR radiation (it is strong enough now that you could feel it
if you put your hand next to the bulb).
Finally we turn on the bulb completely (it was a 200 Watt bulb so
it
got
pretty bright). The filament temperature
is now about 3000K. The bulb is emitting a lot more visible
light, all the colors, though not all in equal amounts. The
mixture of the colors produces a "warm
white" light. It is warm because it is a mixture that contains a
lot more red, orange, and yellow than blue, green, and violet
light. It is interesting that most of the radiation emitted by
the bulb is still in the IR portion of the spectrum (lambda max is 1
micrometer). This is
invisible light. A tungsten bulb like this is not especially
efficient, at least not as a source of visible light.
You were able to use one of the diffraction gratings
handed out in class to
separate the
white light produced by the bulb into its separate colors.
When you looked at the bright white bulb filament through one of
the
diffraction gratings the colors were smeared out to the right and left
as shown below.

Some of the gratings handed out in
class behaved a little
differently
and spread out the colors horizontally, vertically, and diagonally.
We had time for one more page of
notes.
The curve on the left is for the sun. We first used Wien's
law and a temperature of 6000 K to calculate λmax
and got
0.5 micrometers. This is green light; the sun emits more green
light than any other kind of
light. The sun doesn't appear green because it is also emitting
lesser amounts of violet, blue, yellow, orange, and red - together this
mix of
colors appears white. 44% of the radiation emitted by the sun is
visible light, 49% is IR light (37% near IR + 12% far IR), and 7%
is ultraviolet light. More than half of the light emitted by the
sun is invisible.
100% of the light emitted by the earth (temperature = 300 K) is
invisible IR light. The
wavelength of peak emission for the earth is 10 micrometers.
Because the sun (surface of the
sun) is 20 times hotter than the earth a square foot of the sun's
surface emits energy at a rate that is 160,000 times higher than a
square foot on the
earth. Note
the vertical scale on the earth curve is different than on the sun
graph. If both the earth and sun were plotted with the same
vertical scale, the earth curve would be too small to be seen.