We didn't have time to cover all of
the 3-cell model features in class last Thursday. I briefly
mentioned them this morning. You'll find a more detailed
description at the end of the Thu., Nov. 10 notes.
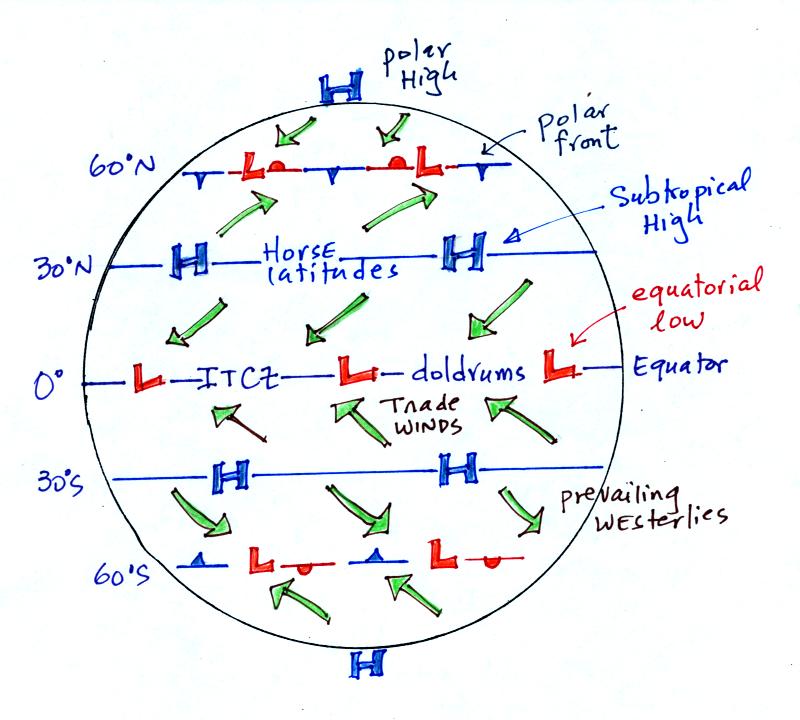
You
can usually see the Intertropical
Convergence Zone on this satellite
photograph. It's a band (sometimes nearly continuous other
times more segmented) of clouds near the equator.
We'll come back, I'm afraid, to the 3-cell model briefly at the start of class on Thursday.
The majority of today's class was devoted to thunderstorms. Because time is running short this semester, we'll try to cover thunderstorms today and tornadoes on Thursday. We'll have a look at lightning next Tuesday. I'd also like to at least cover some hurricane basics before the end of the semester.
Here's a little bit of an introduction
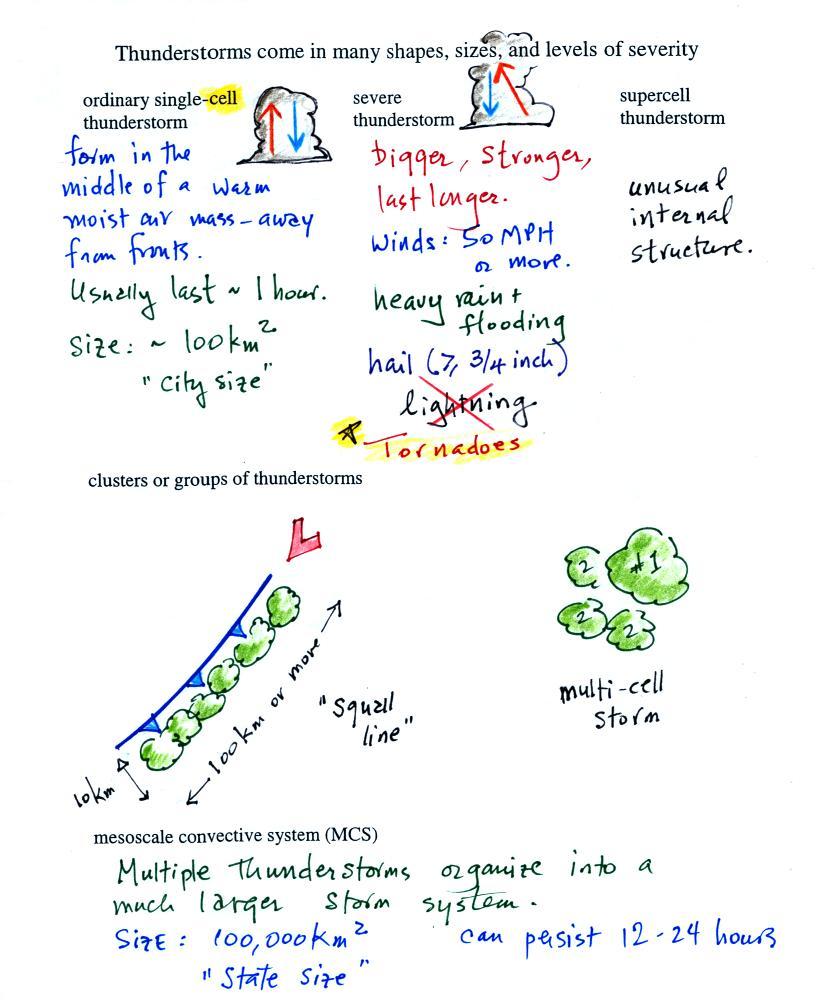
Thunderstorms come in different sizes and levels of
severity. We will mostly be concerned with ordinary
single-cell thunderstorms
(also referred to as air mass thunderstorms). Most summer
thunderstorms in Tucson are this type. An air mass
thunderstorm has a vertical updraft. A cell is just a
thunderstorm "unit."
Tilted updrafts are found in severe and supercell thunderstorms. As we shall see this allows those storms to get bigger, stronger, and last longer. Supercell thunderstorms have a complex internal structure; we'll watch a short video at some point that shows a computer simulation of the complex air motions inside a supercell thunderstorm.
The following somewhat tedious material was intended to prepare you to better appreciate a time lapse video movie of a thunderstorm developing over the Catalina mountains. I don't expect you to remember all of the details given below. The figures below are more carefully drawn versions of what was done in class.
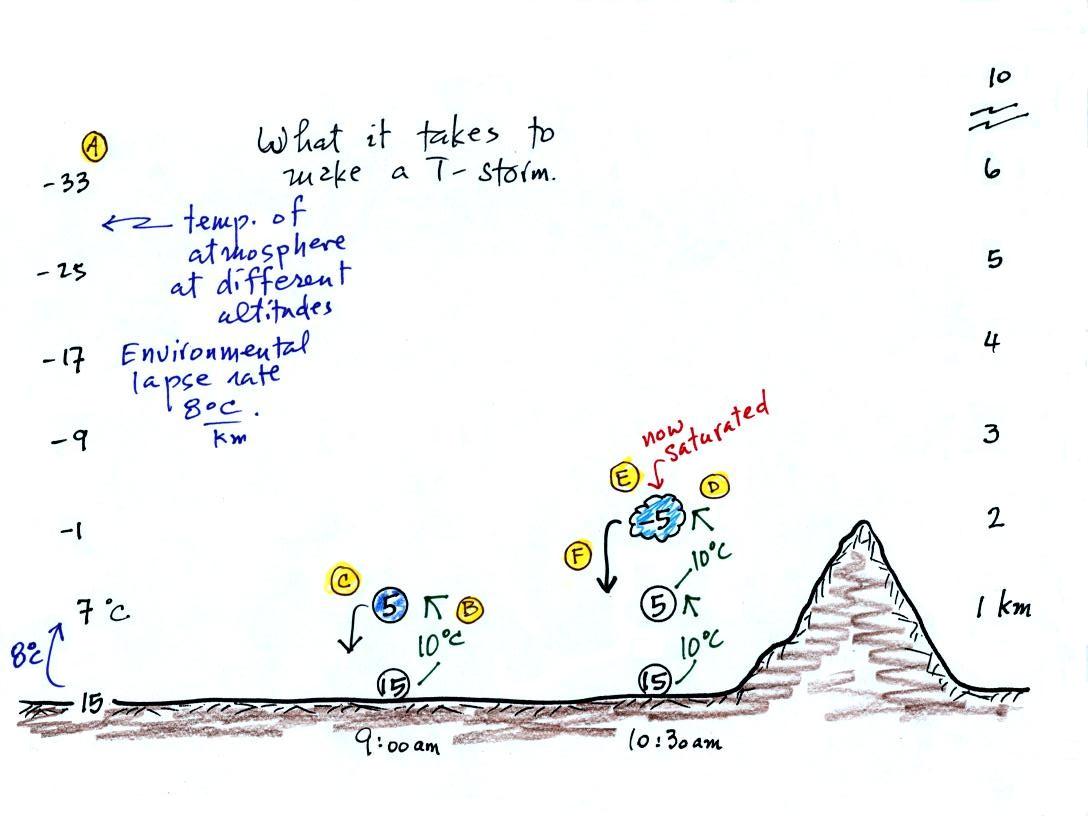
Refer back and forth between the lettered points in the figure above and the commentary below.
The numbers in Column A show the temperature of the air in the atmosphere at various altitudes above the ground (note the altitude scale on the right edge of the figure). On this particular day the air temperature was decreasing at a rate of 8 C per kilometer. This rate of decrease is referred to as the environmental lapse rate (lapse rate just means rate of decrease with altitude). Temperature could decrease more quickly than shown here or less rapidly. Temperature in the atmosphere can even increase with increasing altitude (a temperature inversion).
At Point B, some of the surface air is put into an imaginary container, a parcel. Then a meterological process of some kind lifts the air to 1 km altitude (in Arizona in the summer, sunlight heats the ground and air in contact with the ground, the warm air becomes bouyant - that's called free convection). The rising air will expand and cool as it is rising. Unsaturated (RH is less than 100%) air cools at a rate of 10 C per kilometer. So the 15 C surface air will have a temperature of 5 C once it arrives at 1 km altitude.
"Mother Nature" lifts the parcel to 1 km and "then lets go." At Point C note that the air inside the parcel is slightly colder than the air outside (5 C inside versus 7 C outside). The air inside the parcel will be denser than the air outside and the parcel will sink back to the ground.
By 10:30 am the parcel is being lifted to 2 km as shown at Point D. It is still cooling 10 C for every kilometer of altitude gain. At 2 km, at Point E the air has cooled to its dew point temperature and a cloud has formed. Notice at Point F, the air in the parcel or in the cloud (-5 C) is still colder and denser than the surrounding air (-1 C), so the air will sink back to the ground and the cloud will disappear. Still no thunderstorm at this point.
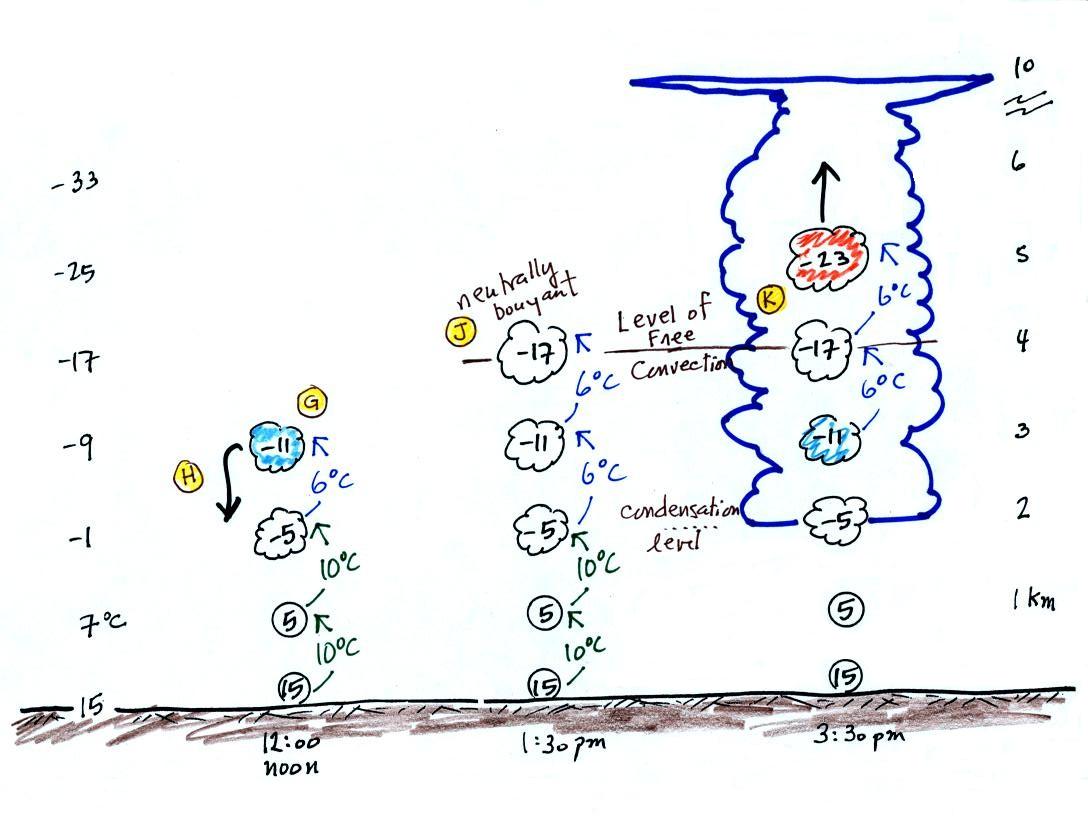
At noon, the air is lifted to 3 km. Because the air became saturated at 2 km, it will cool at a different rate between 2 and 3 km altitude. It cools at a rate of 6 C/km instead of 10 C/km. The saturated air cools more slowly because release of latent heat during condensation offsets some of the cooling due to expansion. The air that arrives at 3km, Point H, is again still colder than the surrounding air and will sink back down to the surface.
By 1:30 pm the air is getting high enough that it has become neutrally bouyant, it has the same temperature and density as the air around it (-17 C inside and -17 C outside). This is called the level of free convection, Point J in the figure.
If you can, somehow or another, lift air above the level of free convection it will find itself warmer and less dense than the surrounding air as shown at Point K and will float upward to the top of the troposphere on its own. This is really the beginning of a thunderstorm. The thunderstorm will grow upward until it reaches very stable air at the bottom of the stratosphere.
This would normally have been followed by a time lapse video tape of actual thunderstorm formation and growth. I couldn't do that in class on Tuesday because the cabinet where the VCR is kept was locked. Here's a pretty good substitute. I'll try to show something at the start of class on Thursday.
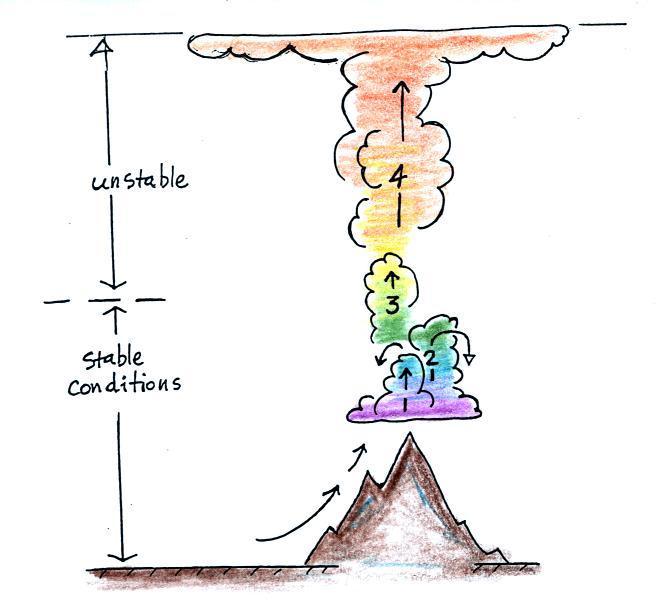
The events leading up to the initiation of a summer air mass thunderstorm (something we looked at in detail above) is summarized in the figure below. It takes some effort and often a good part of the day before a thunderstorm forms. The air must be lifted to just above the level of free convection (the dotted line at middle left in the picture). Once air is lifted above the level of free convection it finds itself warmer and less dense that the air around it and floats upward on its own. I've tried to show this with colors below. Cool colors below the level of free convection. The air in the lifted parcel is colder and denser than its surroundings. Warm colors indicate parcel air that is warmer and less dense than the surroudings once lifted above the dotted line. Once the parcel is lifted above the level of free convection it becomes bouyant; this is the moment at which the air mass thunderstorm begins.
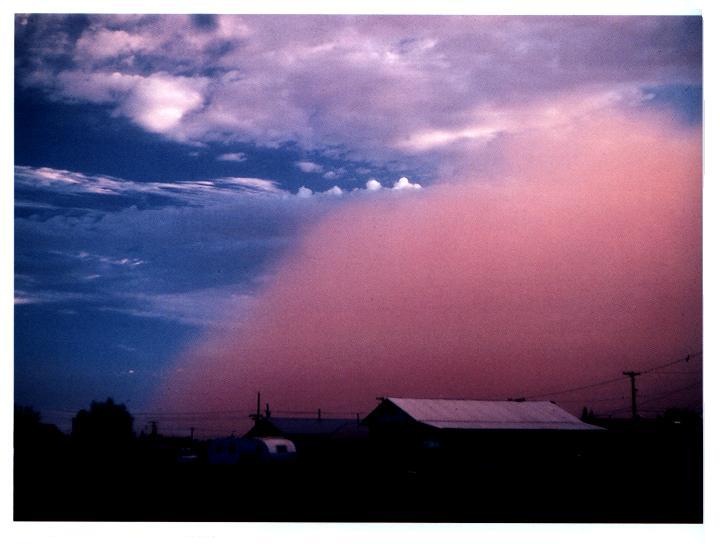
The
gust front in this picture (taken
near Winslow , Az
The following picture shows a shelf cloud.
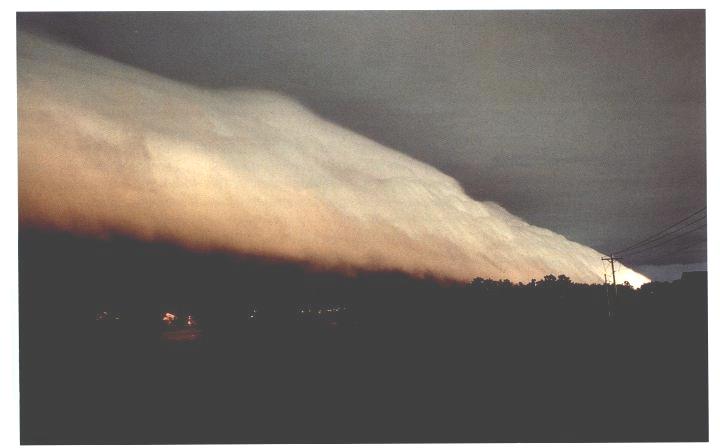
Warm moist air if lifted by the cold air behind the gust front which is moving from left to right in this picture. The shelf cloud is very close to the ground, so the warm air must have been very moist because it didn't have to rise and cool much before it became saturated and a cloud formed. Here are a couple of pretty good videos (Grand Haven, MI and Massillon, OH)
Tucson
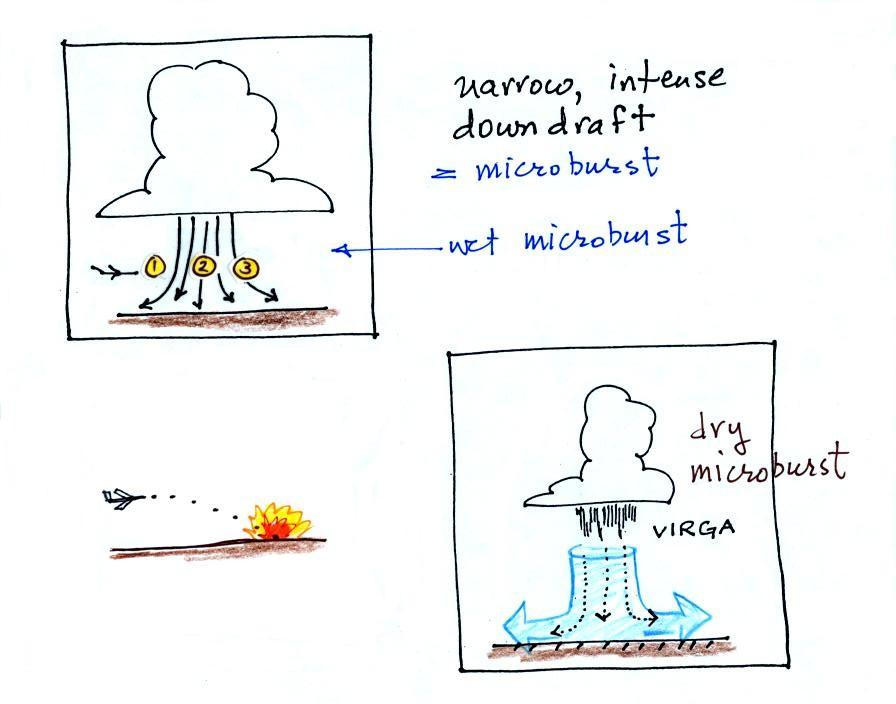
Microbursts are a serious threat to aircraft especially when they are close to the ground during landing or takeoff. An inattentive pilot encountering headwinds at Point 1 might cut back on the power. Very quickly the plane would lose the headwinds (Point 2) and then encounter tailwinds (Point 3). The plane might lose altitude so quickly that it would crash into the ground before corrective action could be taken. Microburst associated wind shear was largely responsible for the crash of Delta Airlines Flight 191 while landing at the Dallas Fort Worth airport on Aug. 2, 1985 (click here to watch a simulation of the final approach into the airport).
Falling rain could warn of a (wet) microburst. In other cases, dangerous dry microburst winds might be invisible (the virga, evaporating rain, will cool the air, make the air more dense, and strengthen the downdraft winds).
A simple demonstration (the last of my homemade videos, I promise) can give you an idea of what a microburst might look like.
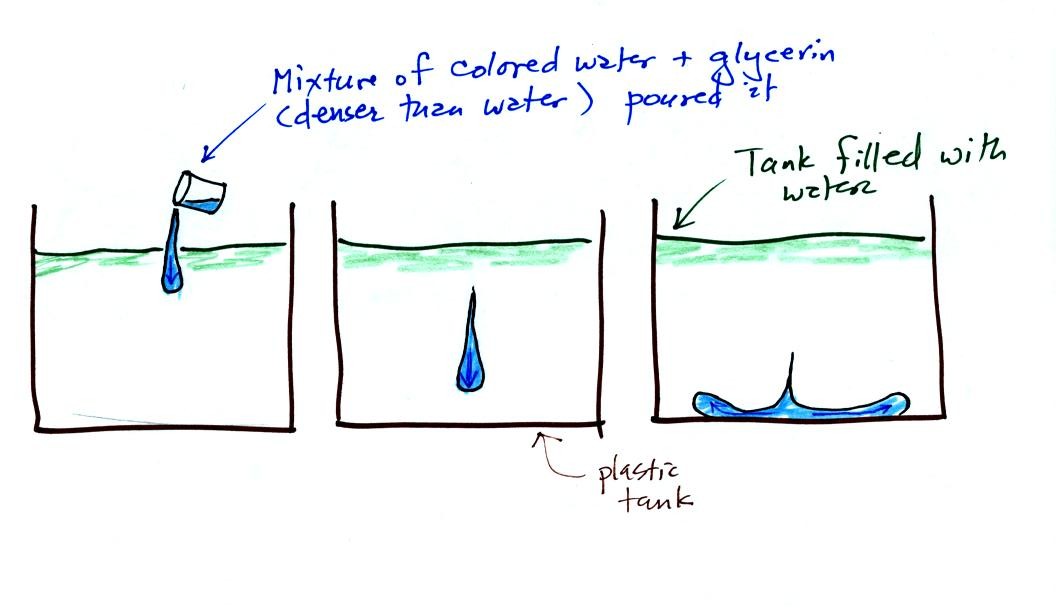
A large plastic tank was filled with water, the water represents air in the atmosphere. Then a colored mixture of water and glycerin, which is a little denser than water, is poured into the tank. This represents the cold dense air in a thunderstorm downdraft. The colored liquid sinks to the bottom of the tank and then spreads out horizontally. In the atmosphere the cold downdraft air hits the ground and spreads out horizontally. These are the strong winds that can reach 100 MPH.
We'll come back, I'm afraid, to the 3-cell model briefly at the start of class on Thursday.
The majority of today's class was devoted to thunderstorms. Because time is running short this semester, we'll try to cover thunderstorms today and tornadoes on Thursday. We'll have a look at lightning next Tuesday. I'd also like to at least cover some hurricane basics before the end of the semester.
Here's a little bit of an introduction
Tilted updrafts are found in severe and supercell thunderstorms. As we shall see this allows those storms to get bigger, stronger, and last longer. Supercell thunderstorms have a complex internal structure; we'll watch a short video at some point that shows a computer simulation of the complex air motions inside a supercell thunderstorm.
The following somewhat tedious material was intended to prepare you to better appreciate a time lapse video movie of a thunderstorm developing over the Catalina mountains. I don't expect you to remember all of the details given below. The figures below are more carefully drawn versions of what was done in class.
Refer back and forth between the lettered points in the figure above and the commentary below.
The numbers in Column A show the temperature of the air in the atmosphere at various altitudes above the ground (note the altitude scale on the right edge of the figure). On this particular day the air temperature was decreasing at a rate of 8 C per kilometer. This rate of decrease is referred to as the environmental lapse rate (lapse rate just means rate of decrease with altitude). Temperature could decrease more quickly than shown here or less rapidly. Temperature in the atmosphere can even increase with increasing altitude (a temperature inversion).
At Point B, some of the surface air is put into an imaginary container, a parcel. Then a meterological process of some kind lifts the air to 1 km altitude (in Arizona in the summer, sunlight heats the ground and air in contact with the ground, the warm air becomes bouyant - that's called free convection). The rising air will expand and cool as it is rising. Unsaturated (RH is less than 100%) air cools at a rate of 10 C per kilometer. So the 15 C surface air will have a temperature of 5 C once it arrives at 1 km altitude.
"Mother Nature" lifts the parcel to 1 km and "then lets go." At Point C note that the air inside the parcel is slightly colder than the air outside (5 C inside versus 7 C outside). The air inside the parcel will be denser than the air outside and the parcel will sink back to the ground.
By 10:30 am the parcel is being lifted to 2 km as shown at Point D. It is still cooling 10 C for every kilometer of altitude gain. At 2 km, at Point E the air has cooled to its dew point temperature and a cloud has formed. Notice at Point F, the air in the parcel or in the cloud (-5 C) is still colder and denser than the surrounding air (-1 C), so the air will sink back to the ground and the cloud will disappear. Still no thunderstorm at this point.
At noon, the air is lifted to 3 km. Because the air became saturated at 2 km, it will cool at a different rate between 2 and 3 km altitude. It cools at a rate of 6 C/km instead of 10 C/km. The saturated air cools more slowly because release of latent heat during condensation offsets some of the cooling due to expansion. The air that arrives at 3km, Point H, is again still colder than the surrounding air and will sink back down to the surface.
By 1:30 pm the air is getting high enough that it has become neutrally bouyant, it has the same temperature and density as the air around it (-17 C inside and -17 C outside). This is called the level of free convection, Point J in the figure.
If you can, somehow or another, lift air above the level of free convection it will find itself warmer and less dense than the surrounding air as shown at Point K and will float upward to the top of the troposphere on its own. This is really the beginning of a thunderstorm. The thunderstorm will grow upward until it reaches very stable air at the bottom of the stratosphere.
This would normally have been followed by a time lapse video tape of actual thunderstorm formation and growth. I couldn't do that in class on Tuesday because the cabinet where the VCR is kept was locked. Here's a pretty good substitute. I'll try to show something at the start of class on Thursday.
The events leading up to the initiation of a summer air mass thunderstorm (something we looked at in detail above) is summarized in the figure below. It takes some effort and often a good part of the day before a thunderstorm forms. The air must be lifted to just above the level of free convection (the dotted line at middle left in the picture). Once air is lifted above the level of free convection it finds itself warmer and less dense that the air around it and floats upward on its own. I've tried to show this with colors below. Cool colors below the level of free convection. The air in the lifted parcel is colder and denser than its surroundings. Warm colors indicate parcel air that is warmer and less dense than the surroudings once lifted above the dotted line. Once the parcel is lifted above the level of free convection it becomes bouyant; this is the moment at which the air mass thunderstorm begins.
Once a
thunderstorm develops it then goes through 3 stages.
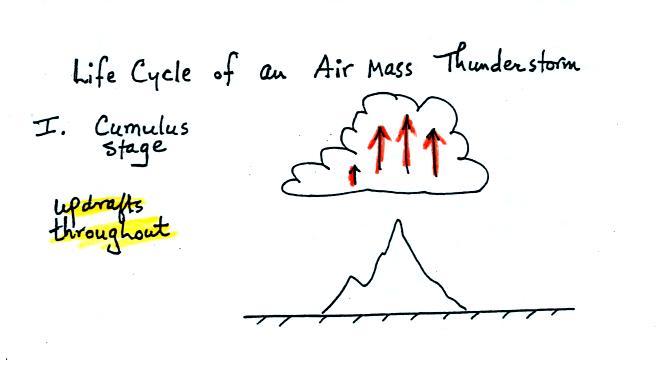
In the
first stage you would only find updrafts inside the cloud (that's all
you need to know about this stage, you don't even need to remember its
name).
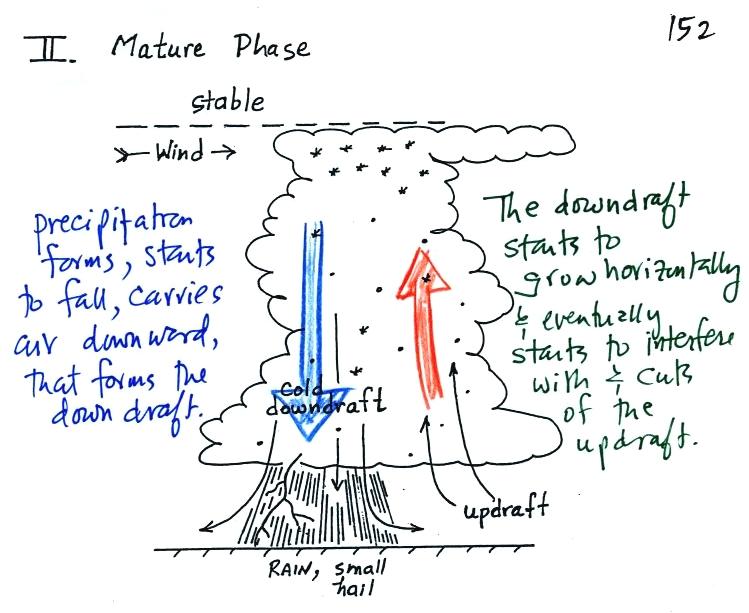
Once precipitation has formed and grown to a certain size, it will
begin to
fall and drag air downward with it. This is the beginning of the
mature
stage where you find both an updraft and a downdraft inside the
cloud.
The falling precipitation will also pull in dry air from outside the
thunderstorm (this is called entrainment). Precipitation will mix
with
this drier air and evaporate. The evaporation will strengthen the
downdraft
(the evaporation cools the air and makes it more
dense).
The thunderstorm is strongest in the mature stage. This is when
the
heaviest rain, strongest winds, and most of the lightning occur.
Eventually the downdraft spreads horizontally throughout the inside of the cloud and begins to interfere with the updraft. This marks the beginning of the end for this thunderstorm.
Eventually the downdraft spreads horizontally throughout the inside of the cloud and begins to interfere with the updraft. This marks the beginning of the end for this thunderstorm.
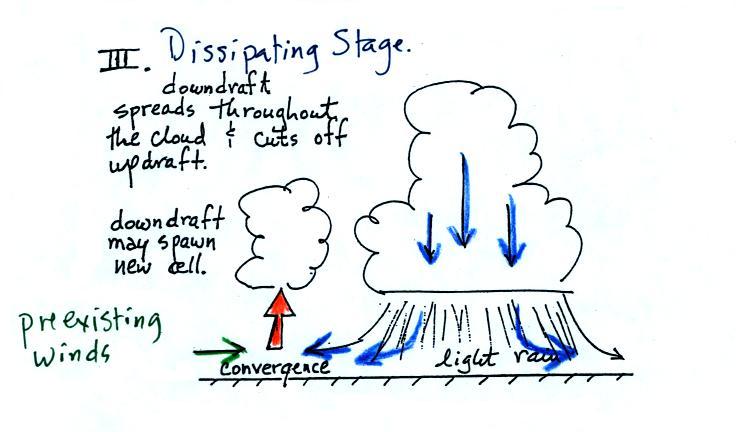
The
downdraft eventually fills the interior of the cloud. In this
dissipating stage you would only find weak downdrafts
throughout the cloud.
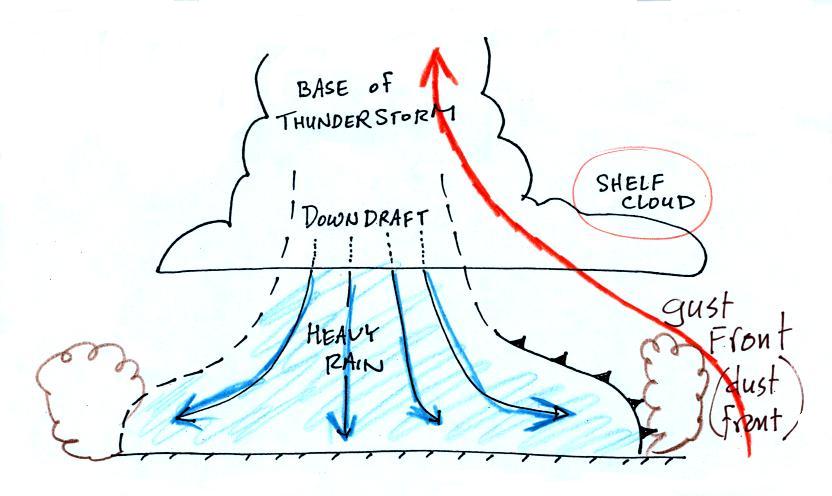
Note how the winds from one thunderstorm can cause a region of convergence on one side of the original storm and can lead to the development of new storms. Preexisting winds refers to winds that were blowing before the thunderstorm formed. Convergence between the prexisting and the thunderstorm downdraft winds creates rising air that can initiate a new thunderstorm.
Note how the winds from one thunderstorm can cause a region of convergence on one side of the original storm and can lead to the development of new storms. Preexisting winds refers to winds that were blowing before the thunderstorm formed. Convergence between the prexisting and the thunderstorm downdraft winds creates rising air that can initiate a new thunderstorm.
The
picture below shows some of the features at the base of a thunderstorm.
The following picture shows a shelf cloud.
Warm moist air if lifted by the cold air behind the gust front which is moving from left to right in this picture. The shelf cloud is very close to the ground, so the warm air must have been very moist because it didn't have to rise and cool much before it became saturated and a cloud formed. Here are a couple of pretty good videos (Grand Haven, MI and Massillon, OH)
Microbursts are a serious threat to aircraft especially when they are close to the ground during landing or takeoff. An inattentive pilot encountering headwinds at Point 1 might cut back on the power. Very quickly the plane would lose the headwinds (Point 2) and then encounter tailwinds (Point 3). The plane might lose altitude so quickly that it would crash into the ground before corrective action could be taken. Microburst associated wind shear was largely responsible for the crash of Delta Airlines Flight 191 while landing at the Dallas Fort Worth airport on Aug. 2, 1985 (click here to watch a simulation of the final approach into the airport).
Falling rain could warn of a (wet) microburst. In other cases, dangerous dry microburst winds might be invisible (the virga, evaporating rain, will cool the air, make the air more dense, and strengthen the downdraft winds).
A simple demonstration (the last of my homemade videos, I promise) can give you an idea of what a microburst might look like.
A large plastic tank was filled with water, the water represents air in the atmosphere. Then a colored mixture of water and glycerin, which is a little denser than water, is poured into the tank. This represents the cold dense air in a thunderstorm downdraft. The colored liquid sinks to the bottom of the tank and then spreads out horizontally. In the atmosphere the cold downdraft air hits the ground and spreads out horizontally. These are the strong winds that can reach 100 MPH.
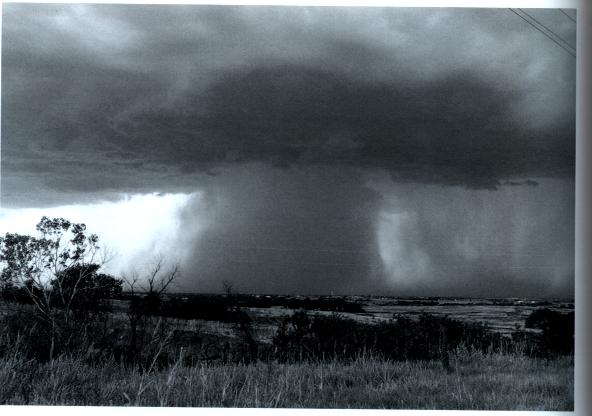
Here's
a picture of a wet microburst, a narrow intense thunderstorm downdraft
and
rain.
Here are three microburst videos from YouTube. The first video shows a microburst from some distance away. The second video was taken in the heavy rain and strong winds under a thunderstorm in the microburst. You'll see a power pole snapped in half by the microburst winds at about 2:26 in the video. Here's a third video of a microburst that hit Princeton KS in July 2009. Someone watching the storm estimated the winds were at least 90 MPH.
Here are three microburst videos from YouTube. The first video shows a microburst from some distance away. The second video was taken in the heavy rain and strong winds under a thunderstorm in the microburst. You'll see a power pole snapped in half by the microburst winds at about 2:26 in the video. Here's a third video of a microburst that hit Princeton KS in July 2009. Someone watching the storm estimated the winds were at least 90 MPH.