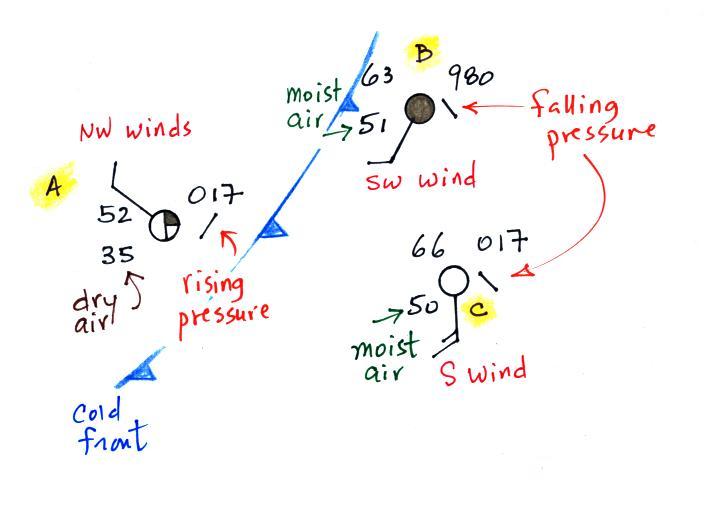
| Weather
variable |
Behind |
Passing |
Ahead |
| Temperature |
cool, cold, colder* |
warm |
|
| Dew Point |
usually much drier |
may be moist (though that
is often not the case here in the desert southwest) |
|
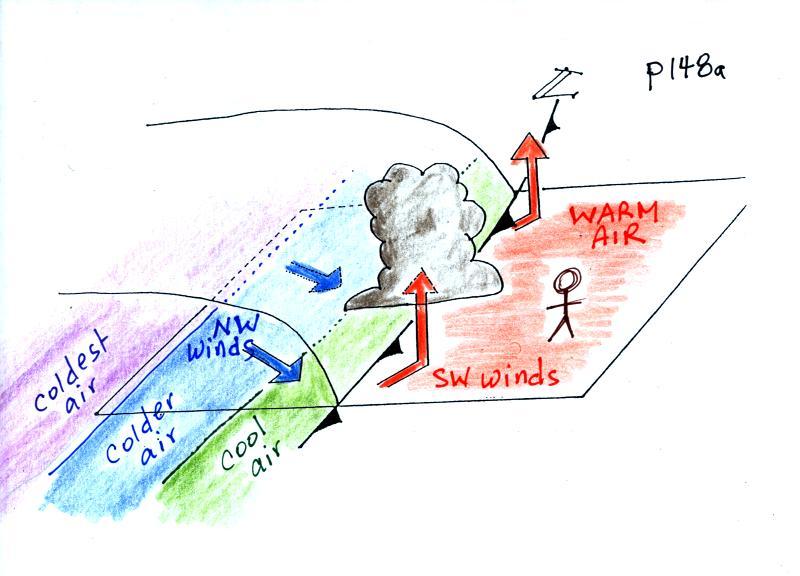
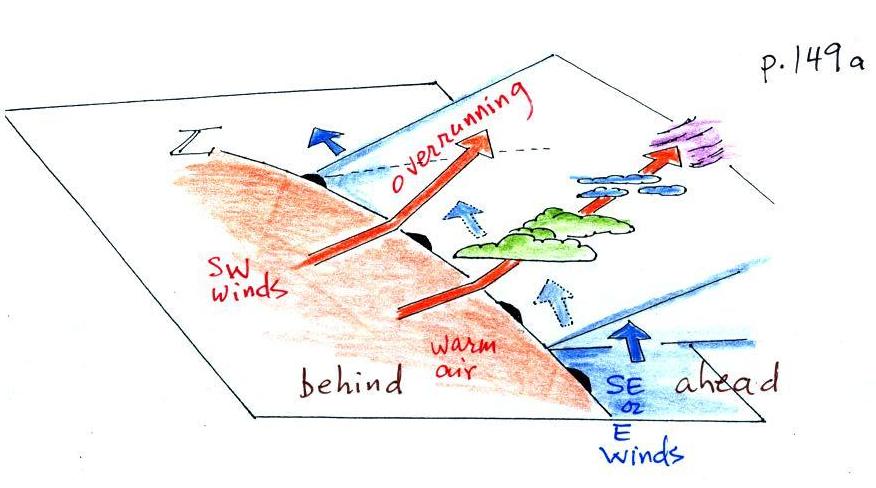
| Winds |
northwest |
gusty winds (dusty) |
from the southwest |
| Clouds,
Weather |
clearing |
rain clouds, thunderstorms
in narrow band along the front (if the warm air mass is moist) |
might see some high clouds |
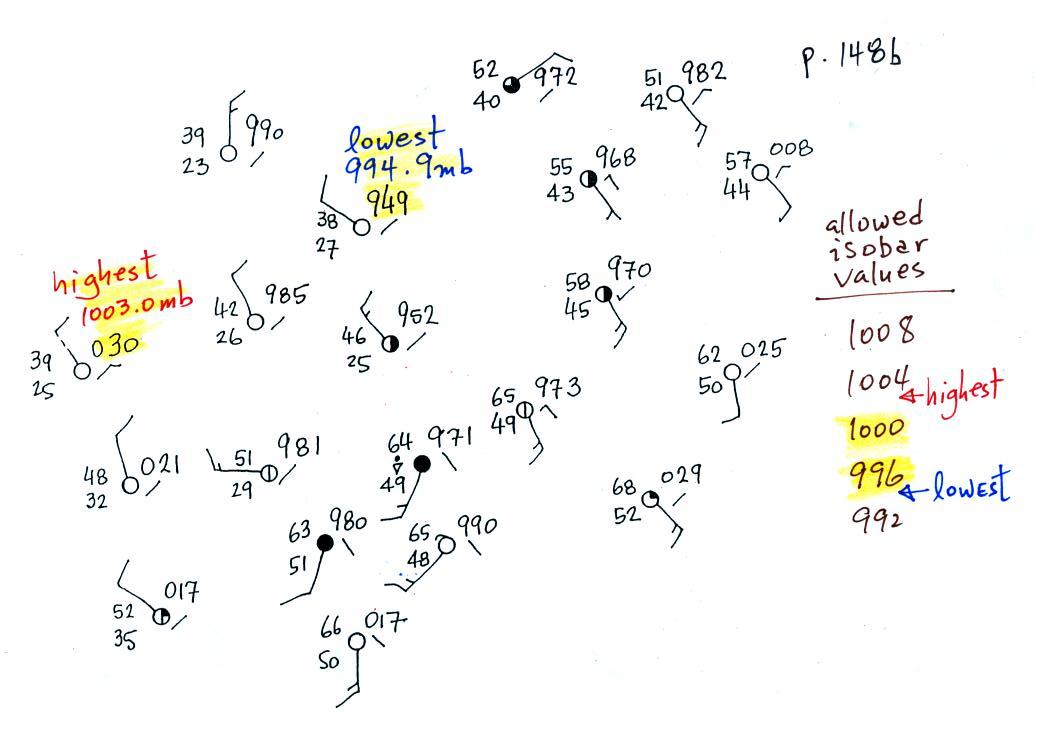
| Pressure |
rising |
reaches a minimum |
falling |
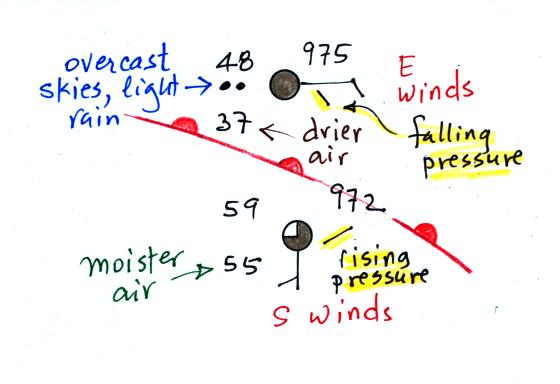
| Weather
Variable |
Behind
(after) |
Passing |
Ahead
(before) |
| Temperature |
warmer |
cool |
|
| Dew point |
may be moister |
drier |
|
| Winds |
from S or SW, maybe W |
from S, SE, even the E |
|
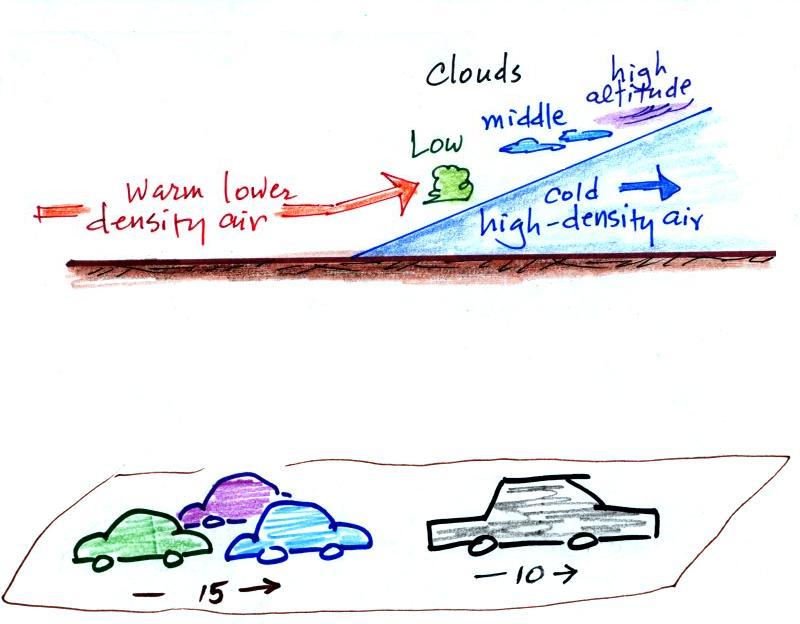
| Clouds, Weather |
clearing |
wide variety of clouds that
may precede arrival of the front by a day or two may be a wide variety of types of precipitation also (snow, sleet, freezing rain, and rain) |
|
| Pressure |
rising |
minimum |
falling |