I asked three questions
(shown above in red) in class.
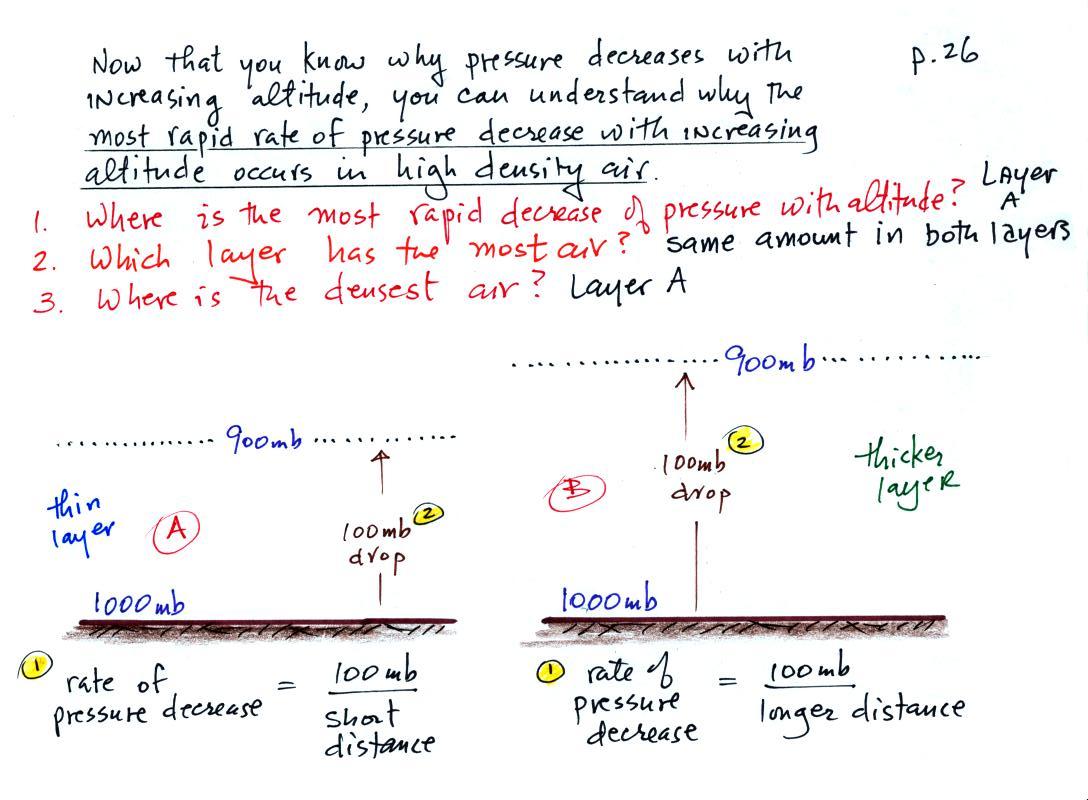
1. The rate of pressure decrease with increasing altitude is
greatest in Layer A. To determine the rate of pressure decrease
you divide the pressure change (100 mb for both layers) by the distance
over which that change occurs. The 100 mb change takes place in a
shorter distance in Layer A than in Layer B. Layer A has the
highest rate of pressure decrease with increasing altitude.
2. There is a 100 mb drop in pressure in both air
layers. In order for this to be true both layers must have the
same weight and therefore the same mass. Both layers contain the
same amount of air.
3. Density is mass divided by volume. The
air in the Layer A is denser than the air
in Layer B. The same amount (mass) of air is squeezed into a
thinner layer, a smaller volume, in the left layer. This results
in higher density air.
So both the most rapid rate of pressure decrease with altitude and
the densest air are found in Layer A.
The fact that the rate of pressure decrease with increasing
altitude depends on air density is a fairly subtle but important
concept. This concept
will come up 2 or 3 more times later in the semester. For
example, we will use this concept to explain why hurricanes can
intensify and
get as
strong as they do.
The next
bunch of material tries to explain how a mercury barometer
works. A mercury
barometer is used to measure atmospheric pressure and is really
just a balance that can be used to weigh the
atmosphere. You'll find a messier version of what
follows on p. 29 in the
photocopied Class Notes.
 |
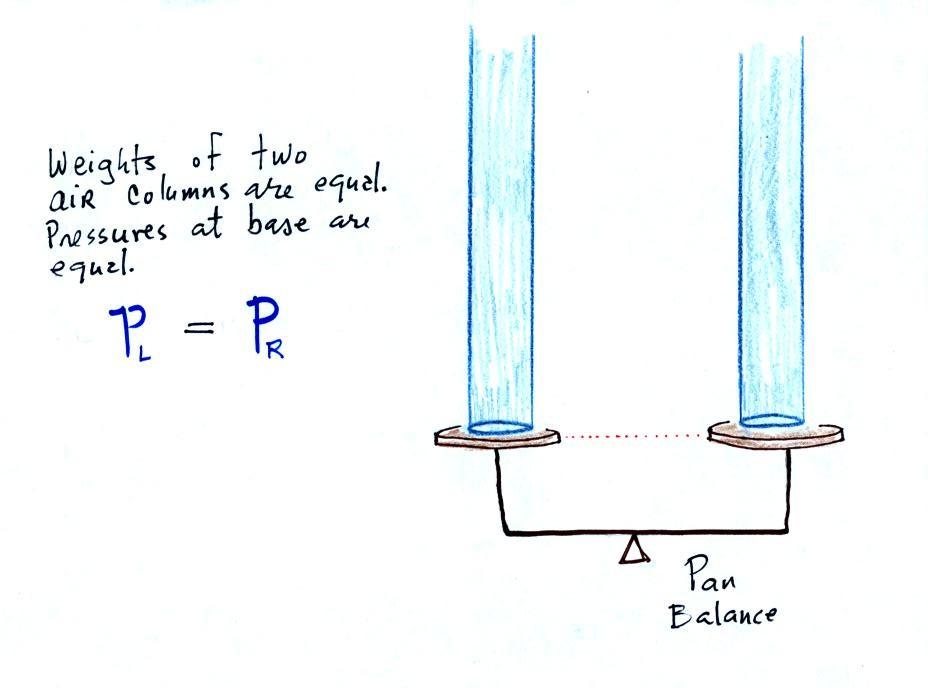 |
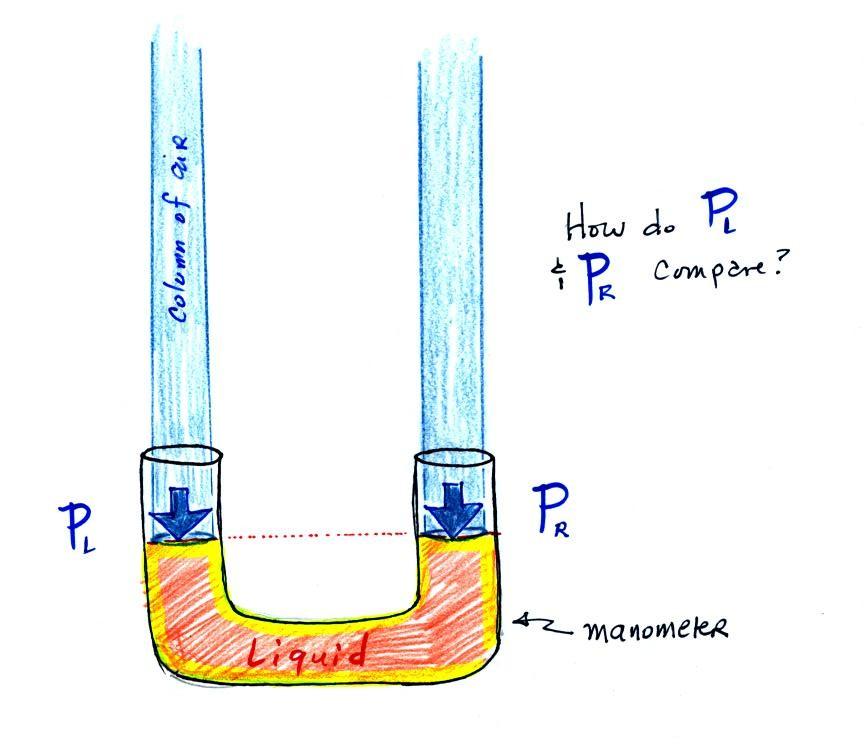
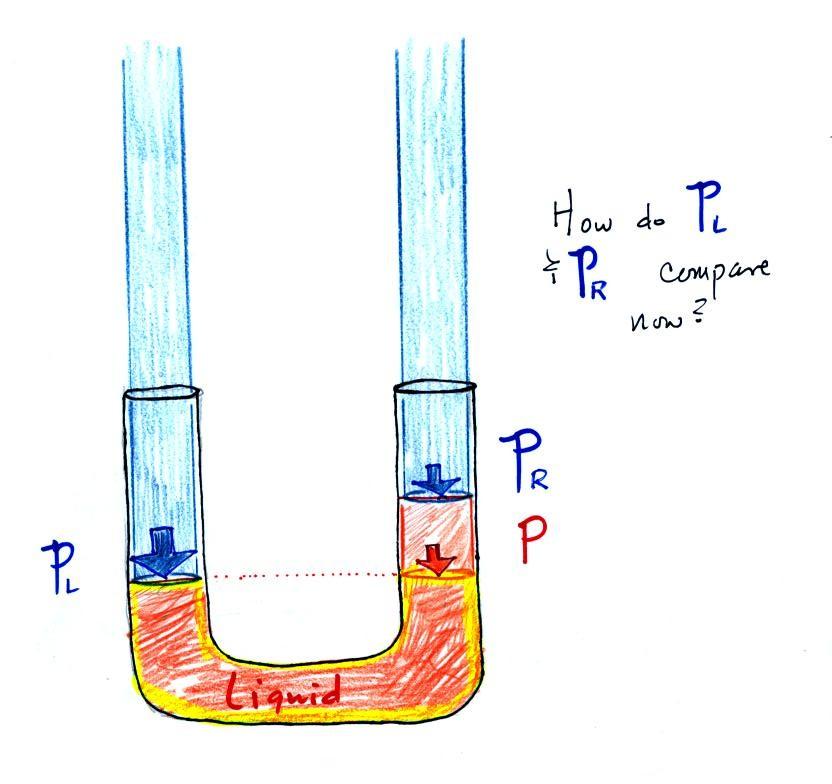
The instrument in the left figure
above ( a u-shaped
glass
tube filled with a
liquid of some kind) is actually called a manometer and can be used to
measure pressure
difference. The
two ends of the tube are open so that air can get inside and air
pressure can press on the liquid. Given that the liquid levels on
the two sides of the manometer
are equal, what could you about PL
and PR?
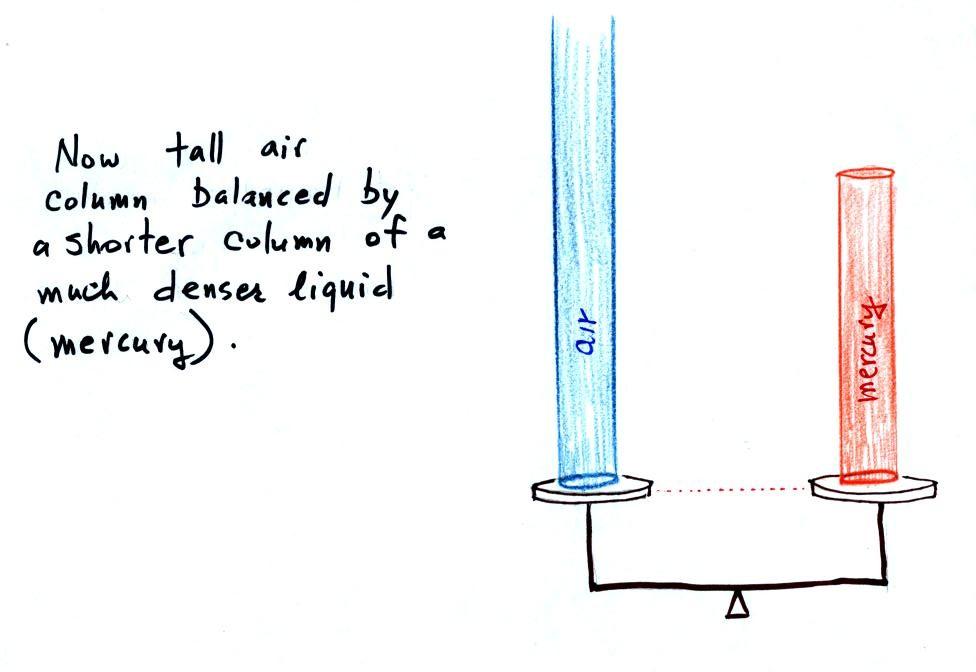
The liquid can slosh back and
forth just like the pans on a balance can move up and down. A
manometer really behaves just like a pan balance (pictured at
right) or a teeter totter (seesaw).
Because
the
two
pans
are
in
balance,
the
two
columns
of
air
have the same weight. PL and PR
are equal (but note
that you don't really know what either pressure is, just that they are
equal).
 |
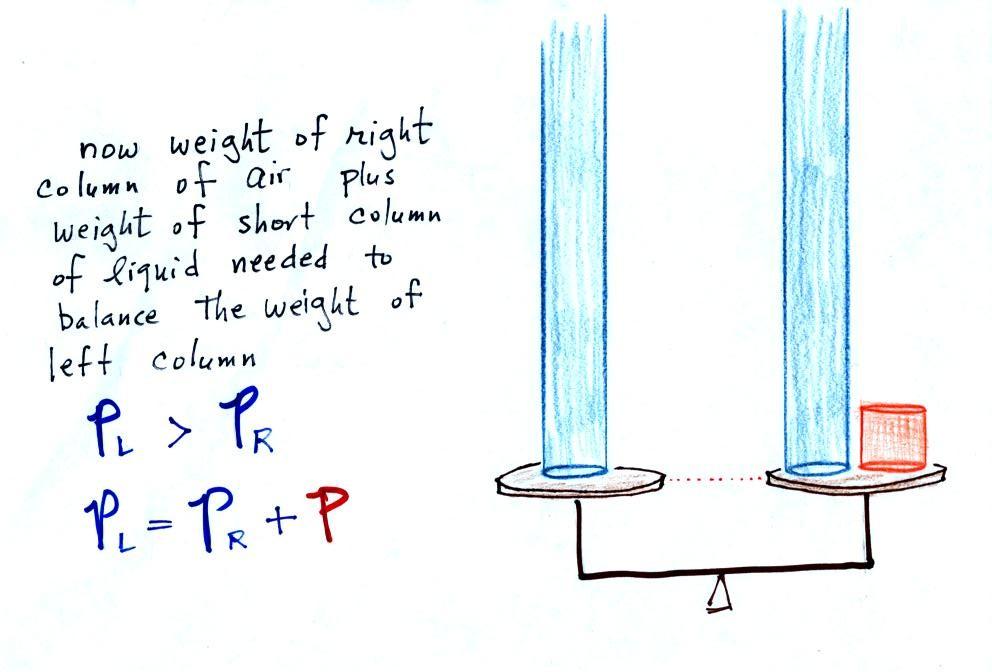 |
Now
the
situation is a little
different,
the
liquid levels
are no
longer equal. You probably realize that the air pressure on the
left, PL, is a little higher than
the air pressure on the
right,
PR. PL is now being balanced by PR
+ P acting together. P
is the pressure produced by the weight of the extra fluid on the right
hand side of
the manometer (the fluid that lies above the dotted line). The
height
of
the
column
of
extra
liquid
provides
a
measure
of
the
difference
between
PL and PR.
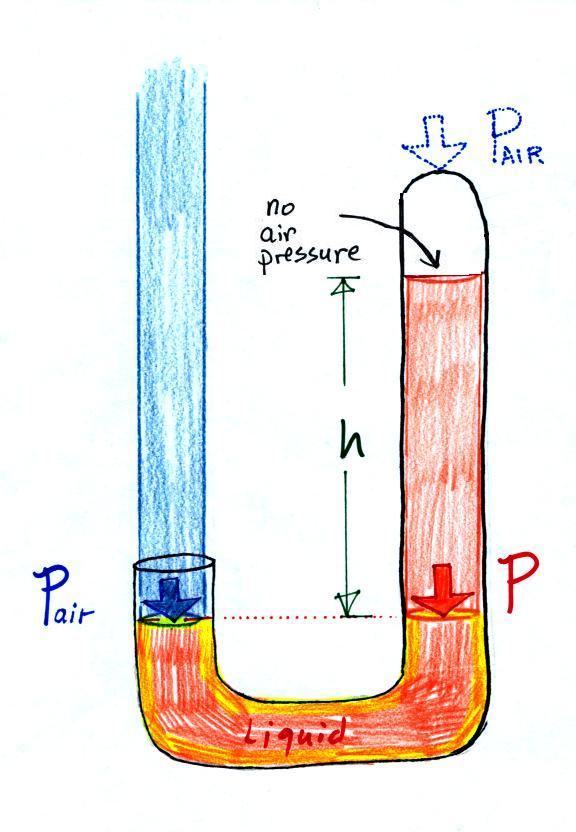
Next we will just go and close off
the right hand side of the
manometer.
|
|
Air pressure can't get into the
right tube any
more. Now at the level of the dotted line the balance is between
Pair and P (pressure by the extra
liquid on the
right). If
Pair
changes, the height of the right column, h, will
change. You now have a barometer, an instrument that can measure
and monitor the atmospheric pressure.
Barometers like this are usually
filled with mercury. Mercury is
a liquid. You need a liquid that can slosh back and forth in
response to changes in air pressure. Mercury is also very dense
which
means the barometer won't need to be as tall as if you used something
like water. A water barometer would need to be over 30 feet
tall. With mercury you will need only a 30 inch tall column to
balance the weight of the atmosphere at sea level under normal
conditions (remember the 30 inches of mercury pressure units mentioned
earlier). Mercury also has a low rate of
evaporation so you don't have much mercury gas at the top of the right
tube (there's some gas, it doesn't produce much pressure, but it would
poison you if you were to start to breath it).

Here is a more conventional
barometer design.
The bowl of
mercury is usually covered in such a way that it can sense changes in
pressure but is sealed to keep poisonous mercury
vapor from filling a room.
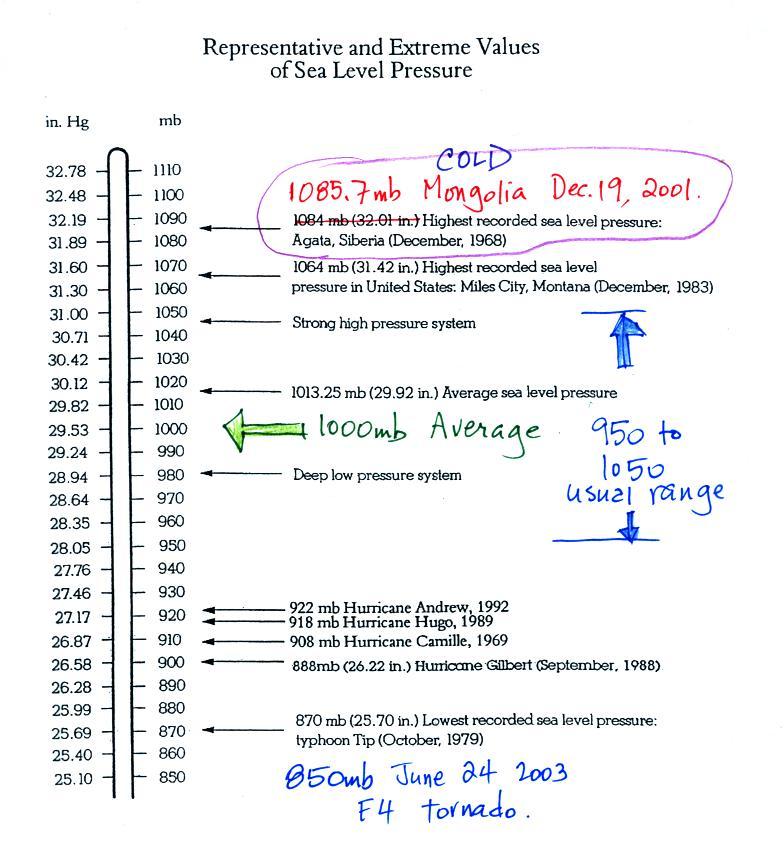
Average sea level atmospheric
pressure is about 1000 mb. The figure above (p. 30 in the
photocopied Class Notes)
gives 1013.25 mb but 1000 mb is close enough in this class. The
actual pressure can be higher or lower than this average value and
usually falls between 950 mb and 1050 mb.
The figure also includes record high and low pressure
values. Record high sea level
pressure values occur during cold weather. The TV
weather
forecast will often associate hot weather with high pressure.
They are generally referring to upper level high pressure (high
pressure at some level above the ground) rather than surface pressure.
Most of the record low pressure
values have all been set by intense hurricanes (the extreme low
pressure is the reason these storms are so intense). Hurricane
Wilma in 2005 set a new record low sea level pressure reading for the
Atlantic, 882 mb. Hurricane Katrina had a pressure of 902
mb.
The following table lists some of the information on hurricane strength
from p. 146a in the photocopied ClassNotes. 3 of the 10 strongest
N. Atlantic hurricanes occurred in 2005.