Mon. Oct. 31, 2011
click here to download today's notes in a more printer friendly format

Music before class this afternoon from Amadou & Mariam ("Africa" and "Unissons Nous")

Quiz #3 is on Wednesday this week.  The usual round of reviews will be held today and Tuesday afternoon (also Wednesday afternoon for the T Th class).  See the class homepage or the Quiz #3 Study Guide for times and locations.

You can learn more about climate change from a world expert this coming Wednesday evening at 7 pm in Harvill 150.  You can learn more here.

This is the first of two lectures on climate change.  This is a big, complex, and contentious subject and we will only scratch the surface.  In this lecture we will concentrate on some of the evidence that humans may be changing climate, in particular that human activities are causing greenhouse gas concentrations to increase.  In the next lecture we will look at whether global temperatures have been changing and at predictions for the next 100 years or so.  We also list some of the consequences that climate change may bring.

The current concern centers on increasing atmospheric concentrations of greenhouse gases and how this may affect energy balance between
the earth surface and the atmosphere. 


Carbon dioxide is probably the best known of the greenhouse gases though there is much more water vapor in the atmosphere.  Much of what we will say about CO2 applies to the other greenhouse gases as well.


Point 2.   Atmospheric CO2 concentrations are increasing, largely as a result of human activities.  This is generally accepted as fact.  We'll look at some of the evidence below.

Point 3.   The basic worry is that increasing greenhouse gas concentrations will strengthen the greenhouse effect and will cause the earth's surface to warm.  This is a hypothesis, though many (perhaps the vast majority of) scientists regard this as fact and believe that enhanced greenhouse effect warming is already underway.

      Before we look at enhancement of the greenhouse effect, it is important to remember that the greenhouse effect has a beneficial side.   You might refer to this as the natural greenhouse effect (i.e. one that has not been affected or influenced by human activities)

Point 3a.  If the earth's atmosphere did not contain any greenhouse gases, the global annual average surface temperature would be about 0o F.  That's pretty cold.
Point 3b.  The presence of greenhouse gases raises this average temperature to about 60o F and makes the earth a much more habitable place.

Point 4.   The concern is that increasing atmospheric greenhouse gas concentrations might cause some additional warming (and we rely on computer models to predict or estimate how much warming there will be and how the amount of warming might depend on location).  This alone might not sound like a bad thing.  However even a small change in average temperature might melt polar ice and cause a rise in sea level that at the very least might pose an environmental threat to coastal areas.  Warming might change weather patterns and bring more precipitation to some areas and prolonged drought to other places (like Arizona).  Vectors that can carry serious tropical diseases (such as malaria & dengue fever) might spread into more temperate areas.  Plant and animal species might be forced to migrate in order to find a suitable environment; some might not be able to adapt quickly enough and could go extinct.


Now some of the experimental data that show atmospheric carbon dioxide concentrations are increasing.

The "Keeling" curve shows measurements of CO2 that were begun (by a graduate student named Charles Keeling) in 1958 on top of the Mauna Loa volcano in Hawaii (the air there is pristine and not affected by nearby cities and other sources of pollutants).  Carbon dioxide concentrations have increased from 315 ppm to about 385 ppm between 1958 and the present day.  The small wiggles (one wiggle per year) show that CO2 concentration changes slightly during the course of a year (it probably also changes slightly during the course of a day). 

You'll find an up to date (and more carefully drawn) record of atmospheric CO2 concentration from the Mauna Loa observatory at the Scripps Institution of Oceanography site
.

Once scientists saw this data they began to wonder about how CO2 concentrations might have been changing prior to 1958.  But how could you now,  in 2011 say, go back and measure the amount of CO2 in the atmosphere in the past?  Scientists have found a very clever way of doing just that.  It involves coring down into ice sheets that have been building up in Antarctica and Greenland for hundreds of thousands of years.


As layers of snow are piled on top of each other year after year, the snow at the bottom is compressed and eventually turns into a thin layer of solid ice.  The ice contains small bubbles of air trapped in the snow, samples of the atmosphere at the time the snow originally fell.  Scientists are able to date the ice layers and then take the air out of these bubbles and measure the carbon dioxide concentration.  This isn't easy, the layers are very thin, the bubbles are small and it is hard to avoid contamination.


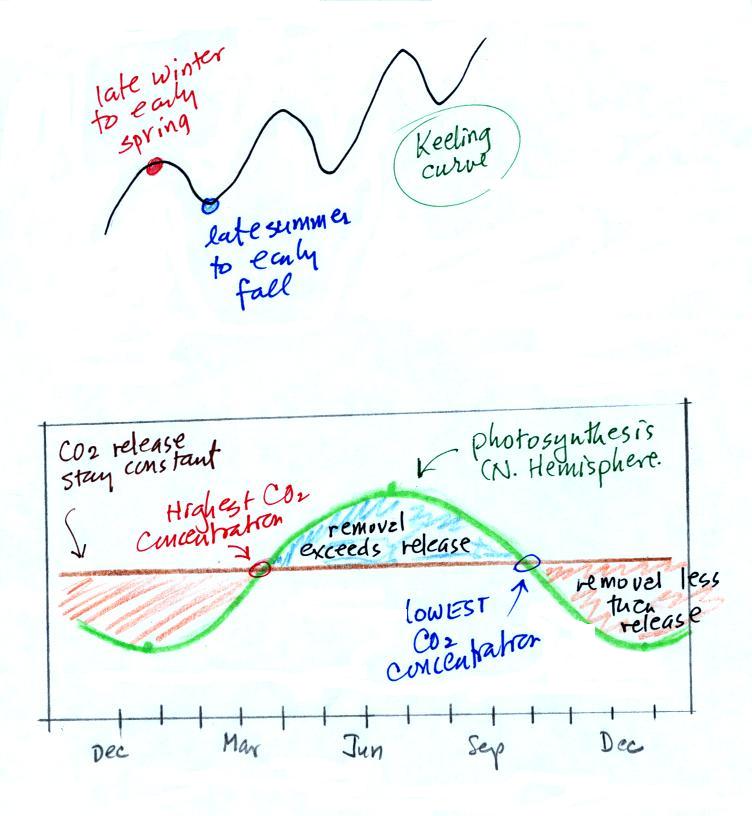
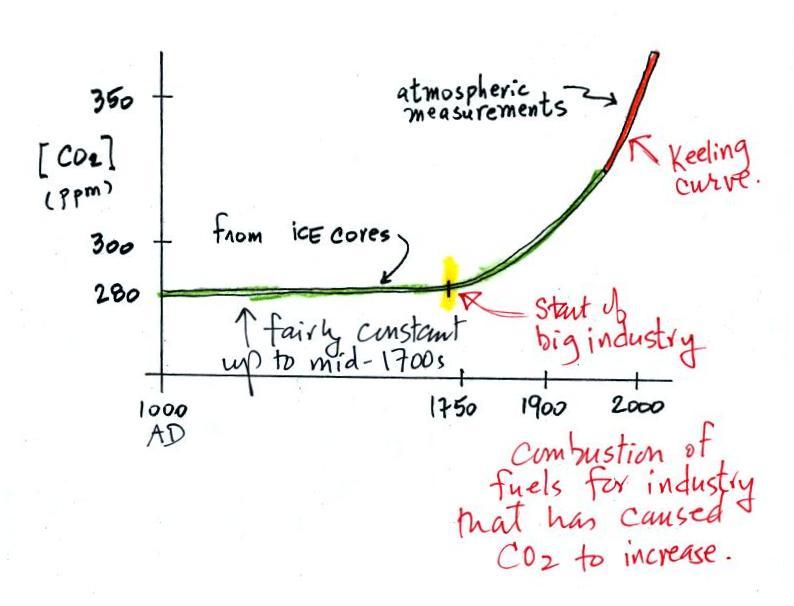
The green portion of this curve shows    determined from the ice cores.  The more 
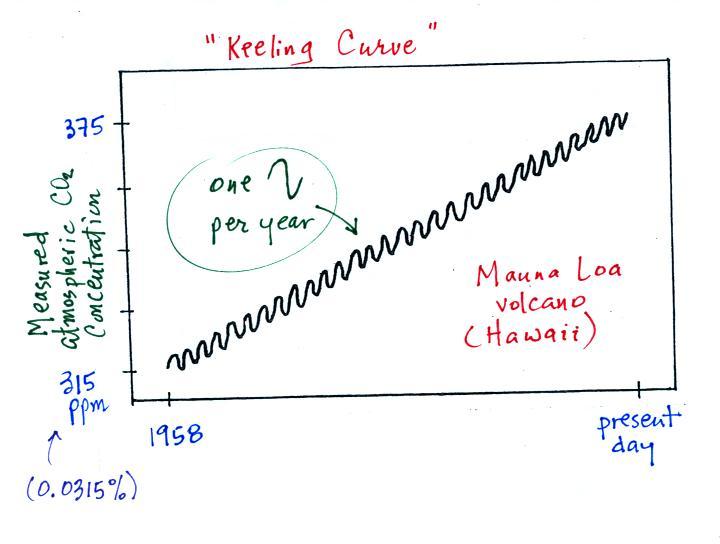
recent Keeling curve measurements are shown in red at the right end of 
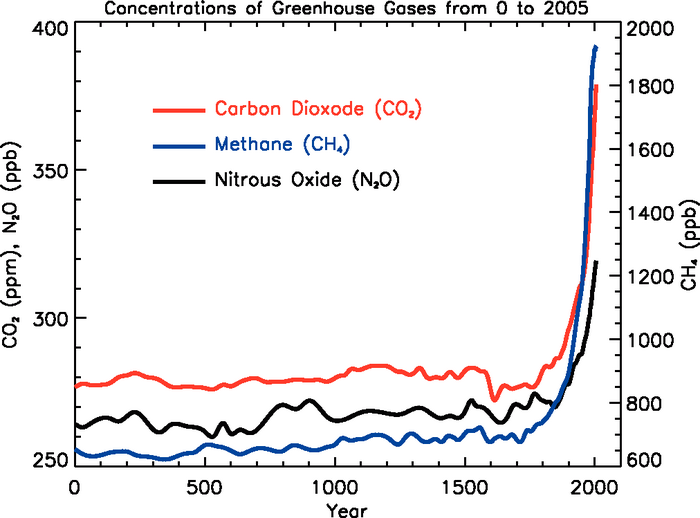
the curve.  Atmospheric CO2 concentration was fairly constant at about 280 ppm between 1000 AD and the mid-1700s when it started to increase.  The start of rising CO2 coincides with the beginning of the "Industrial Revolution."  Combustion of fossil fuels needed to power factories began to add significant amounts of CO2 to the atmosphere.


This figure (from Climate Change 2007, IPCC 4th Assessment Report) shows that concentrations of two other greeenhouse gases, methane and nitroux oxide, have been increasing in much the same way
CO2 has. 

While most scientists attribute the current increase in CO2  to human activities, natural processes can also cause changes in atmospheric CO2 concentration.  Only several hundred years of ice core data are shown above, but the data actually extend back several hundred thousand years and CO2 concentrations vary between about 180 and 300 ppm.  The current increase is the largest and most rapid in the ice core record.  There is also a strong correlation between high CO2  concentrations and warm temperatures, though the exact cause and effect hasn't been established (i.e. it is not clear whether high CO2 amounts cause warming or whether warming caused by some other mechanism results in higher than average CO2 concentrations).

In order to understand why atmospheric carbon dioxide concentration is increasing, and before we look at what the earth's temperature has been doing during this period, we
need to know how carbon dioxide is added to and removed from the atmosphere.


Carbon dioxide is added to the atmosphere naturally by respiration (animals breathe in oxygen and exhale carbon dioxide), decay, and volcanoes. 

Combustion of fossil fuels, a human activity also adds CO2 to the atmosphere.  Deforestation, cutting down and killing a tree will keep it from removing CO2 from the air by photosynthesis.  The dead tree will also decay and release CO2 to the air.

CO2 is removed from the atmosphere by photosynthesis (the equation is shown above, its kind of the opposite of combustion).  CO2 also dissolves in the oceans.

The ? means your instructor is not aware of an anthropogenic process that removes significant amounts of carbon dioxide from the air.
  Though carbon sequestration (the capture/removal of
CO2 from the air and storage) is something that is being considered to lessen or prevent global warming.

We are now able to better understand the yearly variation in atmospheric CO2 concentration (the "wiggles" on the Keeling Curve).

We assume that the release of CO2 to the air remains constant throughout the year (the straight, horizontal, brown line above).  Photosynthesis (the green curve) will change.  Photosynthesis is highest in the summer when plants are growing actively.  It is lowest in the winter when many plants are dead or dormant. 

Atmospheric
CO2  concentration will decrease as long as the rate of removal (photosynthesis) is greater than the rate of release (blue shaded portion above).  Your bank account balance will drop as long as you spend more money than you deposit.  The minimum occurs at the right end of the blue shaded portion where removal once again equals release.

The
CO2  concentration will increase when release exceeds removal (red shaded section).  The highest CO2 concentration occurs at the right end of the red shaded portion.


To really understand why human activities are causing atmospheric CO2 concentration to increase we need to look at the relative amounts of CO2 being added to and being removed from the atmosphere (like amounts of money moving into and out of a bank account and their effect on the account balance).  A simplified version of the carbon cycle is shown below. 


The carbon cycle show movement of carbon into and out of the atmosphere or ocean.

Here are the main points to take from this figure:

1.   
The underlined numbers show the amount of carbon stored in "reservoirs."  For example 760 units* of carbon are stored in the atmosphere (predominantly in the form of CO2, but also in small amounts of CH4 (methane), CFCs and other gases; anything that contains carbon).  Note that the atmosphere is a fairly small reservoir.

    The other numbers show "fluxes," the amount of carbon moving into or out of the various reservoirs ( actually just into and out of the atmosphere ).  Over land, respiration and decay add 120 units* of carbon to the atmosphere every year.  Photosynthesis (primarily) removes 120 units every year.

2.    Note the natural processes (color coded blue and green) are pretty much in balance (over land: 120 units added to the atmosphere and 120 units removed, over the oceans: 90 units added balanced by 90 units of carbon removed from the atmosphere every year). If these were the only processes present, the atmospheric concentration (760 units) wouldn't change.

3.   
Anthropogenic (man caused) emissions of carbon into the air are small compared to natural processes (orange in the figure).  About 6.4 units are added during combustion of fossil fuels (and during the manufacture of cement) and 1.6 units are added every year because of deforestation (when trees are cut down they decay or are burned and add CO2 to the air, also because they are dead they aren't able to remove CO2 from the air by photosynthesis)

The rate at which carbon is added to the atmosphere by man is not balanced by an equal rate of removal: about half (4.6 of the 8) units added every year are removed (highlighted in yellow in the figure). 

This small imbalance (8 - 4.6 = 3.6 units of carbon are added to the atmosphere every year) explains why atmospheric carbon dioxide concentrations are increasing with time.
  Note also that more carbon dioxide is added to the oceans every year than is removed.  Addition of CO2 to the oceans might increase the acidity of the ocean water which might might make it more difficult for coral and sea shells to form (shells and coral are made of calcium carbonate CaCO3).

4.   
In the next 100 years or so, the 7500 units or so of carbon stored in the fossil fuels reservoir (lower left hand corner of the figure) might be dug up or pumped out of the ground and burned.  That would add 7500 units of carbon to the air.  The big question is how will the atmospheric concentration change and what effects will that have on climate?  Carbon dioxide can move into and out of the atmosphere fairly quickly, movement into and out of some of the other reservoirs is slow.  Thus it is difficult to say precisely how and how quickly the picture will change when it is perturbed.

*don't worry about the units.  But here they are just in case you are interested:
 Reservoirs - Gtons
 Fluxes - Gtons/year
 A Gton = 1012 metric tons. (1 metric ton is 1000 kilograms or about 2200 pounds)


This was as far as we got in class on Monday.  Here's a brief summary of where we're at.
Atmospheric CO2 concentration was fairly constant between 0 AD and the mid 1700s.
CO2 concentration has been increasing since the mid 1700s.
The obvious question is what has the temperature of the earth been doing during this period? 
In particular has there been any warming associated with the increases in greenhouse gases that have occurred since the mid 1700s?

We'll address that question on Friday.  We'll find that temperatures have been accurately measured for about the past 150 years or so.  We will need to find some way of estimating temperatures prior to that.