The April
25-28,
2011
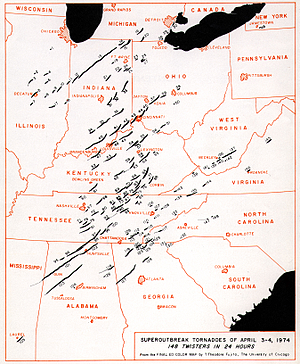
outbreak this year is now apparently the largest tornado outbreak
in US history (336 tornadoe, 346 people killed)
54a
|
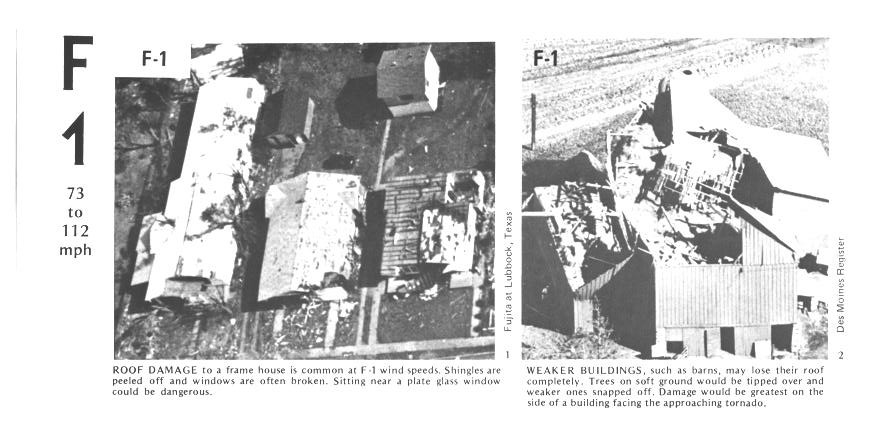
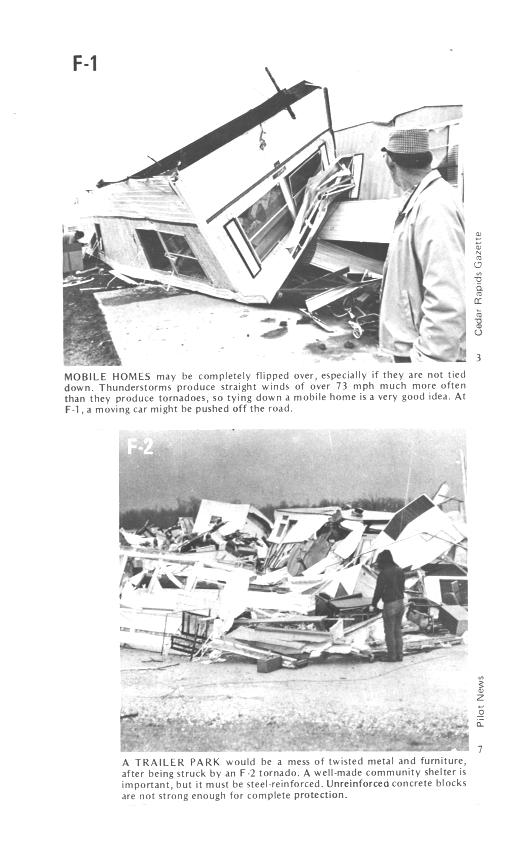
F3
|
Grand Isle, NE
(no sound)
|
Mar.
13,
1990
|
tornado
cloud is pretty
thick and vertical
|
61f
|
F3
|
McConnell
AFB KS
|
Apr.
26,
1991
|
this
is about as close to a
tornado as you're ever likely to get. Try to judge the diameter
of the tornado cloud. What direction are the tornado winds
spinning?
|
52
|
F5
|
Hesston
KS
(no sound)
|
Mar.
13,
1990
|
Watch
closely,
you may see a tree or two uprooted by the tornado winds
|
51
|
F3
|
North
Platte NE
|
Jun.
25,
1989
|
Trees
uprooted
and buildings lifted by the tornado winds
|
65
|
F1
|
Brainard
MN
|
Jul.
5,
1991
|
It's
a good
thing this was only an F1 tornado
|
57
|
F2
|
Darlington
IN
|
Jun.
1,
1990
|
Tornado
cloud
without much dust
|
62b
|
F2
|
Kansas
Turnpike
|
Apr.
26,
1991
|
It's
sometimes
hard to run away from a tornado. Watch closely you'll see a van
blown off the road and rolled by the tornado. The driver of the
van was killed!
|
47
|
F2
|
Minneapolis
MN
|
Jul.
18,
1986
|
Tornado
cloud
appears and disappears. |
The turnpike video also has a warning
that a highway underpass is actually a very dangerous place to take
shelter from a tornado. Here is some additional
information from the Norman OK office of the National Weather
Service. Slide 6 lists some of the reasons why underpasses are so
dangerous.
The figure
below (p. 162 in the ClassNotes) illustrates the life cycle of a
tornado. Have a close look at the next tornado you see on video
and see if you can determine whether it is in one of the early or late
stages of its development.
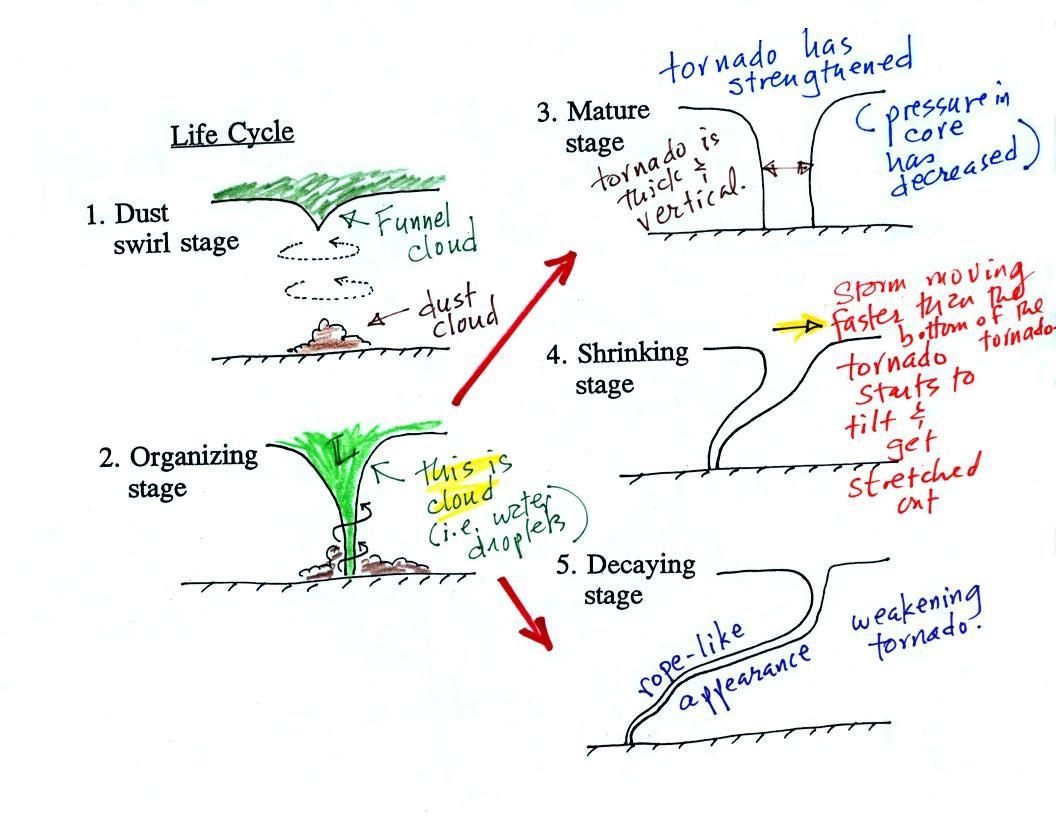
Tornadoes begin in and descend from
a
thunderstorm. You would usually see a funnel cloud dropping from
the base
of the thunderstorm. Spinning winds will probably be present
between the cloud and ground before the tornado cloud becomes
visible. The spinning winds can stir up dust at ground
level. The spinning winds might also be strong enough at this
point to produce some minor damage. Here is video of a tornado
in
Laverne
Oklahoma that shows the initial dust swirl stage very well. This video wasn't
shown in class.
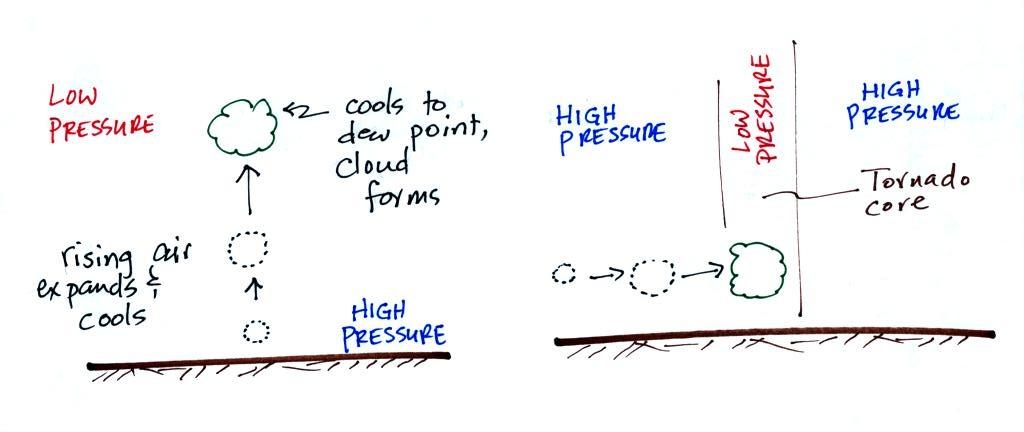
In Stage 2, moist air moves horizontally toward the low pressure
in the
core of the tornado. This sideways moving air will expand and
cool just as rising air does (see figure below). Once the air
cools enough (to the
dew point temperature) a cloud will form.
Tornadoes can go from Stage 2 to Stage 3 (this is what the
strongest
tornadoes do) or
directly from stage 2 to stage 5. Note a strong tornado is
usually vertical and thick as shown in Stage 3. "Wedge tornadoes"
actually appear wider than they are tall.
The thunderstorm and the top of the tornado will move faster than
the
surface winds and the bottom of the tornado. This will tilt and
stretch the tornado. The rope like appearance in Stage 5 is
usually a sign of a weakening (though still a dangerous) tornado.
A tornado cloud forms is mostly the same way that
ordinary
clouds do. Moist air
moves into lower pressure surroundings and expands. The expansion
cools the air. When the air cools to its dew point a cloud
forms.
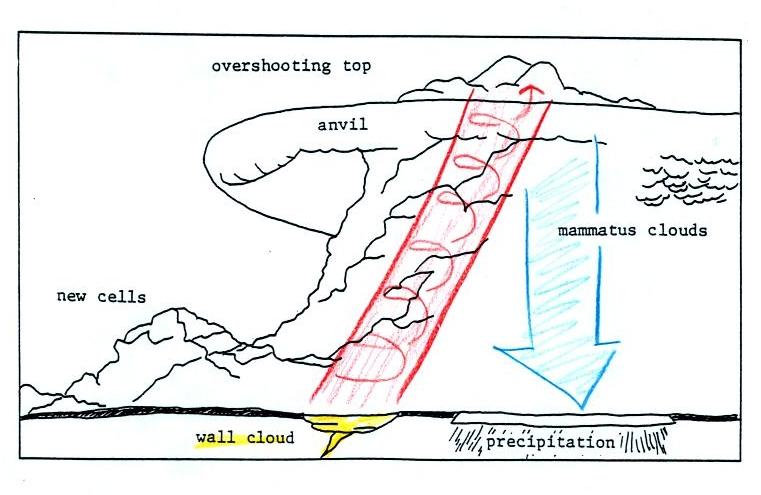
This
seemed like a good place to briefly discuss supercell thunderstorms.
Here is a
relatively simple
drawing showing some of the key features on a supercell
thunderstorm. In a supercell the
rotating
updraft (shown in red above) is strong enough to penetrate into the
stratosphere. This produces the overshooting top or dome feature
above. A wall cloud and a tornado are shown at the bottom of the mesocyclone. In an ordinary thunderstorm
the updraft
is unable to penetrate into the very stable air in the stratosphere and
the
upward moving air just flattens out and forms an anvil. The
flanking line
is a line of new cells trying to form alongside the supercell
thunderstorm.
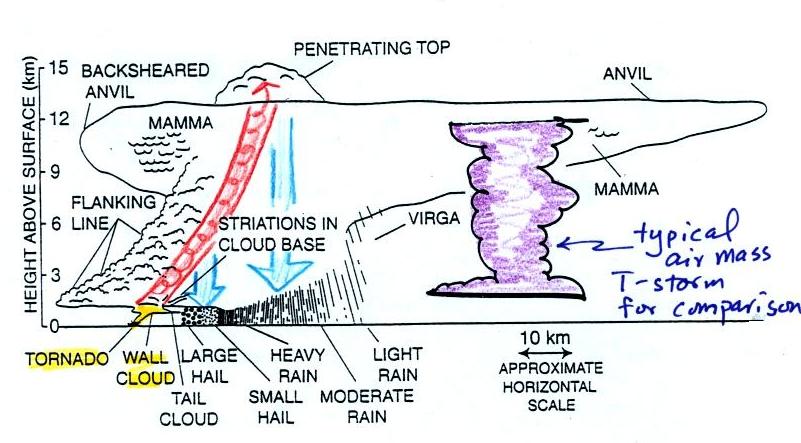
Here
is a second slightly more complicated drawing of a supercell
thunderstorm. A typical air mass thunderstorm (purple) has been
drawn in
for comparison.
A short segment
of video was shown at this point. It showed a distant supercell
thunderstorm and photographs of the bases of nearby
supercell thunderstorms. Here you could see the spectacular wall
cloud that often forms at the base of these storms. Finally a
computer simluation showed some of the complex motions that form inside
supercell thunderstorms, particularly the tilted rotating
updraft. I haven't been able to find the video online.
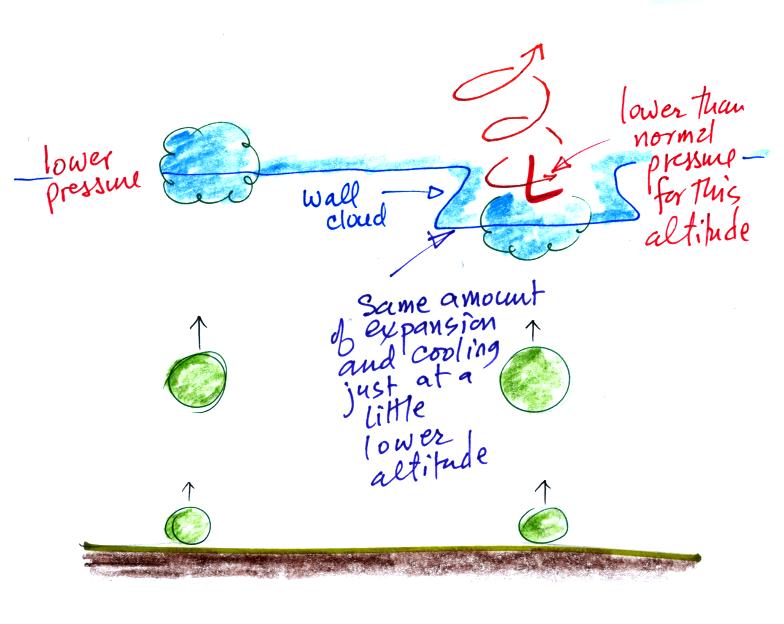
A wall cloud can form a little bit
below the rest of the base of the thunderstorm. Clouds normally
form when air
rises, expands, and cools as shown above at left. The rising air
expands because it is moving into lower pressure surroundings at higher
altitude.
At right the air doesn't have to rise to as high an altitude to
experience the same amount of expansion and cooling. This is
because it is moving into the core of the rotating updraft where the
pressure is a little lower than normal for this altitude. Cloud
forms a little bit closer to the ground.
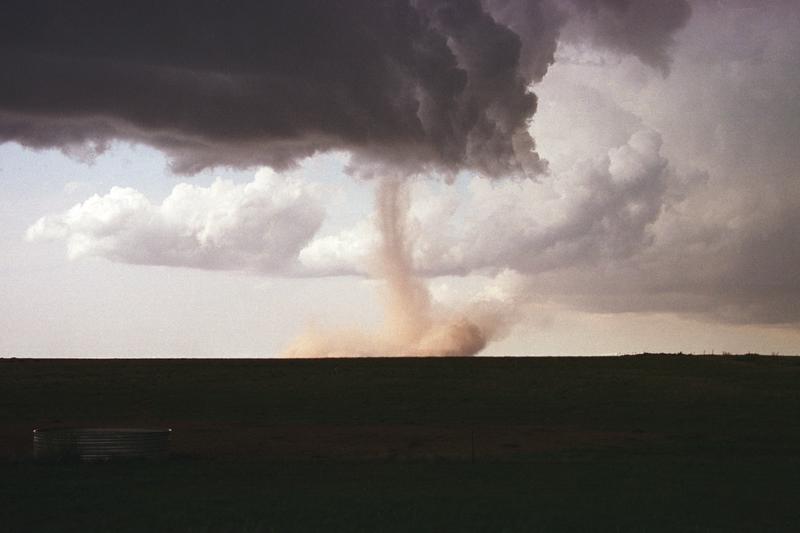
Photograph of the base of a thunderstorm showing part of the
wall cloud
and what looks like a small and weak tornado. (from
the
University
Corporation for Atmospheric Research)
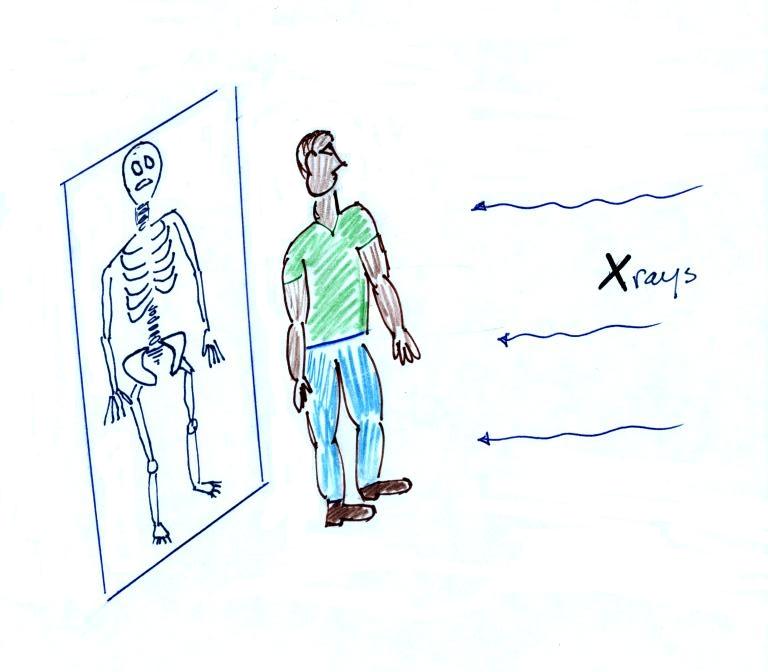
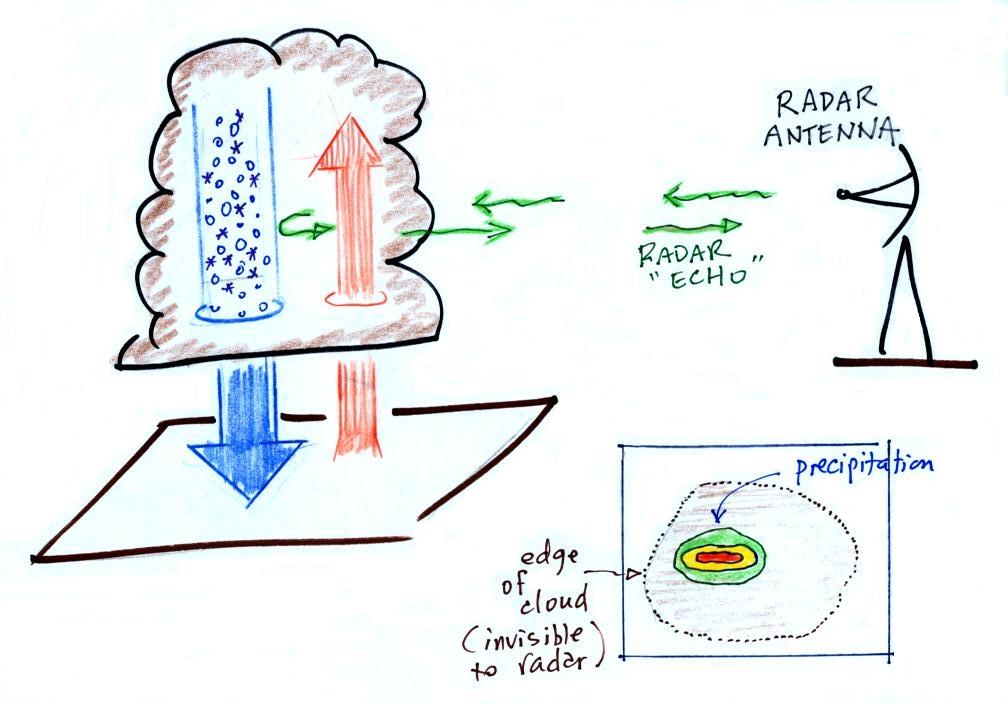
Thunderstorms
with rotating updrafts often have a distinctive radar signature called
a hook echo.
We haven't
discussed weather radar
in this class yet. In some ways a radar image of a thunderstorm
is
like an
X-ray photograph of a human body. The Xrays
pass through the flesh but are partially absorbed by bone.