Wednesday Nov. 16, 2011
click here to
download today's notes in a more printer friendly format
What I thought might qualify as rap music this afternoon from the
Flobots ("Handlebars"
and "By
the
Time
You
Get This Message")
Several additional topics have been added to 1S1P Assignment
#3. There's also a new 1S1P
Bonus
Assignment. That will
probably be it for this semester.
Please also check to see if your name is on this list of students that don't
yet have an experiment (or book or scientific paper) report
grade. If you're not currently working on something you should
check with me right away.
The Fall 2011 edition of the Toilet
Bowl
Flushing Experiment turned out really well. The results are shown
below. The bottom row shows that clockwise and counterclockwise
spinning were equally likely. The Coriolis force doesn't play any
role at all. If we had performed the experiment in the southern
hemisphere we would obtain the same result.
|
clockwise
|
counterclockwise
|
MWF class
|
27
|
31
|
T Th class
|
36
|
33
|
Totals
from both
classes
|
63
|
64
|
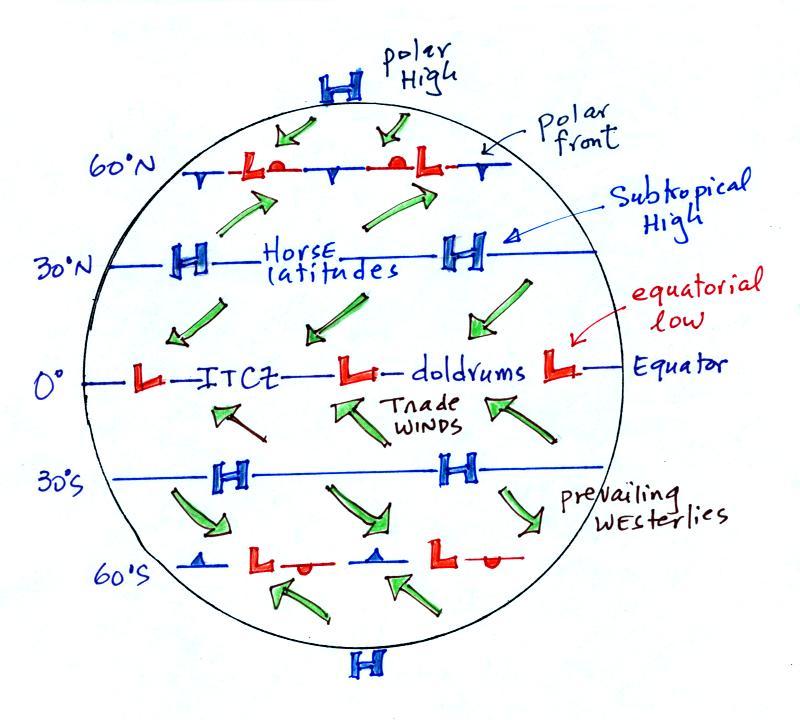
We didn't have time to cover all of
the 3-cell model features in class on Monday. I briefly
mentioned them this morning. You'll find a more detailed
description at the end of the Mon., Nov. 14 notes.
You
can
usually
see the Intertropical
Convergence Zone on this satellite
photograph. It's a band (sometimes nearly continuous other
times more segmented) of clouds near the equator.
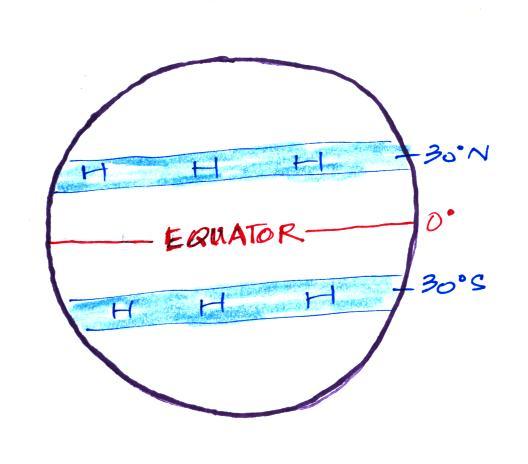
The 3-cell model
assumes that the earth is of uniform composition and not tilted toward
or away from the sun. It predicts belts of high pressure at 30 N
and 30 S latitude as shown above at left. Because the
real world
has oceans and continents we find centers of high pressure, not
belts, located
near 30 latitude. They move north and south of 30 degrees during
the year as the N. Pole tilts toward and away from the sun.
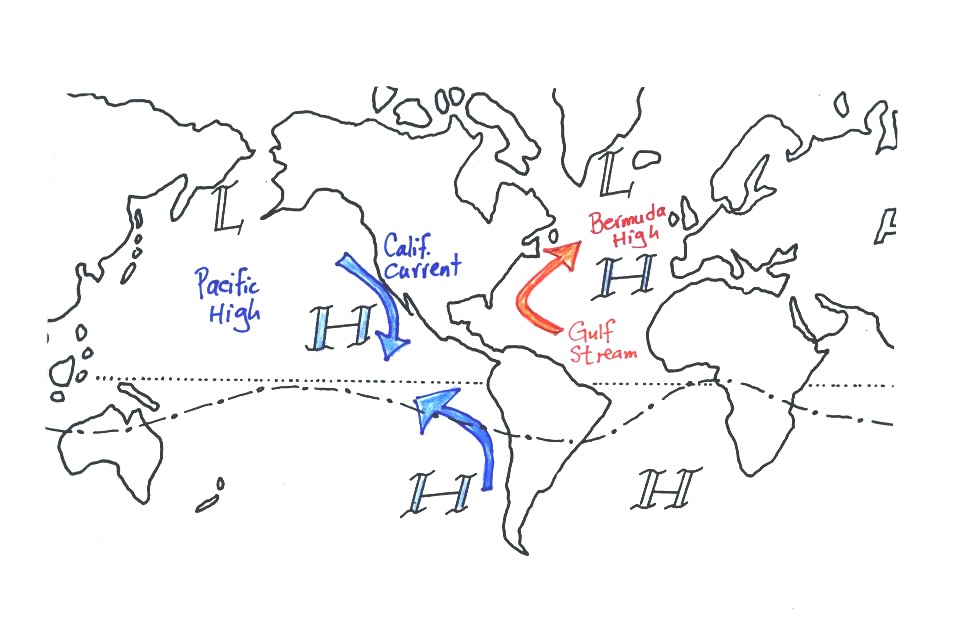
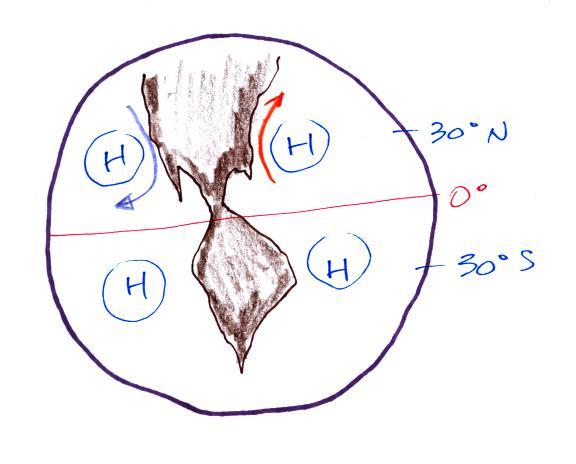
Here's a little more carefully
drawn picture. Winds blowing around these centers of high
pressure create some of the world's major ocean currents.
The California current is a cold southward
flowing current found off the west coast of the US. The Gulf
Stream is the warm northward flowing current along the east
coast.
The figure above shows the intertropical convergence zone (the dotted
dashed line) south of the Equator. This happens during the
northern hemisphere winter. A second similar figure was included
on a class handout. It showed the ITCZ north of the
Equator. That is the situation during the northern hemisphere
summer.
The subtropical high pressure centers also move north and
south of their nominal locations near 30 latitude. Movement of
these features is part of what causes our summer monsoon
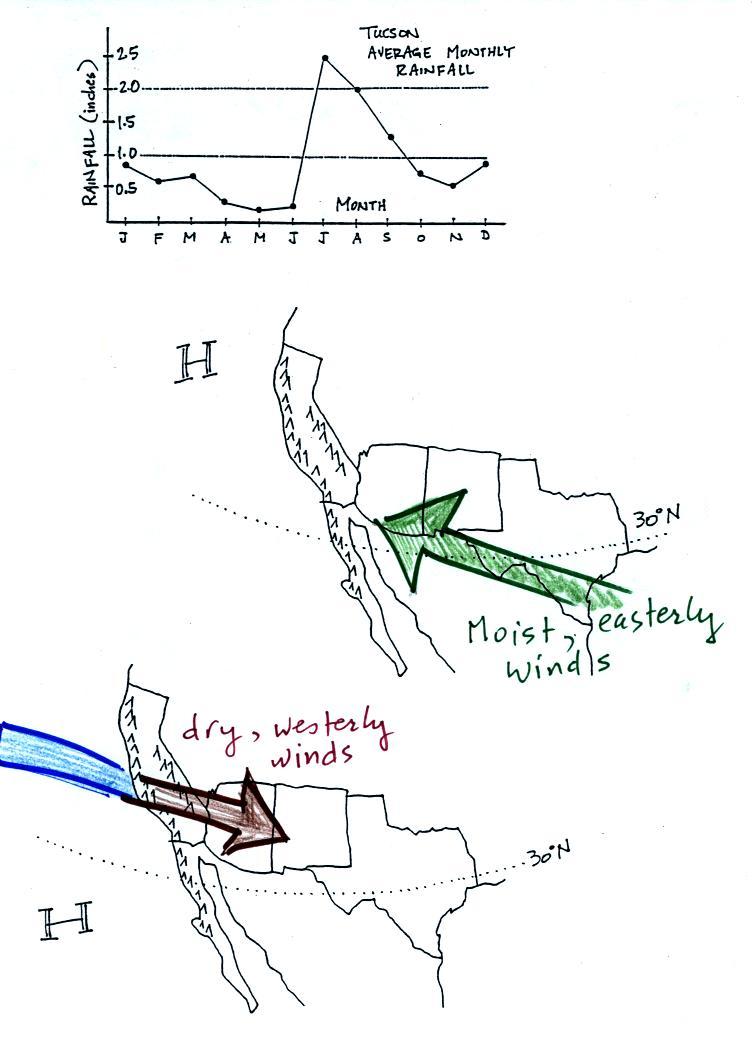
The close proximity of the Pacific high, with its sinking air motions,
is what gives California, Oregon, and Washington dry summers.
In the winter the subtropical high moves south of 30 N latitude.
Winds to the north of the high blow from the west. Air
originating over the Pacific Ocean is not as moist because the water is
colder than the Gulf of Mexico. In addition the air loses much of
its moisture as it
crosses mountains in California (remember the rain shadow
effect). The air is pretty dry by the time it reaches
Arizona. Significant winter rains occur in Arizona when storms
systems are able to draw moist subtropical air from the southwest
Pacific ocean into
Arizona.
We're next going to spend a couple of lectures on
thunderstorms. Here's a little bit of an introduction
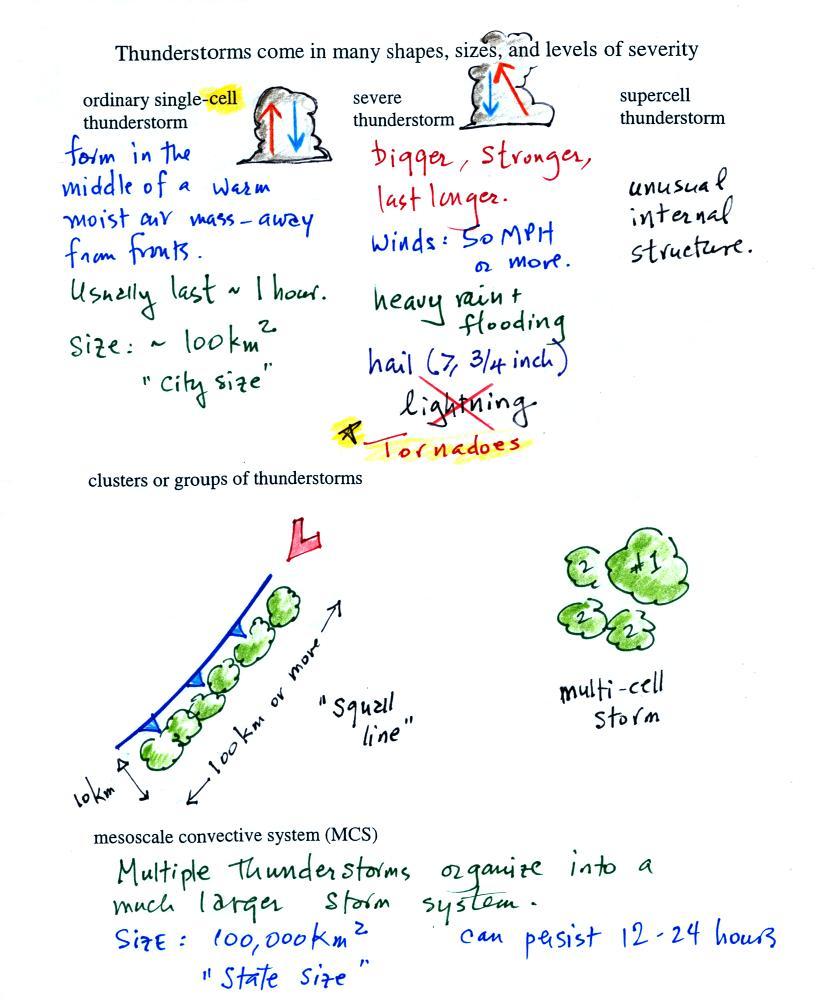
Thunderstorms come in different sizes and levels of
severity. We will mostly be concerned with ordinary
single-cell thunderstorms
(also referred to as air mass thunderstorms). Most summer
thunderstorms in Tucson are this type. An air mass
thunderstorm has a vertical updraft. A cell is just a
thunderstorm "unit."
Tilted updrafts are found in severe and supercell thunderstorms.
As we shall see this allows those storms to get bigger, stronger, and
last longer. Supercell thunderstorms have a complex internal
structure; we'll watch a short
video at some point that shows a computer simulation of the complex air
motions inside a supercell thunderstorm.
The
following somewhat tedious material was intended to
prepare you to better appreciate a time lapse video movie
of a thunderstorm developing over the Catalina mountains. I don't
expect you to remember all of the details given below. The
figures below are more carefully drawn versions of what was done in
class.
Refer back and forth between the lettered points in
the
figure
above and the commentary below.
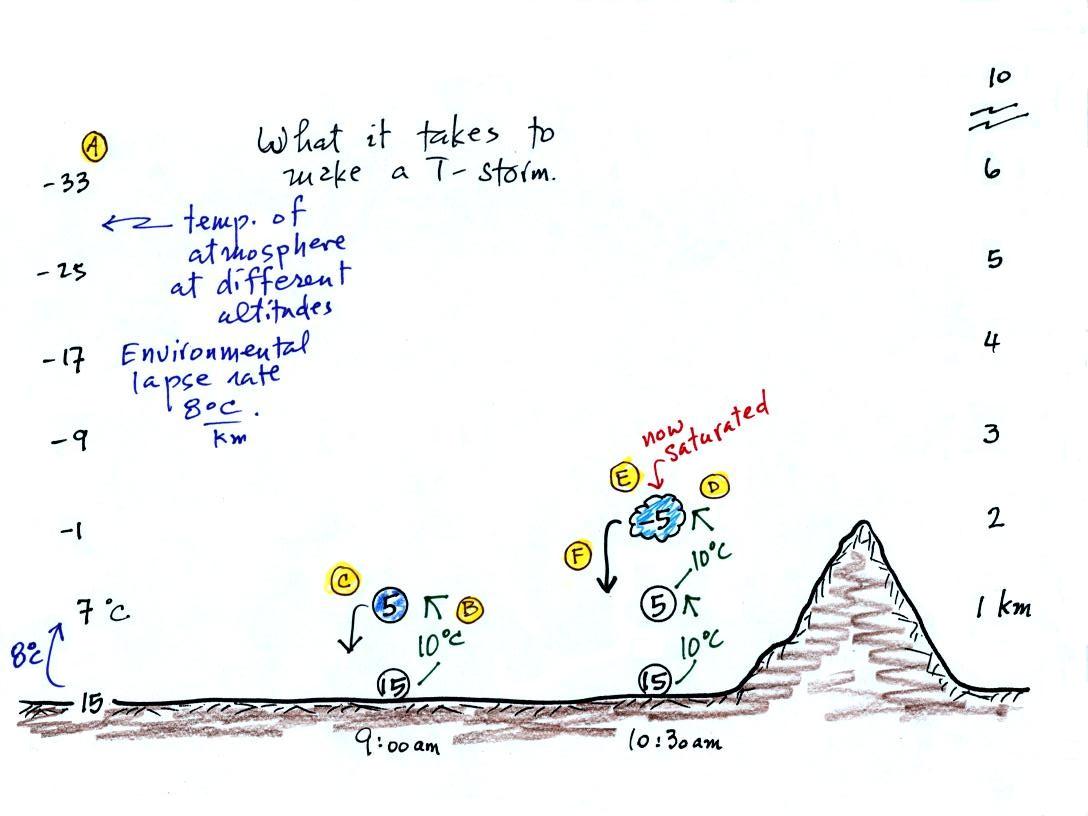
The numbers in Column A
show the temperature of the air in the atmosphere at various altitudes
above the ground (note the altitude scale on the right edge of the
figure). On this particular day the air temperature was
decreasing at a rate of 8 C per kilometer. This rate of decrease
is referred to as the environmental lapse rate (lapse rate just means
rate of decrease with altitude). Temperature could
decrease more quickly than shown here or less rapidly.
Temperature in the atmosphere can even increase with increasing
altitude
(a temperature inversion).
At Point B, some of
the surface air is put into an imaginary container, a parcel.
Then a meterological process of some kind lifts the air to 1 km
altitude (in Arizona in the summer, sunlight heats the ground and air
in contact with the ground, the warm air becomes bouyant - that's
called free convection). The
rising air will expand and cool as it is
rising. Unsaturated (RH is less than 100%) air cools at a rate of
10 C per
kilometer. So the 15 C surface air will have a temperature of 5 C
once it arrives at 1 km altitude.
"Mother Nature" lifts the parcel to 1 km and "then lets go." At Point C note that
the air inside the parcel is slightly colder than the air outside (5 C
inside versus 7 C outside). The air inside the parcel will be
denser than the air outside and the parcel will sink back
to the
ground.
By 10:30 am the parcel is being lifted to 2 km as shown at Point D. It is still
cooling 10 C for every kilometer of altitude gain. At 2 km, at Point E the
air
has
cooled
to
its
dew
point
temperature and a cloud has
formed. Notice at Point
F, the air in the parcel or in the cloud (-5 C) is still colder
and denser than the surrounding air (-1 C), so the air will sink back
to the ground and the cloud will disappear. Still no thunderstorm
at this point.
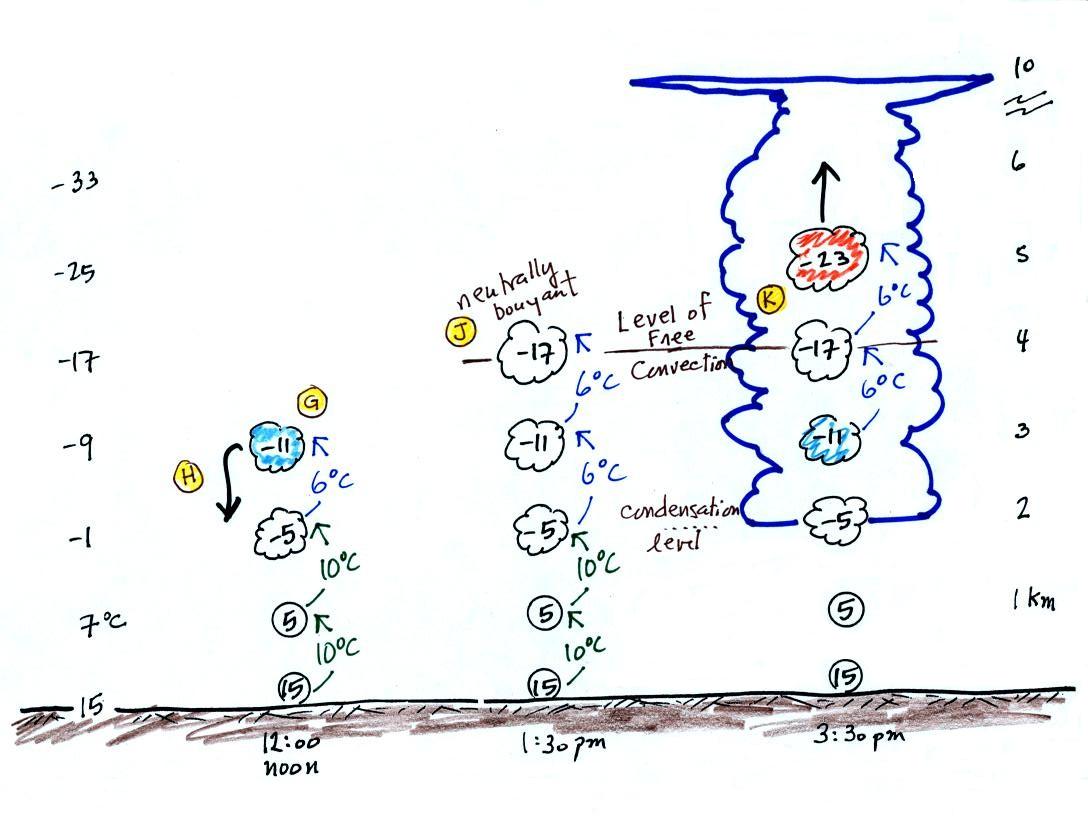
At noon, the air is lifted to 3
km. Because the
air
became saturated at 2 km, it will cool at a different rate
between 2 and
3 km altitude. It cools at a rate of 6 C/km instead of 10
C/km. The saturated air cools more slowly because release of
latent heat
during condensation offsets some of the cooling due to
expansion. The air that arrives at 3km, Point H, is again still
colder than the
surrounding air and will sink back down to the surface.
By 1:30 pm the air is getting high enough that it has become
neutrally
bouyant, it has the same temperature and density as the air around it
(-17 C inside and -17 C outside). This is called the level of
free convection, Point J in the figure.
If you can, somehow or another, lift air above the level of
free
convection it will find itself warmer and less dense than the
surrounding air as shown at Point K and will float upward to the top of
the troposphere on its own. This is really the
beginning of a thunderstorm. The thunderstorm will grow
upward
until it reaches very stable air at the bottom of the stratosphere.
This was
followed by a time lapse video tape of
actual thunderstorm formation and growth. I don't have a digital
version of that tape, so here is a
substitute time lapse of a day's worth of thunderstorm development.