Tuesday Sep. 8, 2009
click here to download today's notes
in a more printer friendly format
Three songs from The Doors today before class: "Love
Me Two
Times", "Soul Kitchen", and "Love Her Madly."
The Practice Quiz is on Thursday this week, not on Sept. 24 as the
class home page had incorrectly indicated. There are reviews
scheduled for this afternoon from 4-5 pm in Haury (Anthropology) 129
and Wednesday afternoon from 4-5 pm in FCS (Family and Consumer
Sciences) 225. It's the old FCS building on 4th St. about halfway
between Highland and Park.
You'll get the Haiku optional assignments back on Thursday most likely.
OK we'll
finish up the subject of climate change and global warming in class
today.
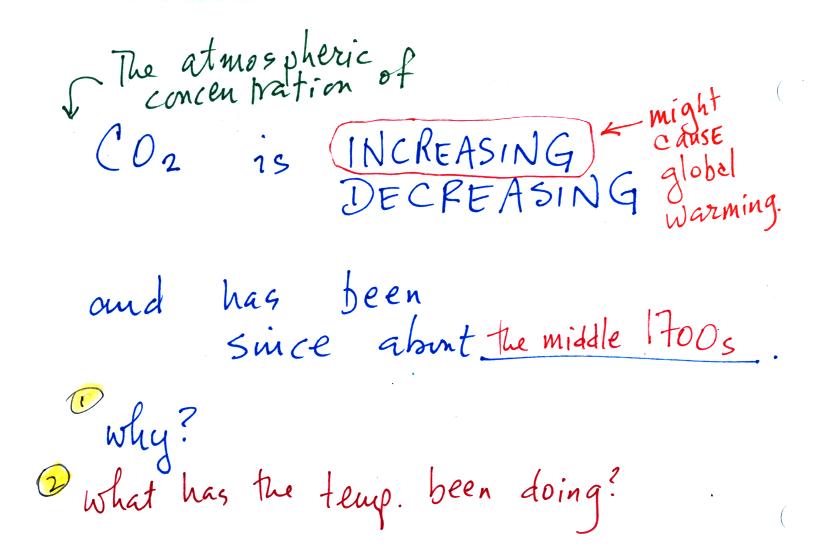
Here's where we left off last Thursday:
The atmospheric concentration of CO2 has been increasing since the
middle 1700s. Today we'll learn how humans have been able to
cause such a change. We'll
need to find out what natural and man-caused processes add CO2 to the
air and what processes remove it. Then the obvious question is
what has global average temperature been doing during this same
period. I.e. has the increase in greenhouse gas concentrations
strengthened the greenhouse effect and warmed the earth?
Here's a list of natural and
anthropogenic (man-caused) processes that release CO2 into the air and
remove it from the atmosphere.
Carbon dioxide is added
to the
atmosphere naturally by respiration (people breathe in oxygen and
exhale carbon dioxide), decay, and volcanoes (volcanoes was added after class).
Combustion of
fossil fuels, a human activity also adds CO2 to the
atmosphere. Deforestation,
cutting down and killing a tree will prevent the tree from removing CO2
from the air by photosynthesis.
The dead
tree will also decay and release CO2 to the air (the cut
trees are sometimes also burned, that's combustion again and adds CO2
to the air).
CO2 is removed from the atmosphere by photosynthesis. CO2 also
dissolves in the oceans.
The ? means your instructor is
not aware of an anthropogenic process
that removes significant amounts of carbon dioxide from the air.
This is something that people are beginning to think about and work on
(see carbon
sequestration).
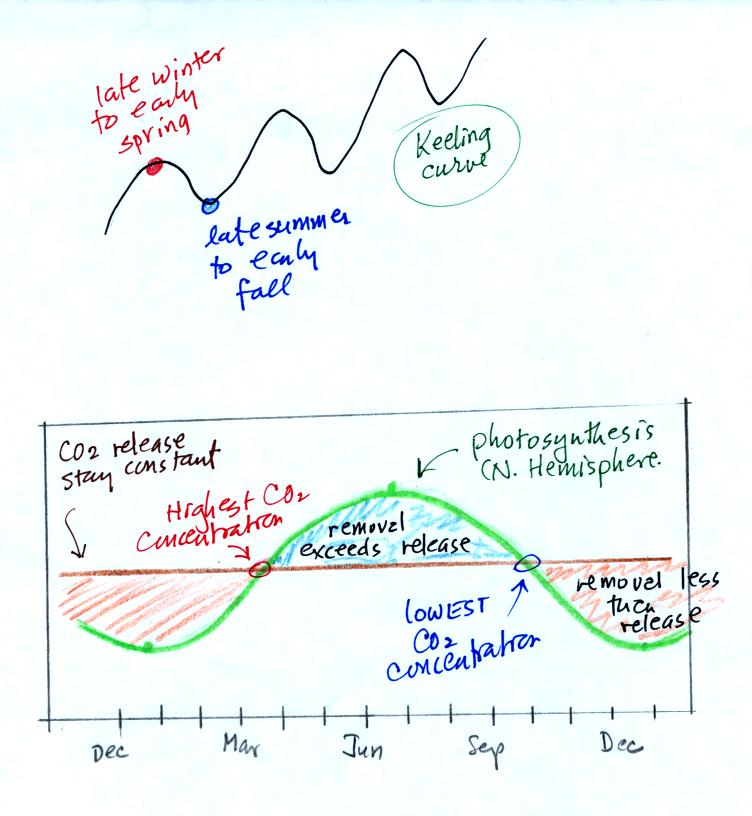
We
are now able to better understand the
yearly
variation in atmospheric CO2
concentration (the "wiggles" on the Keeling Curve).
In the bottom graph we assume that the release of CO2 to the air
remains constant throughout the year (the straight horizontal brown
line). Photosynthesis will
change. Photosynthesis is highest in the summer when plants are
growing actively. It is lowest in the winter when many plants are
dead or dormant.
Atmospheric CO2 concentration will decrease as
long as the rate of removal (photosynthesis) is greater than the rate
of release (blue shaded portion above). Your bank account balance
will drop as long as you spend more money than you deposit. The
minimum occurs at the right end of the blue shaded portion where
removal once again equals release (where the green and brown lines
intersect).
The CO2 concentration
will increase when release exceeds removal (red shaded sections).
The highest CO2 concentration occurs at the right end of the red shaded
portion.
To
really understand
why human activities are causing atmospheric CO2
concentration to
increase we need to look at the relative amounts of CO2
being added to
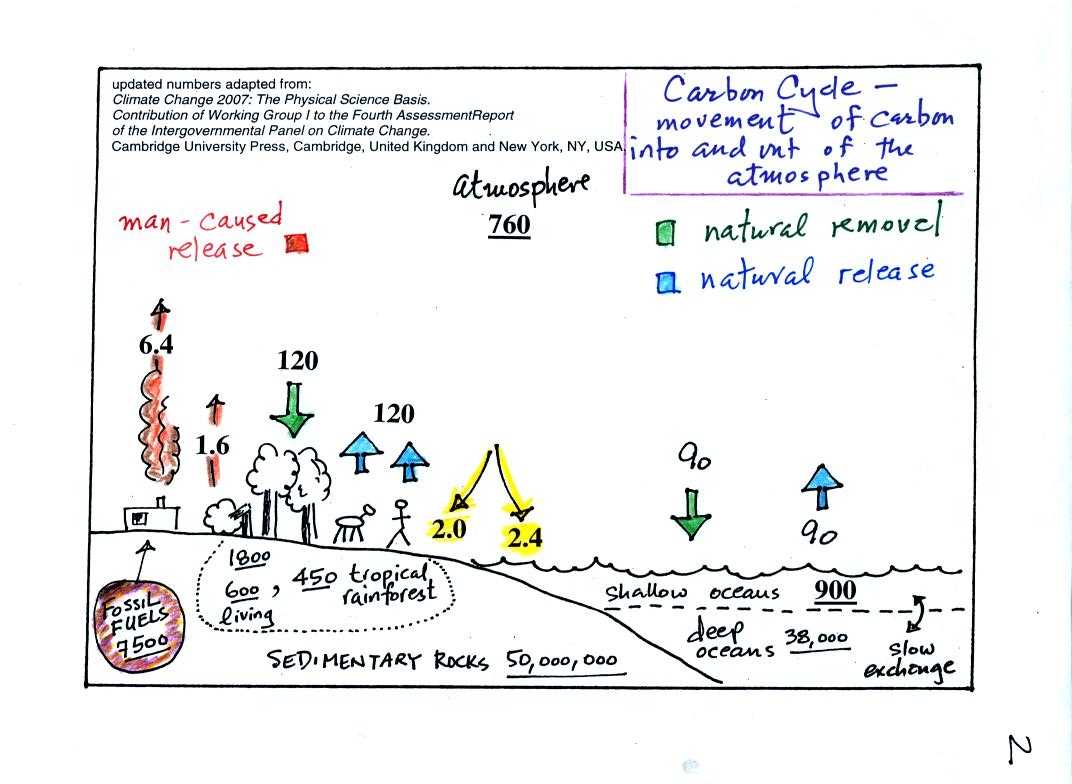
and being removed from the atmosphere. A simplified version of
the carbon cycle is shown
below (this is a little more neatly drawn version of what was done in
class)
Here are the main points to take from this figure:
1. The underlined numbers show
the amount of carbon stored in "reservoirs." For example 760
units* of carbon
are stored in the atmosphere (predominantly in the form of CO2,
but
also in small amounts of CH4 (methane),
CFCs
and other gases; anything that contains carbon). You
don't need to remember the actual number just realize that the
atmosphere is a pretty small reservoir.
The other numbers show
"fluxes," the the rates of movement of carbon moving into or out of the
atmosphere. Over
land, respiration and decay add 120 units* of carbon
to the
atmosphere every year. Photosynthesis (primarily) removes 120
units every year.
2. Note the natural processes
are in balance (over land: 120 units added and 120 units removed, over
the oceans: 90 units added balanced by 90 units of carbon removed from
the atmosphere every year). If these were the only processes present,
the atmospheric concentration (760 units)
wouldn't change.
3. Anthropogenic (man caused) emissions
of
carbon into the air are small compared to natural processes. About
6.4 units are added during combustion of fossil fuels and 1.6
units are added every year because of deforestation.
The rate at which carbon is added to the atmosphere by man is not
balanced by an equal rate of removal: 4.4 of the 8 units added every
year are removed (highlighted in yellow in the figure). This
small imbalance (8 - 4.4 = 3.6 units of carbon are left in the
atmosphere every year) explains why
atmospheric carbon dioxide concentrations are increasing with time.
4. In the next 100 years or so,
the 7500 units of carbon stored in the fossil fuels reservoir (lower
left
hand corner of the figure) might be dug up or pumped out of the ground
and burned. That will add 7500 units of carbon to the air.
The big
question is how will the atmospheric
concentration change and what effects will that have on climate?
*don't worry about the units. But here they are
just in case you are interested:
Reservoirs - Gtons
Fluxes - Gtons/year
A Gton = 1012 metric tons. (1 metric ton is 1000
kilograms or
about 2200
pounds)
So
here's where we're at in
our discussion
of climate change and global warming:
Atmospheric CO2 concentration was fairly constant between
1000 AD and
the mid
1700s.
CO2 concentration has been increasing since the
mid
1700s (other greenhouse gas concentrations have also been
increasing).
The concern is that this might enhance or strengthen
the
greenhouse effect and cause global warming.
The obvious question is what has
the temperature of the earth been doing during this period? In
particular has there been any warming associated with the increases in
greenhouse gases that have occurred since the mid 1700s?
We must address the temperature question in two parts.
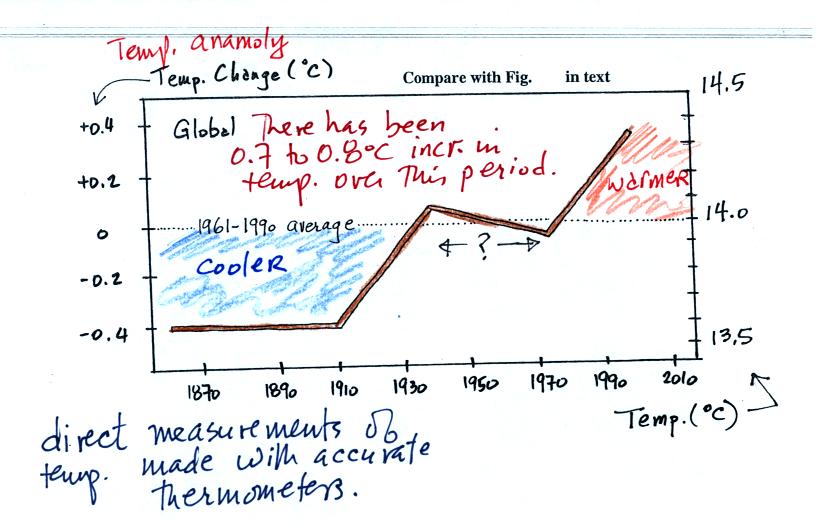
First part:
Actual accurate
measurements of temperature (on land and at sea)
This
figure is
based on actual measurements of temperature made (using reliable
thermometers)
at many locations on
land and sea around the globe. The figure shows the overall
change in global average annual surface temperature since about 1860.
Temperature appears to have
increased 0.7o to 0.8o
C during this
period. The increase hasn't been steady as you might have
expected given
the steady rise in CO2 concentration; temperature even
decreased slightly between about 1940 and 1970.
It is very difficult to detect a temperature change this small over
this period of time. The instruments used to measure temperature
have changed. The locations at which temperature measurements
have been made have also changed (imagine what Tucson was like 130
years ago). About 2/3rds of the earth's surface is ocean and
measurements were pretty sparce (sea surface temperatures can now be
measured using satellites). Average
surface temperatures naturally change a lot
from year to year.
The year to year variation has been left out
of the figure above so that the overall trend could be seen more
clearly. The figure below does show the year to year variation
(dotted black line) and
the uncertainties (green bars, note how the uncertainty is lower in
recent years) in the yearly measurements.
These data are from the NASA Goddard
Institute for Space Studies site.
Temperatures here are
compared to the 1951-1980 mean.
Temperatures prior to about 1930
were colder than the 1951-1980 mean and temperatures after 1980 were
warmer.
Here's another plot of global temperature change over a
slightly longer
time period from a different research group.
These data are from the University
of East
Anglia Climatic Research Unit
The overall tendency seems to be the same
in both cases.
2nd part
Now it would be interesting to
know how temperature was changing prior
to the mid-1800s. This is similar to what happened when the
scientists wanted to know what carbon dioxide concentrations looked
like prior to 1958. In that case they were able to go back and
analyze air samples from the past (air trapped in bubbles in ice
sheets).
That doesn't work with temperature.
Imagine putting some air in a bottle, sealing the bottle, putting the
bottle on a shelf, and letting it sit for 100 years. In 2109 you
could take the bottle down from the shelf, carefully remove the air,
and measure
what the CO2 concentration in the air had been in 2009 when the air was
sealed in the bottle. You couldn't, in 2109, use the air in the
bottle to determine what the temperature of the air was when it was
originally put into the bottle in 2009.
With temperature you need to use
proxy data.
You need to look for something else whose presence, concentration, or
composition depended on
the temperature at some time in the past.
Here's a proxy data example.
Let's say you want
to determine how many students are living in
a house near the university.
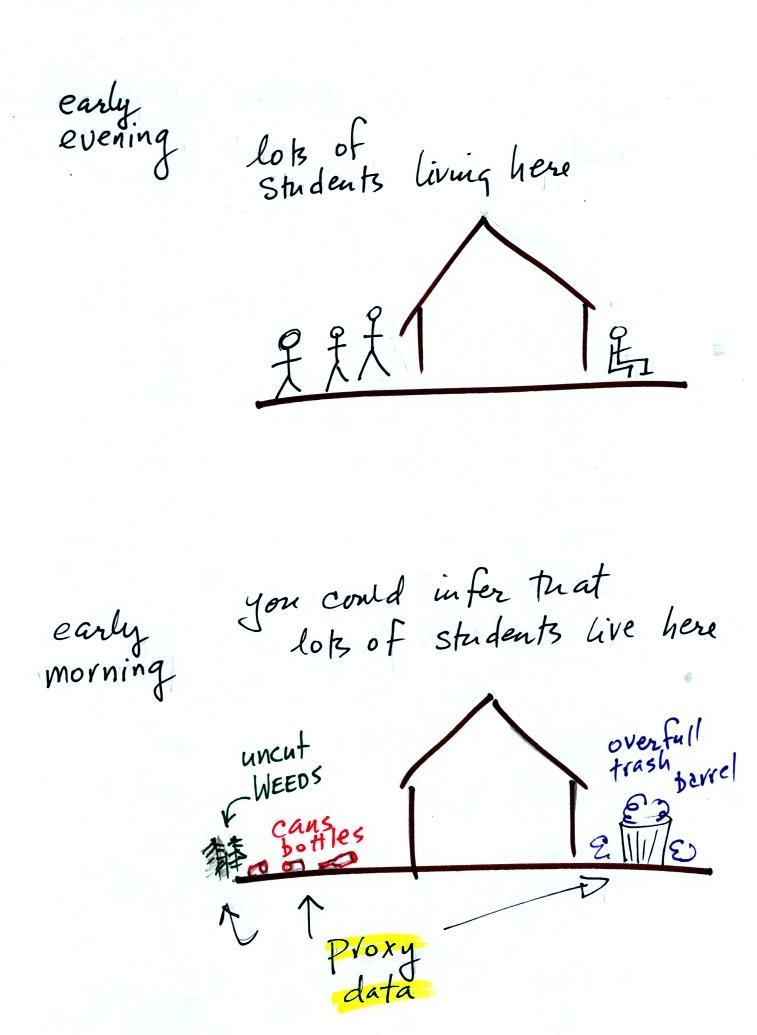
You
could walk by the house late in
the afternoon when the students might be outside and count them.
That
would be a direct measurement (this would be like measuring temperature
with a thermometer). There could still be some errors in your
measurement (some students might be inside the house and might not be
counted, some of
the people outside might not live at the house).
If you were to walk by early in the
morning it is likely that the
students would be inside sleeping (or in one of the 8 am NATS 101
classes). In that case you might
look for other clues (such as the number of empty bottles in the yard)
that might give you an idea of how many students
lived in that house. You would use these proxy data to come up
with an estimate of the number of students inside the house.
In the case of temperature scientists look
at a variety of
things. They could look at tree rings. The width of each
yearly ring depends on the depends on the temperature and
precipitation at the time the ring formed. They analyze
coral. Coral is made up of calcium carbonate, a molecule that
contains oxygen. The relative amounts of the oxygen-16 and
oxygen-18
isotopes depends
on the temperature that existed at the time the coral grew.
Scientists can analyze lake bed and ocean sediments. The types
of plant and animal fossils that they find depend on
the water temperature at the time. They can even use the ice
cores. The ice, H2O, contains oxygen and the relative
amounts of
various oxygen isotopes depends on the temperature at the time the ice
fell from the sky as snow.
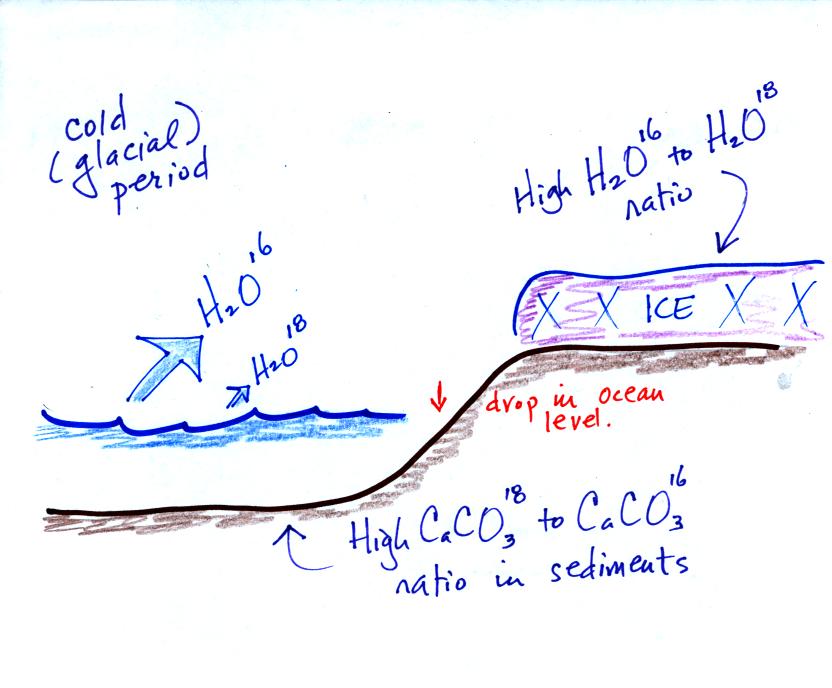
Here's an idea of how oxygen isotope data
can be used to determine past
temperature.

These
two isotopes
of
oxygen contain different numbers of neutrons in their
nuclei. Both atoms have the same number of protons.
During a cold
period,
the H2O16 form of water
evaporates more rapidly
than the H2O18 form. You would find
relatively large
amounts of O16 in glacial ice. Since most of the H2O18
remains in
the ocean, it is found in relatively high amounts in calcium carbonate
in ocean sediments. Note also the drop in ocean levels during
colder periods when much of the ocean water is found in ice sheets on
land.
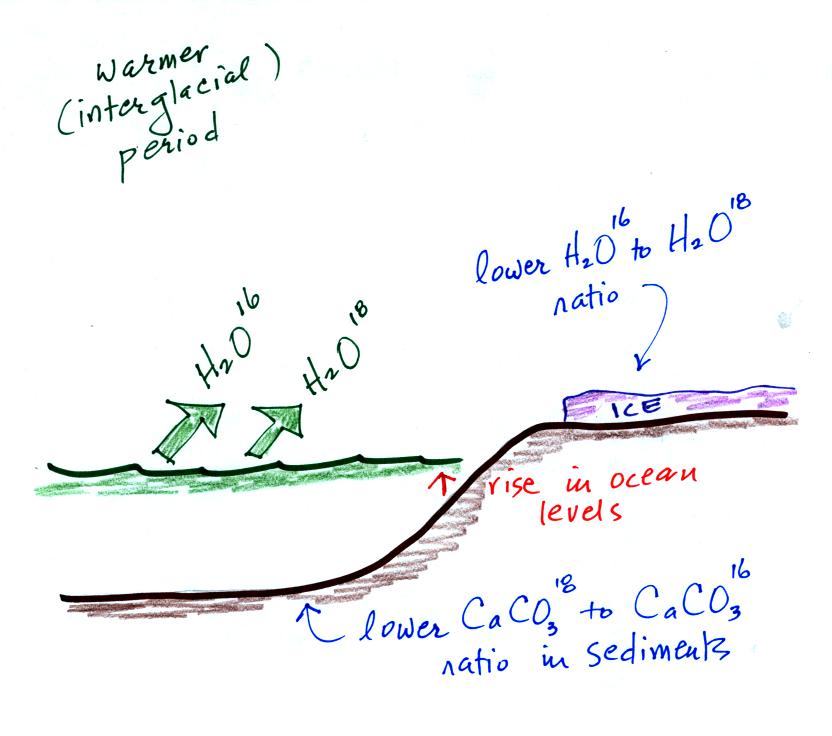
The reverse is
true
during warmer periods.
Using
proxy data
scientists have been able to estimate average
surface temperatures for 100,000s of years into the past. The
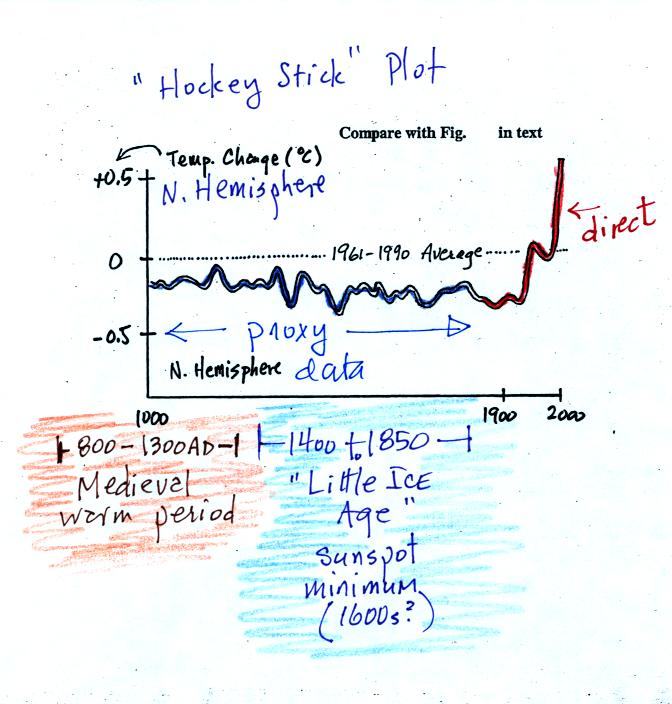
next figure (bottom of p. 3 in the photocopied Classnotes) shows what
temperature has been doing since 1000 AD.
This is for the northern hemisphere only, not the globe.
The
major portion of the figure shows the estimates of temperature (again
relative to the 1961-1990 mean) derived from proxy data. The
instrumental measurements were made between about 1850 and the present
day. There
is also a lot of year
to year variation and uncertainty that is not shown on the figure
above.
Many scientists would argue that this
graph is strong support of a
connection between rising atmospheric greenhouse gas concentrations and
global warming. Early in this time interval when CO2
concentration was constant, there is little temperature change.
Temperature only begins to rise in about 1900 when we know an increase
in atmospheric carbon dioxide concentrations was underway.
There is historical evidence in Europe of
a medieval warm period
lasting from 800 AD to - 1300 AD or so and a cold period, the "Little
Ice Age, " which lasted from about 1400 AD to the mid 1800s.
These are not clearly apparent in the temperature plot above.
This leads some scientists to question the validity of this temperature
reconstruction. Scientists also suggest that if large changes in
climate such as the Medieval warm period and the Little Ice Age can
occur naturally, then maybe the warming that is occurring at the
present time also has a natural cause.
We took a short detour at
this point to see how volcanic eruptions can sometimes cause short term
changes in climate (cooling).
Here's the figure that the sketch above
was based on
from
Climate
Change 2001 - The Scientific Basis
Contribution of Working Group I to the 3rd
Assessment Report of the
Intergovernmental Panel on Climate Change
(IPCC)
Here's a comparison of several
additional estimates of
temperature changes
over the past 1000 years or so
This is from the University of
East Anglia Climatic Research Unit again.
Some of these
curves do show a little bit more temperature variation between 1000 AD
and 1900 AD than the hockey stick plot above.
Here's
a short summary that tries to separate fact from hypothesis in the
debate over climate change:
There is general agreement that
Atmospheric CO2 and other greenhouse gas
concentrations are
increasing and that
The earth is warming
Not everyone agrees on
the Causes
of the warming (is the warming natural or being caused by human
activities),
how much Additional
Warming there will be or how quickly it will occur, and
what Effects
that warming will have on weather and
climate in the years to come
The discussion of stratospheric ozone that we started at the end
of class won't be on the Practice Quiz this week. The notes will
appear online after the Practice Quiz.