Monday Sep. 21, 2009
click here to download today's notes in
a more printer friendly format
3 or 4 songs from Pink
Martini to start class today ("Let's Never Stop
Falling in Love," "Sympathique," "Hey Eugene," and
"Lilly") if I
remember correctly. Pink Martini will be at the Rialto Theatre this coming
Friday.
The Expt. #1 reports and Optional Assignment #1 were collected
today. Here are the answers to
the Optional Assignment. Materials for Expt. #2 will be
distributed this week.
Quiz #1 is on Wednesday this week.
The final version of the Quiz #1 Study Guide
is available online. Quiz #1 will cover material on the Quiz #1
Study Guide and the Practice Quiz Study Guide.
We
quickly reviewed how cloud, temperature, dew point temperature, and
wind observations were plotted on surface weather maps using the
station model notation. You'll find that in the Friday Sep. 18 online notes.
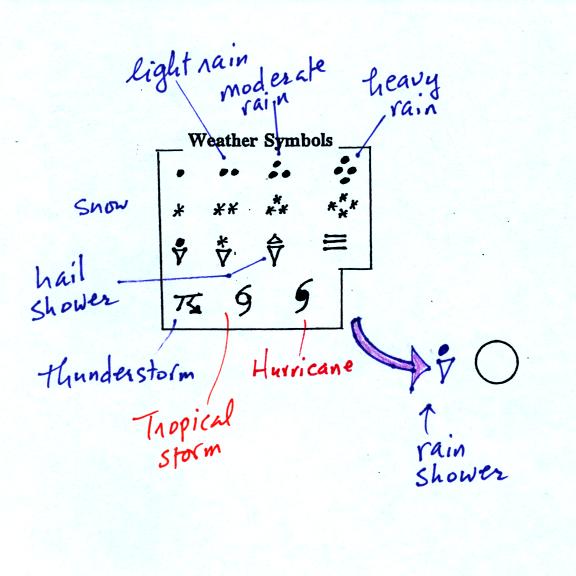
A symbol representing the weather that is currently
occurring is plotted to the left of the center circle. Some of
the common weather
symbols are
shown. There are about 100 different
weather symbols that you can choose
from (these weather symbols were on a handout distributed in class)
The sea level pressure is shown above and to the right
of
the center
circle. Decoding this data is a little "trickier" because some
information is missing.
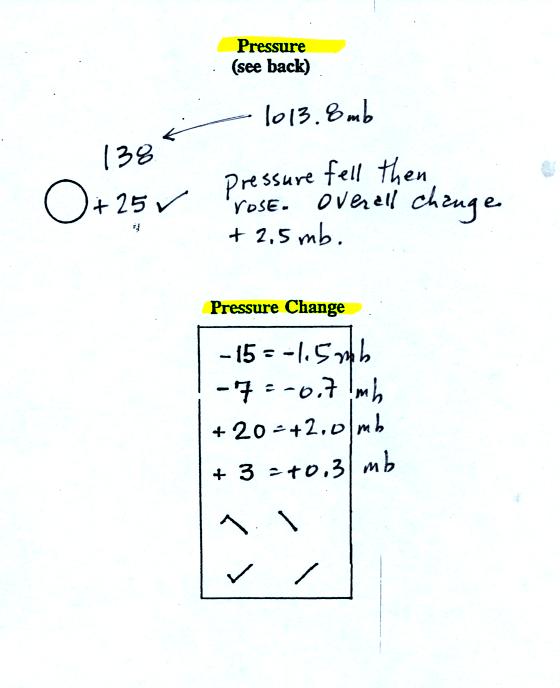
Pressure change data (how the pressure has changed during
the preceding
3 hours and not covered in class)
is shown to the right of the center circle. You must
remember to add a decimal point. Pressure changes are usually
pretty small.
Here are
some links to surface weather maps with data plotted using the
station model notation: UA Atmos. Sci.
Dept. Wx page, National
Weather Service Hydrometeorological Prediction Center, American
Meteorological Society.
We haven't
learned how to decode the pressure data yet.
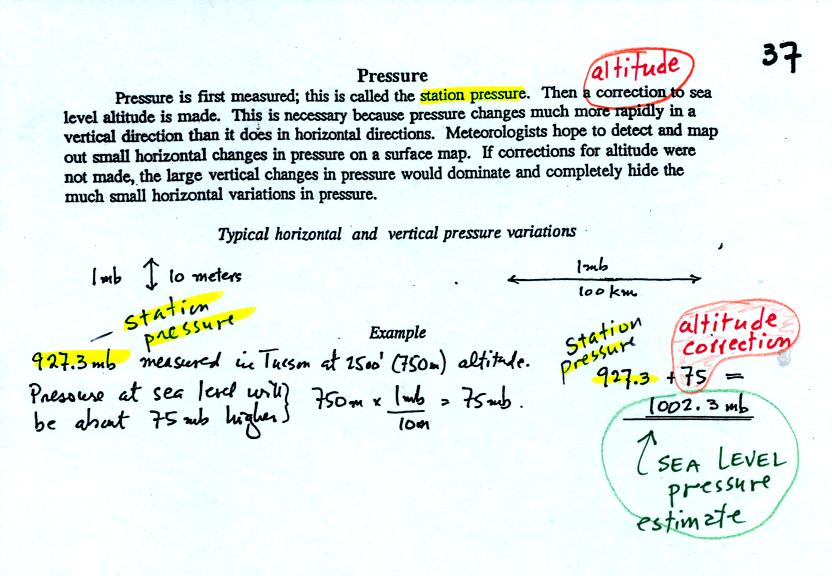
Meteorologists hope to map out small horizontal pressure
changes on
surface weather maps (that produce wind and storms). Pressure
changes much more quickly when
moving in a vertical direction. The pressure measurements are all
corrected to sea level altitude to remove the effects of
altitude. If this were not done large differences in pressure at
different cities at different altitudes would completely hide the
smaller horizontal changes.
In the example above, a station
pressure value of 927.3 mb was measured in Tucson. Since Tucson
is about 750 meters above sea level, a 75 mb correction is added to the
station pressure (1 mb for every 10 meters of altitude). The sea
level pressure estimate for Tucson is 927.3 + 75 = 1002.3 mb.
This is also shown on the figure below
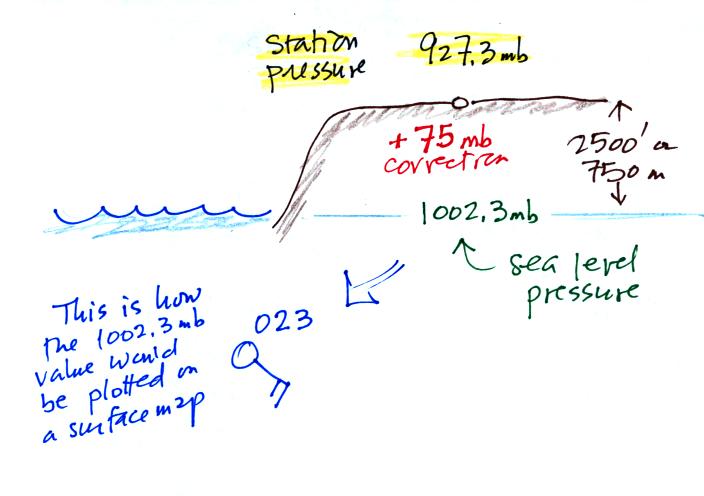
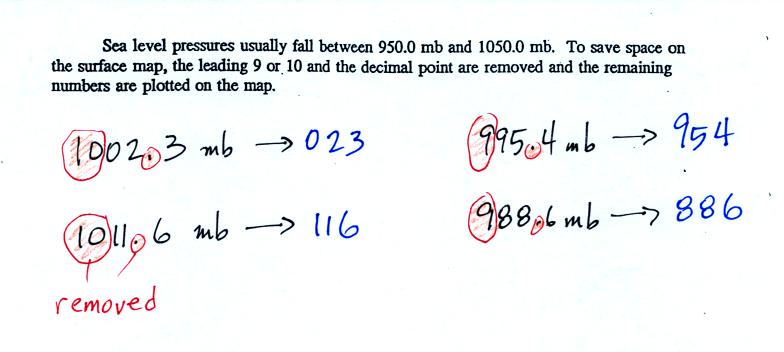
To save room, the leading 9 or 10 on the sea level pressure
value and
the decimal
point are removed before plotting the data on the map. For
example the 10 and the . in
1002.3 mb would
be removed; 023
would be plotted on the weather map (to the upper right of the center
circle). Some additional examples are shown above.
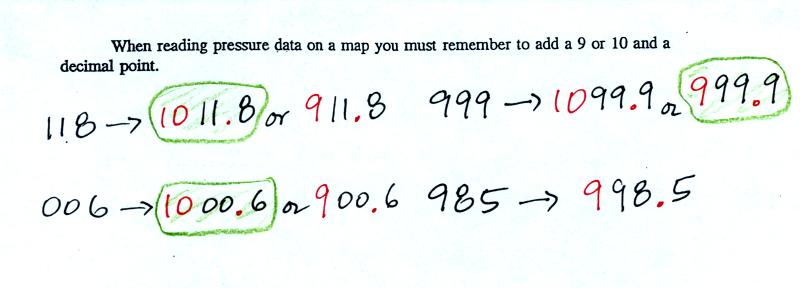
When reading pressure values off a
map you must remember to
add a 9 or
10 and a decimal point. For example
118 could be either 911.8 or 1011.8 mb. You pick the value that
falls between 950.0 mb and 1050.0 mb (so 1011.8 mb would be the correct
value, 911.8 mb would be too low).
Another
important piece of information that is included on a surface weather
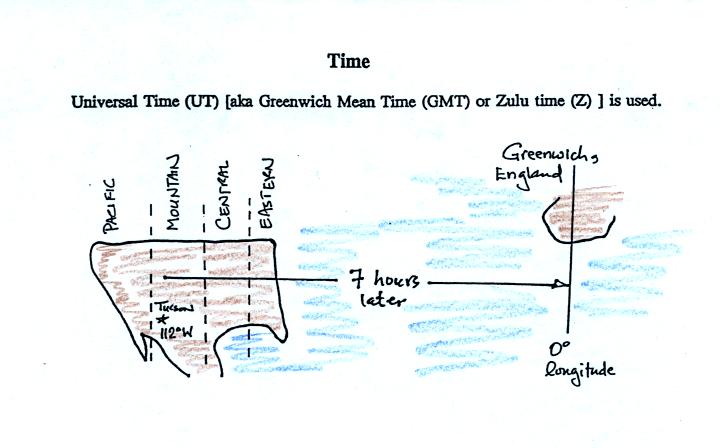
map is the time the observations were collected. Time on a
surface map is converted to a universally agreed upon time zone called
Universal Time (or Greenwich Mean Time, or Zulu time).
That is the time at 0 degrees longitude. There is a 7 hour time
zone difference between Tucson (Tucson stays on Mountain
Standard Time year round) and Universal Time. You must add 7
hours to the time in Tucson to obtain Universal Time.
Here are some examples
2:45 pm MST:
first convert 2:45 pm to the 24
hour clock format 2:45 + 12:00 = 14:45 MST
then add the 7 hour time zone correction ---> 14:45
+ 7:00 = 21:45 UT (9:45 pm in Greenwich)
9:05 am MST:
add the 7 hour time zone
correction ---> 9:05 + 7:00 = 16:05 UT (4:05 pm in England)
18Z:
subtract the 7 hour time zone
correction ---> 18:00 - 7:00 = 11:00 am MST
02Z:
if we subtract the 7 hour time
zone correction we will get a negative
number.
We will add 24:00 to 02:00 UT then subtract 7 hours
02:00 + 24:00 = 26:00
26:00 - 7:00 = 19:00 MST on the previous day
2 hours past midnight in Greenwich is 7 pm the previous day in
Tucson
We had a
little time, before the end of class, to get started on some of the
analyses of weather data that are done on surface weather maps. The following information won't be on
this week's quiz.
A bunch of weather data has been
plotted (using the station model notation) on a surface weather map in
the figure
below. 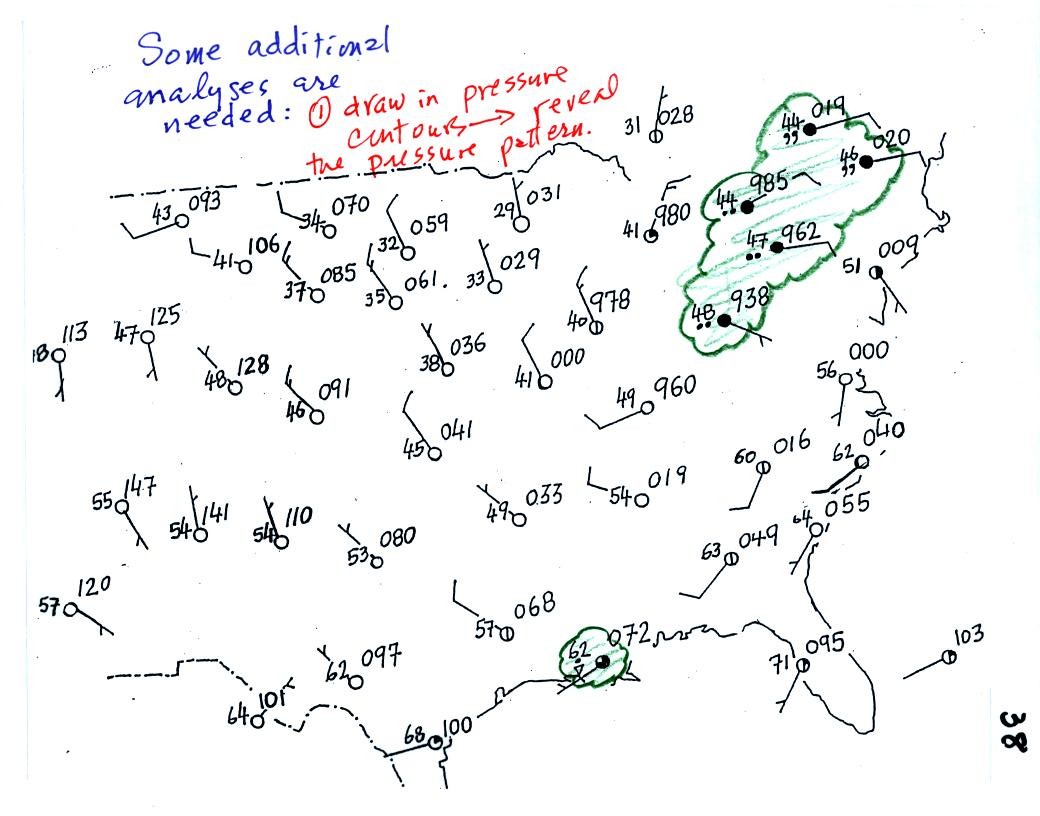
Plotting the surface weather
data
on a map is
just the
beginning.
For example you really can't tell what is causing the cloudy weather
with rain (the dot symbols are rain) and drizzle (the comma symbols) in
the NE portion of the map above or the rain
shower along the Gulf Coast. Some additional
analysis is needed. A meteorologist would usually begin by
drawing some contour lines of pressure to map out the large scale
pressure pattern. We will look first at contour lines of
temperature, they are a little easier to understand.
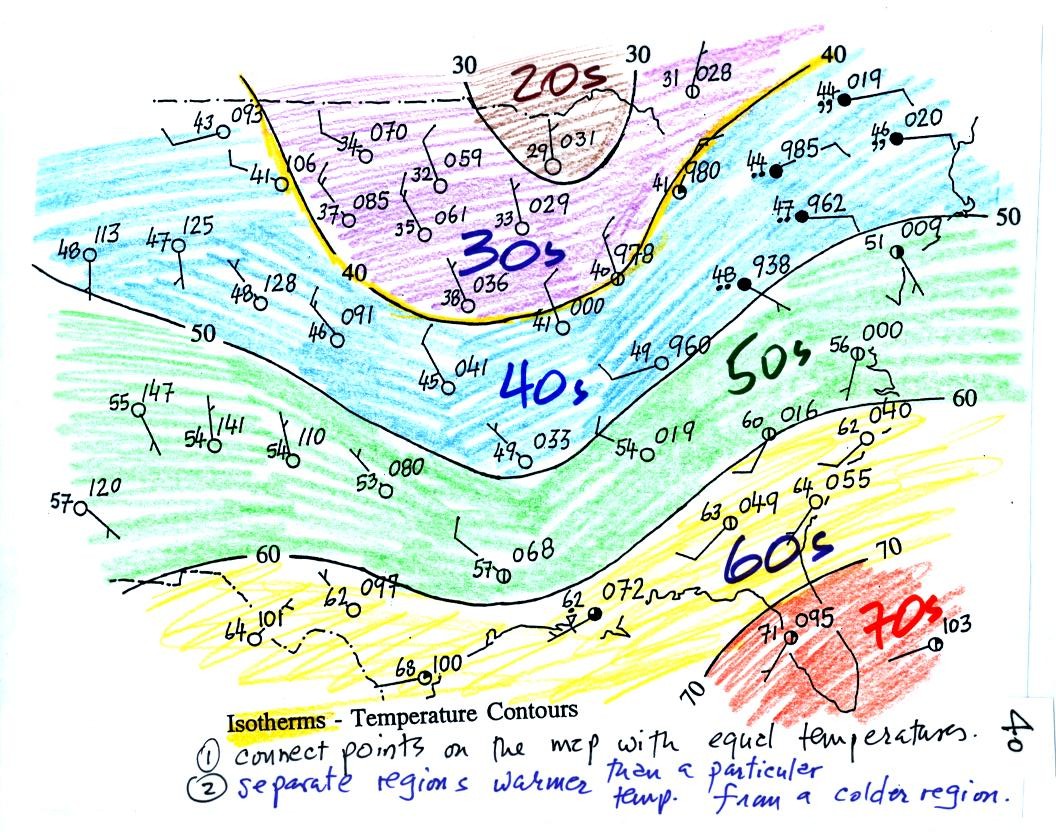
I told you I would finish coloring
the map when I got back to my office (actually this is from a previous
semester)
Isotherms, temperature
contour lines, are usually drawn at 10 F
intervals.
They do two things: (1) connect points on the map that all
have the same temperature, and (2) separate regions that are warmer
than a particular temperature from regions that are colder. The
40o F isotherm highlighted in yellow above passes through
a city which is reporting a temperature of exactly 40o.
Mostly it goes
between pairs of
cities: one with a temperature warmer than 40o and the other
colder
than 40o. Temperatures
generally decrease with
increasing
latitude: warmest temperatures are usually in the south, colder
temperatures in the north.

Now the same data with isobars
drawn in. Again they
separate
regions with pressure higher than a particular value from regions with
pressures lower than that value.
Isobars are generally drawn at 4 mb intervals. Isobars also connect points on the map
with the same pressure. The 1008 mb isobar (highlighted in
yellow) passes through a city at Point
A where the pressure is exactly
1008.0 mb. Most of the time the isobar
will pass between two
cities. The 1008 mb isobar passes between cities with
pressures
of 1009.7 mb at Point B and
1006.8 mb at Point C.
You would
expect to find 1008 mb somewhere in between
those two cites, that is where the 1008 mb isobar goes.
The pattern on this map is very different from the
pattern
of
isotherms. On this map the main features are the circular low and
high pressure centers. On Friday after the quiz we will see what
the weather is like in the vicinity of low and high pressure centers.
The following topic won't be
on this week's quiz either
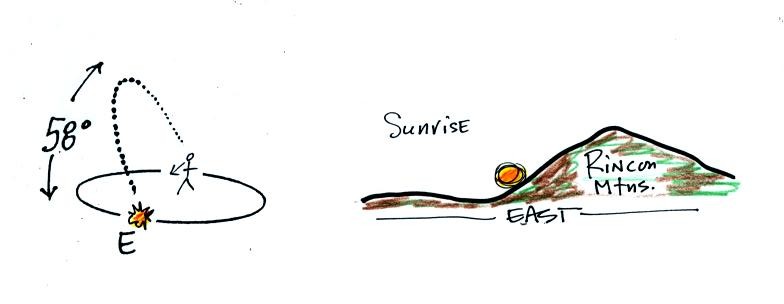
Tomorrow, Tue., Sep. 22, is the fall equinox!
On the equinoxes, the sun rises exactly in the east and
sets
exactly in the
west. The picture below shows the position of the sun at sunrise
(around 6:30 am on the spring and fall equinox in Tucson).
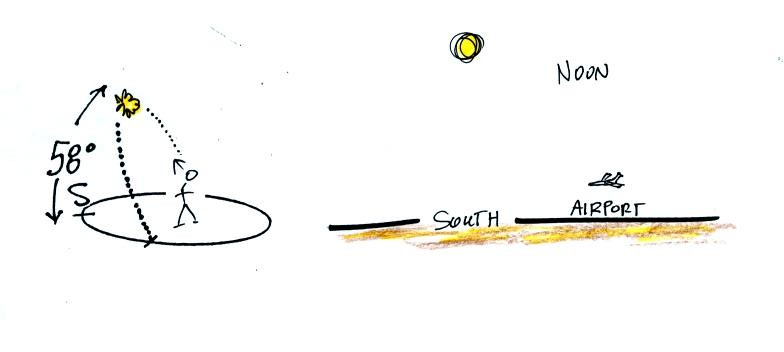
At noon you need to look about 60 degrees above the southern
horizon to see the sun
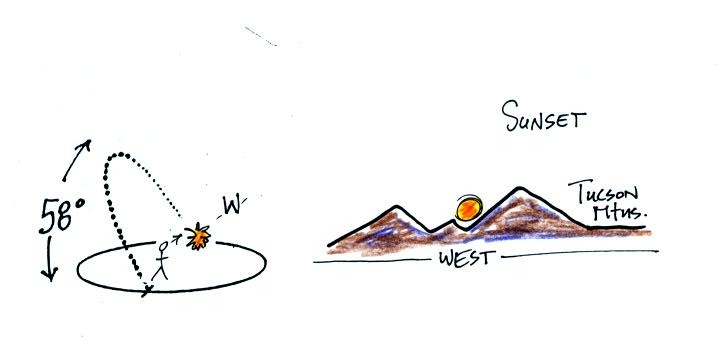
The sun sets exactly in the west at around 6:30 pm on the
equinoxes in Tucson
This is a 2 pm class
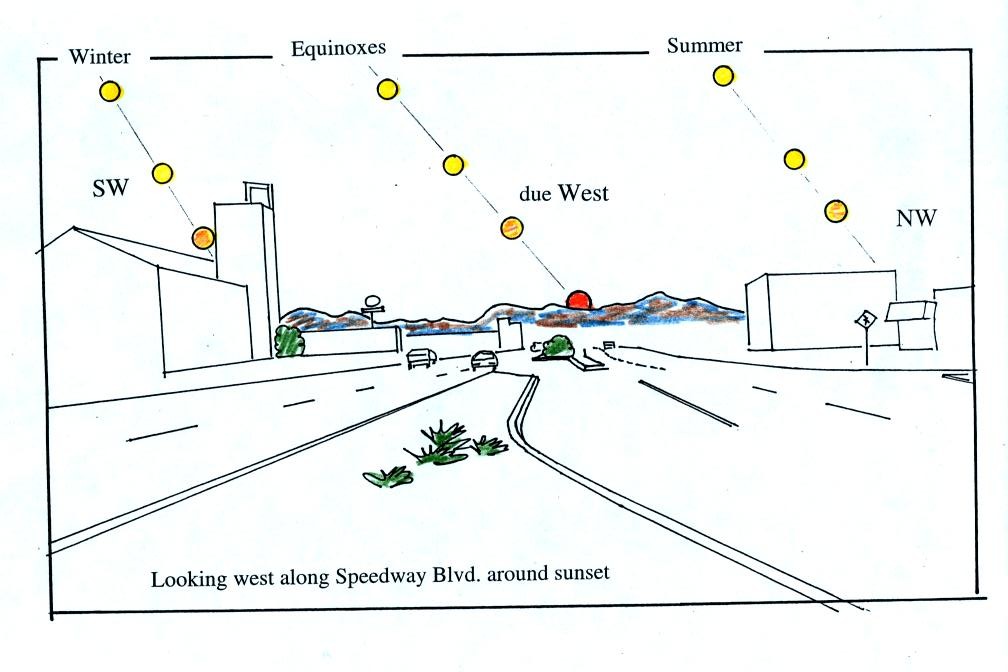
Most of you are more likely to see the sun set (perhaps) than see the
sun
rise. The figure below shows you about what you would see if you
looked west on Speedway (from Treat Ave.) at sunset. In the
winter the sun will set south of west, in the summer north of west
(probably further south and north than shown here). On the
equinoxes the sun sets exactly in the west.
If you aren't careful, you can get yourself seriously
injured, even killed,
on
or around the equinoxes. Can you figure out how
that might happen?
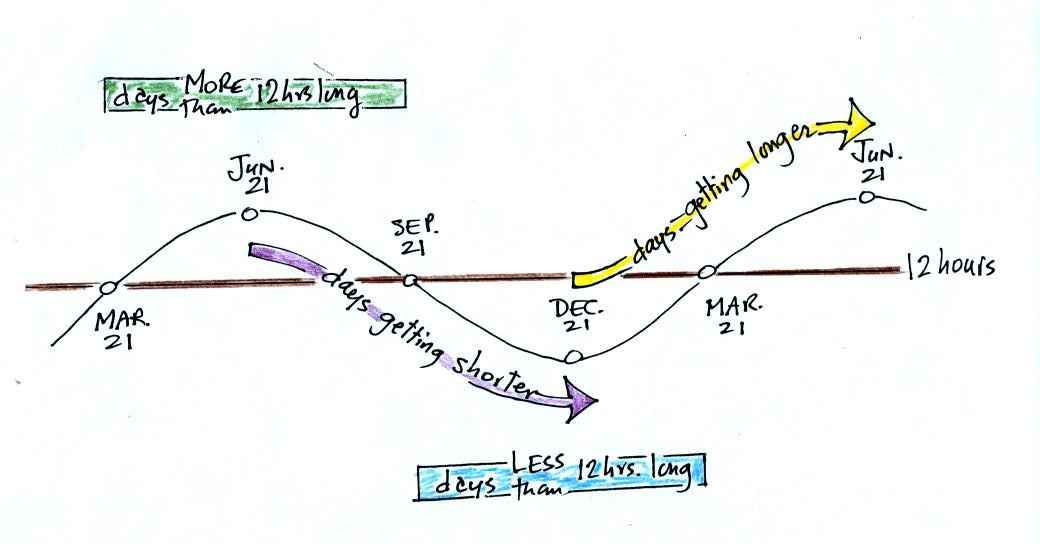
June 21, the summer solstice, is the longest day
of the
year (about 14 hours of daylight in Tucson). The days have slowly
been getting shorter all semester. This will continue up until Dec. 21,
the winter solstice, when there will be about 10 hours of
daylight. After that the days will start to shorten as we make
our way back to
the summer solstice.
The length of the day changes most rapidly on the equinoxes. The
fall equinox is on Sep. 22 this year.