![]()
![]()
![]()
![]()
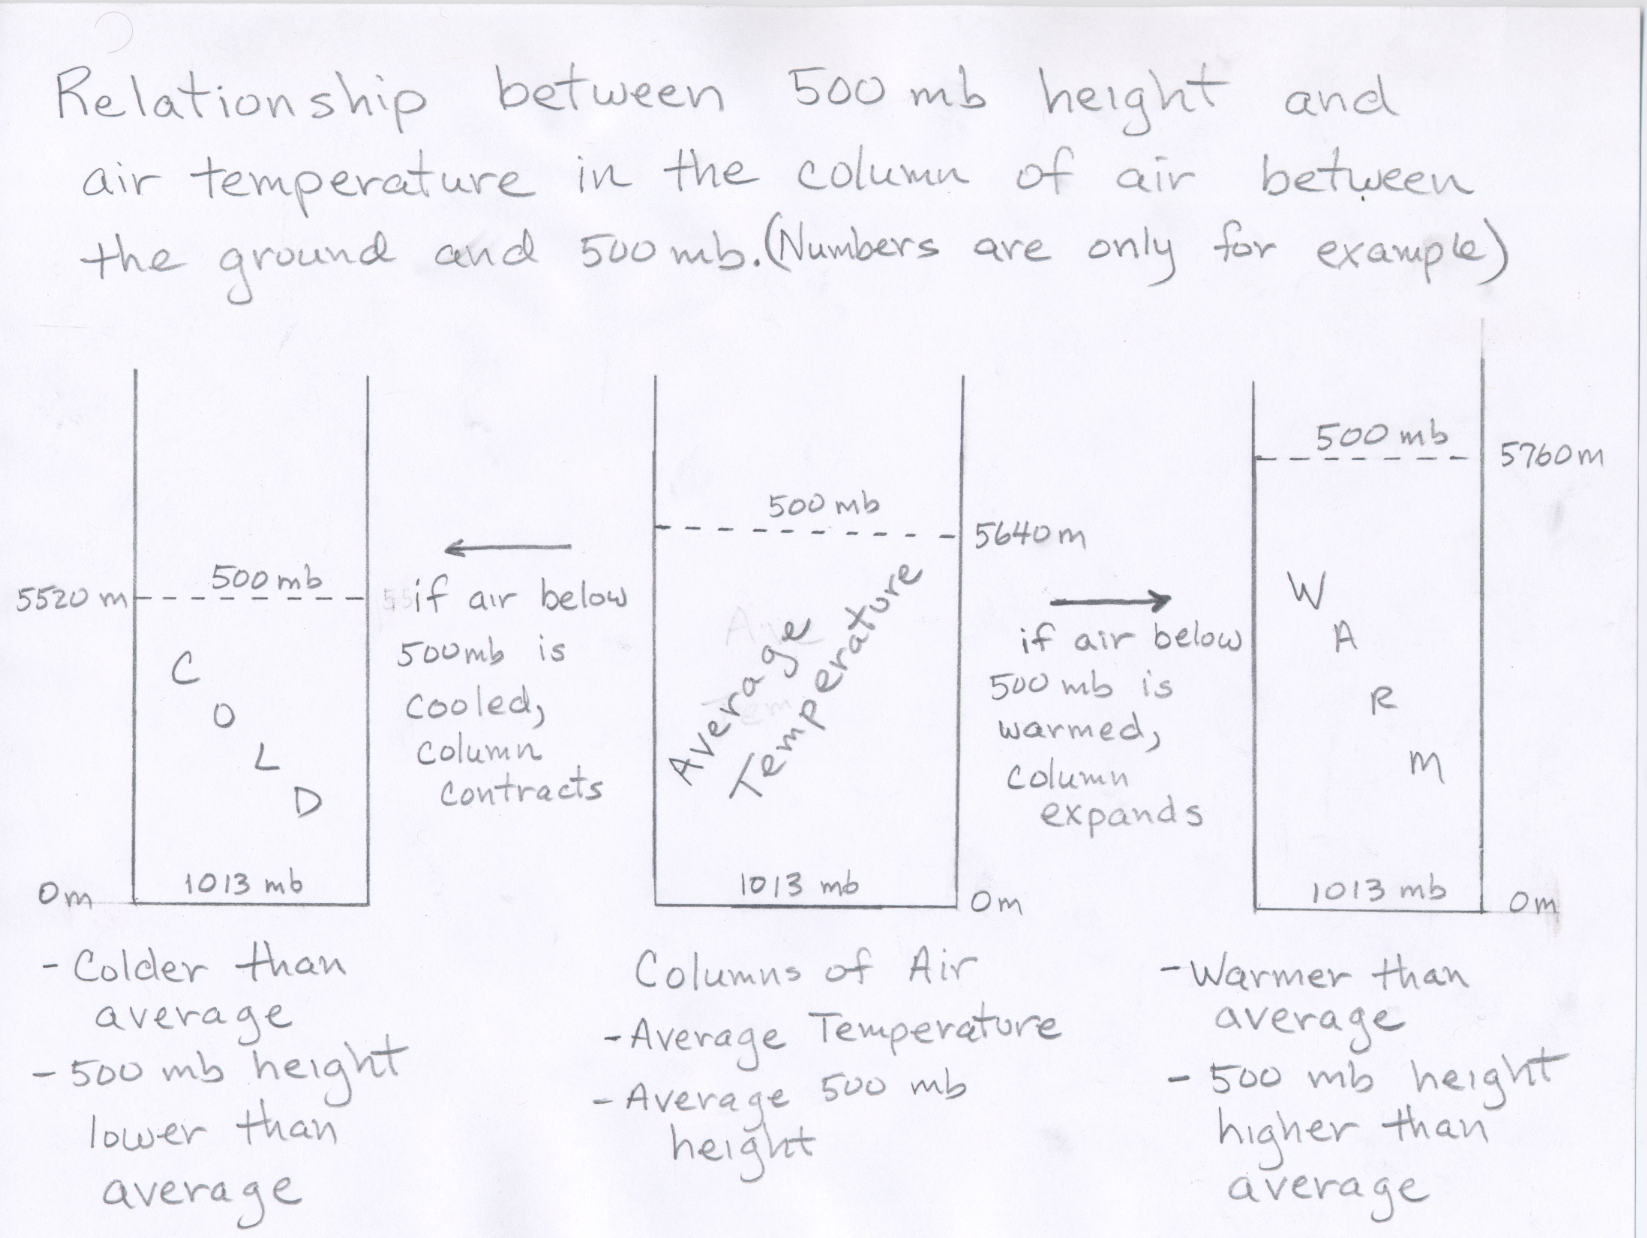
Consider a vertical column of air that extends from the ground surface upward to the top of the atmosphere. Assume that no air is allowed to enter or leave the column. This means that no matter what we do to the temperature of the air in the column, the air pressure at the ground surface will not change (remember that air pressure is determined by the weight of the air above).
If the column of air is heated, it expands upward making the colunm taller. The air pressure at the ground does not change, but the rate at which air pressure decreases with altitude is now slower. The result is that the height of the 500 mb pressure level is now higher. If the column of air is cooled, it contracts, and the 500 mb pressure level becomes lower.
General Rule: Air pressure decreases more slowly with increasing altitude in a warm column of air compared with a colder column of air. This explains why higher 500 mb heights are associated with warmer air and lower 500 mb heights are associated with colder air (review this figure).
Although we will continue to use the 500 mb height to estimate the pattern of air temperature in the lower troposphere (just above the ground surface where we live), it is not exact. In this section, we will discuss a couple of reasons why the 500 mb height is not completely determined by the air temperature in the lower troposphere. In other words, we will point out why the 500 mb height can sometimes be misleading with regard to air temperature just above the ground.
One issue is that the 500 mb height does depend on the sea level air pressure, i.e., the air pressure at ground level. While the average air pressure at sea level is 1013 mb, the actual sea level pressure at a given location and time varies, typically within the range from 983 - 1043 mb. Thus relatively high sea level pressure tends to raise the 500 mb height since the pressure drop from sea level pressure to 500 mb is greater compared to a case where the sea level pressure is lower. To overcome this dependence on sea level pressure, meteorologists often use a measurement called 1000 mb to 500 mb thickness. This is a measure of the vertical distance between the 1000 mb pressure surface and the 500 mb pressure surface. The 1000 - 500 mb thickness is directly related to the average air temperature between 1000 mb and 500 mb without being influenced by variations in surface pressure. Therefore, thickness is a better indicator of how warm or cold the air is in a vertical column above a given location. Note that contour maps of 1000 - 500 mb thickness can be plotted using the University of Wyoming's weather model plotting page.
Another potential problem for interpreting surface air temperature even if using the 1000 - 500 mb thickness is that the 1000 - 500 mb thickness is generally in the range from 4800 to 5700 meters (or about 3 to 3.5 miles). This entire vertical extent need not be uniformly warm or cold, i.e., there can be sublayers of smaller vertical extent that are both relatively warm and relatively cold. For surface temperature, we need to know how warm or cold it is at the bottom of the air column. A better estimate of surface temperature could be obtained by looking at the thickness of a shorter column of air just above the ground surface. For this purpose, meteorologists will look at the 1000 - 850 mb thickness, which is more closely related to the air temperature just above the ground.
The wind at 500 mb can be easily determined from the height pattern. The wind blows parallel to the height contours with lower heights to the left of the wind direction and higher heights to the right of the wind direction. You are expected to be able to tell the wind direction and relative speed of the winds at 500 mb based on the 500 mb height map. You are not expected to understand why the wind blows the way that it does. Based on the maps we have looked at this means that the winds generally blow from west toward east, but follow the wavy pattern of the height contours. This will be shown using the 500 mb maps handed out in class. Keep in mind that this is the wind several thousand meters above the Earth's surface and not the wind that would be felt on the ground.
The wind direction at 500 mb can also help you to understand the relationship between troughs and cold temperatures and ridges and warm temperatures. Winds entering a trough have a component from the north, often bringing colder air from the north toward the south. Winds entering a ridge have a component of the wind from the south, often bring warmer air from the south.
The wind speed is faster where the height lines are closer together, and slower where the height contours are spaced further apart. This will be shown using the 500 mb maps handed out in class. If this helps, you can think of the 500 mb height lines as channels through which the air moves. The wind follows the wavy pattern of the lines, and gets squeezed together where the lines get closer together, resulting in faster winds. This is just how water would flow in a hypothetical channel.
The 500 mb winds can have a large influence on the motion of smaller-scale weather features, such as the movement of surface low pressure areas, the movement of hurricanes, and the movement of individual thunderstorm cells. In this context, smaller-scale means small compared to the size of the larger scale trough and ridge pattern.
Clouds and precipitation are most likely to be occurring just downwind (or downstream) from the location of 500 mb troughs. Following the 500 mb wind flow, this is the region just after the wind has gone through the trough and starts heading toward the next ridge. Click here to see Example map The reason for this is that rising air motion is forced in this part of the flow pattern. Rising motion means that surface air is forced to move upward toward the tropopause. Clouds and precipitation will develop where air rises (as long as there is sufficient water vapor). Conversely, sinking air motion is forced over areas downstream of ridges. Clouds do not develop where air is sinking. Fair weather is most likely in these areas. By looking at the height patterns on a 500 mb map, you should be able to distinguish where clouds and precipitation are most likely and where fair weather is most likely.
This is somewhat simplistic and will not always give you all the details of where it is and is not raining. Since this is not strictly a weather class, we do not have time to cover details. The use of 500 mb maps allows you to make a quick (and often decent) assessment of the large-scale temperature and precipitation patterns.
![]()
![]()
![]()
![]()