| 54a |
F3 |
Grand
Island, NE |
Mar.
13,
1990 |
tornado
cloud is pretty
thick and vertical |
| 61f |
F3 |
McConnell
AFB KS |
Apr.
26,
1991 |
this
is about as close to a
tornado as you're ever likely to get. Try to judge the diameter
of the tornado cloud. What direction are the tornado winds
spinning? |
| 52 |
F5 |
Hesston
KS |
Mar.
13,
1990 |
Watch
closely,
you may see a tree or two uprooted by the tornado winds |
| 51 |
F3 |
North
Platte NE |
Jun.
25,
1989 |
Trees
uprooted
and buildings lifted by the tornado winds |
| 65 |
F1 |
Brainard
MN |
Jul.
5,
1991 |
It's
a good
thing this was only an F1 tornado |
| 57 |
F2 |
Darlington
IN |
Jun.
1,
1990 |
Tornado
cloud
without much dust |
| 62b |
F2 |
Kansas
Turnpike |
Apr.
26,
1991 |
It's
sometimes
hard to run away from a tornado. Watch closely you'll see a van
blown off the road and rolled by the tornado. |
| 47 |
F2 |
Minneapolis
MN |
Jul.
18,
1986 |
Tornado cloud appears and disappears. |

| F0 |
|
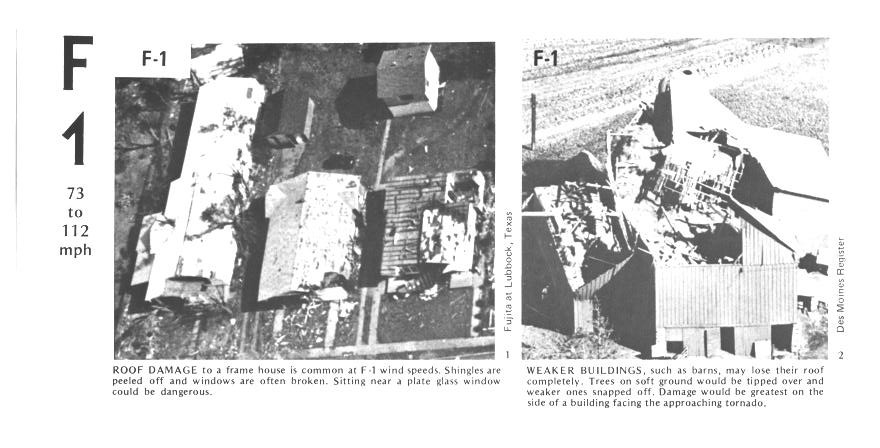
| F1 |
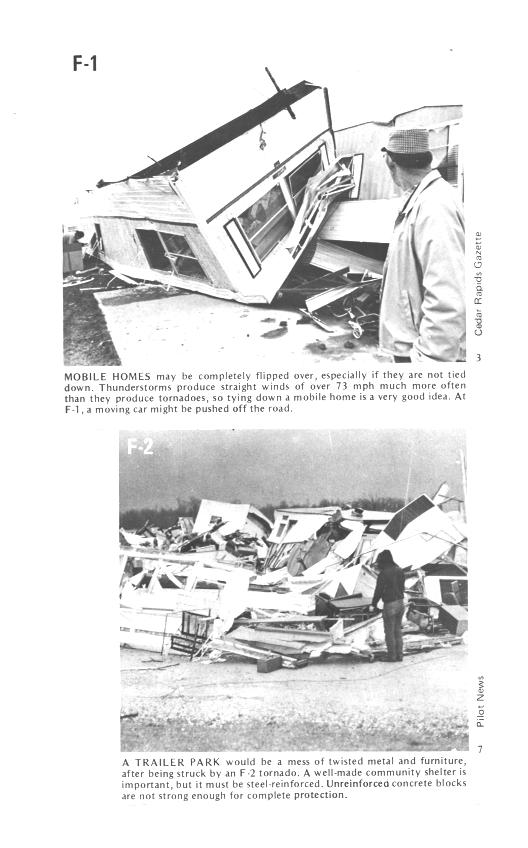
roof
damage, mobile home tipped over |
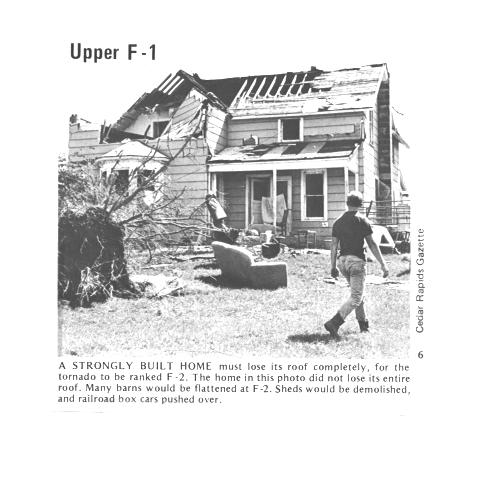
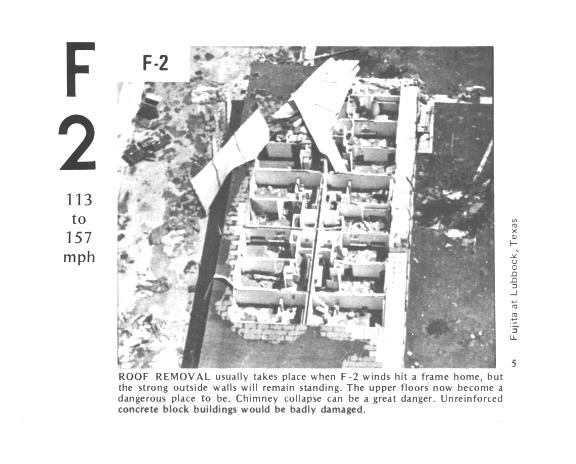
| F2 |
roof
gone, outside walls still standing |
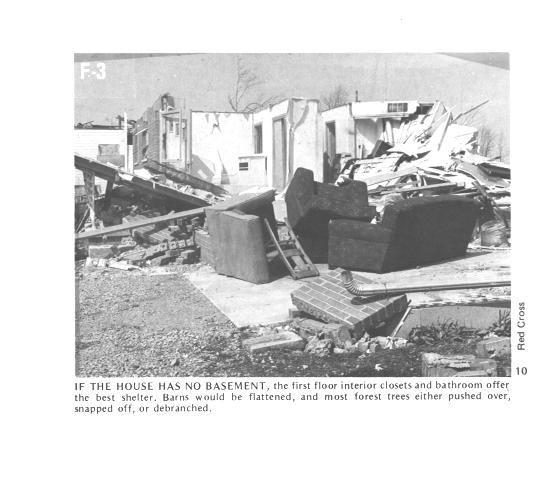
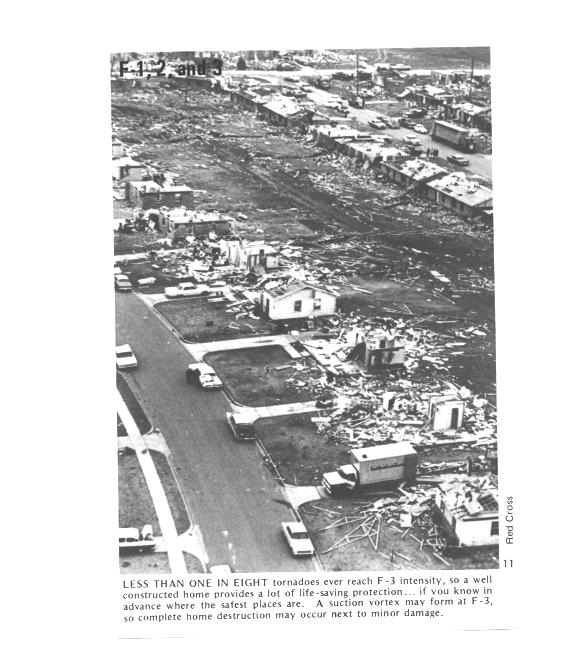
| F3 |
outside
walls gone, inside walls intact |
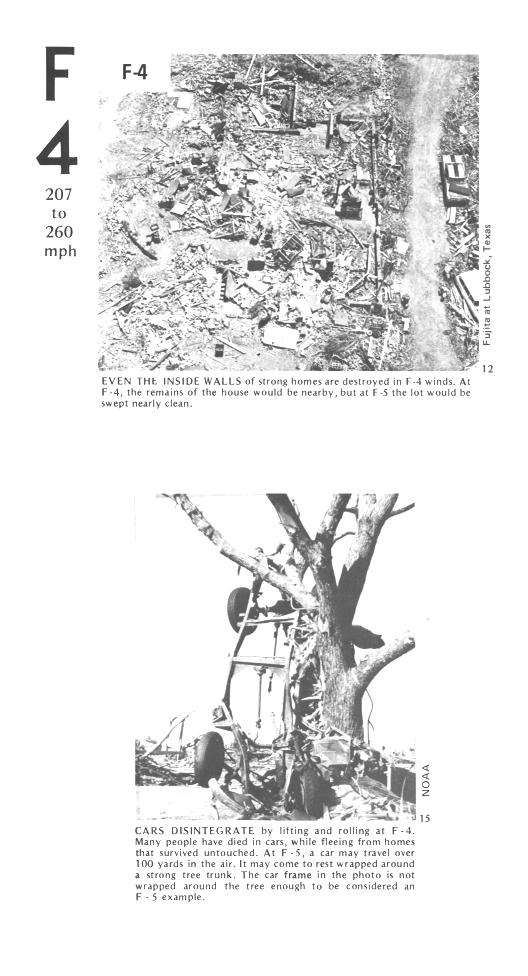
| F4 |
home
destroyed, debris nearby |
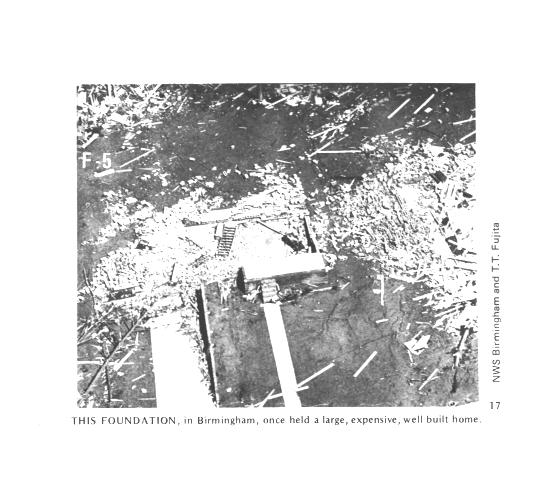
| F5 |
home
destroyed, debris carried away |