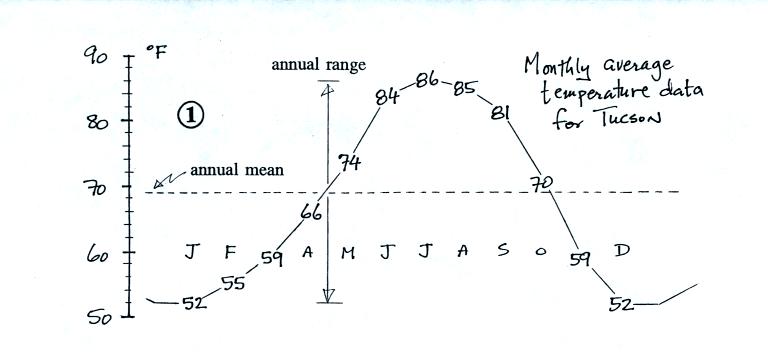
| Average Monthly Temp |
Month |
Average Max Temp |
Average Min Temp |
Difference |
Precipitation |
| 52 |
Jan |
64 |
39 |
25 |
0.99 |
| 55 |
Feb |
68 |
42 |
26 |
0.88 |
| 59 |
Mar |
73 |
45 |
28 |
0.81 |
| 66 |
Apr |
82 |
50 |
32 |
0.28 (see
note 2) |
| 74 |
May |
90 |
59 |
31 |
0.24 |
| 84 |
Jun |
100 |
68 |
32 |
0.24 |
| 86 |
Jul |
100 |
73 |
27 |
2.07 (see
note 3) |
| 85 |
Aug |
97 |
72 |
25 |
2.30 |
| 81 |
Sep |
94 |
68 |
26 |
1.45 |
| 70 |
Oct |
84 |
57 |
27 |
1.21 |
| 59 |
Nov |
72 |
45 |
27 |
0.67 |
| 52 |
Dec |
65 |
39 |
26 |
1.07 (see
note 4) |